Introduction
Ischemic stroke remains a major cause of mortality in most countries [1–4] and is the third leading cause of death worldwide [5]. Its estimated incidence is 94 to 117 per 100,000 person-years in 2000–2008 [6], and reportedly, stroke is responsible for more than 17 million deaths worldwide each year [4]. Accordingly, stroke is a major health concern and social burden, and has enormous healthcare costs [1]. Early diagnosis and risk assessment are necessary to reduce stroke-related mortalities. For these reasons, many efforts have been made to identify markers of the severity and prognosis of ischemic stroke and several biomarkers have been proposed for use in ischemic stroke, such as bilirubin, γ-glutamyl transferase, uric acid, fibrinogen, white blood cell (WBC) count, brain natriuretic peptide (BNP) and troponin I (TnI) [1, 2, 6–14], but most are not widely used in clinical practice due to lack of evaluation and validation in well-designed clinical studies.
Stroke is composed of ischemic and hemorrhagic stroke, and ischemic stroke accounts for about 70–90% of all nature events [2, 5, 15]. Furthermore, the majority of them are probably associated with cardioembolism and atherosclerosis. Previous studies have reported that systemic inflammation is associated with disease development and progression in ischemic stroke [2], and serum C-reactive protein (CRP) level is positively associated with disease severity (odds ratio: 2.39, p = 0.0066) [10] and short-term (3–6 months) mortality (odds ratio: 2.3, p < 0.001) [16]. Procalcitonin (PCT) is a 116 amino acid precursor of calcitonin (a hormone produced by thyroid C cells), and its secretion is stimulated by bacterial endotoxins or inflammatory mediators [17]. It is a promising biomarker for the detection of sepsis and pneumonia [18–20], and Mimoz et al. [21] suggested that an elevated PCT level during the early stage after major trauma might be associated with inflammation and not with infection. Furthermore, Li et al. [22] and Katan et al. [23] found that PCT independently predicted mortality in ischemic stroke patients. Others have reported that the discriminatory power of PCT is greater than that of CRP as determined by area under the curve (AUC) analysis [24]. Recently, a small number of studies have shown that PCT to CRP ratio (PC ratio) is a useful biomarker in infectious conditions [24, 25], and it was recently reported that PCT is more strongly associated with functional outcomes and mortality after ischemic stroke than CRP [26]. However, no study has yet investigated the association between PC ratio and prognosis in ischemic stroke. Thus, we hypothesized that PC ratio is associated with disease-related mortality in ischemic stroke patients. Accordingly, the present study aimed to assess and investigate the prognostic value of PC ratio for the prediction of short-term (90-day) mortality after ischemic stroke.
Material and methods
Study design and data collection
We studied the records of all patients admitted to Wonju Severance Christian Hospital (a tertiary university-affiliated hospital located in Wonju, South Korea) with a diagnosis of ischemic stroke over the 10-year period from February 2008 to January 2018. To minimize confounding factors, we excluded patients with trauma, a febrile illness, autoimmune disease, community-acquired pneumonia, or a history of major surgery. Patient data were collected retrospectively from the electronic medical records (EMRs).
We evaluated the relationship between PC ratio (PCT in ng/ml and CRP in mg/l), and short-term (90-day) mortality. Serum PCT levels (reference range: ≤ 0.05 ng/ml) were determined by enzyme-linked fluorescence (VIDAS PCT assay; bioMérieux, Marcy L’Etoile, France), and CRP levels (reference range: < 3.0 mg/l) were determined using an immunoturbidimetric assay (Cobas c 702 module; Roche Diagnostics, Basel, Switzerland). The unit of PC was converted to the same unit as CRP, and PC ratio was calculated as PC divided by CRP, and units were marked as ‘the value × 10–6’. All cases were followed up for more than 90 days.
Demographic and clinical data were as follows: age, gender, systolic/diastolic blood pressure, date of admission and death, and presence of risk factors (history of hypertension, diabetes mellitus, atrial fibrillation, congestive heart failure, coronary artery obstructive disease, and malignancy).
Laboratory data were collected on the following: white blood cell (WBC) count and neutrophil (%) determined by the ADVIA 2120i automated hematology analyzer (Siemens Healthcare Diagnostics Manufacturing Limited, Dublin, Ireland); erythrocyte sedimentation rate (ESR) determined by the TEST-1 analyzer (SIRE Analytical Systems, Udine, Italy); BNP and creatine kinase muscle/brain (CK-MB) determined by the Atellica IM 1600 analyzer (Siemens Healthcare Diagnostics, Tarrytown, NY, USA); fibrin degradation product (FDP), D-dimer and fibrinogen determined by the CS-5100 hemostasis system (Sysmex Corp., Kobe, Japan).
This study was performed after obtaining approval from the institutional review board (IRB) of Wonju Severance Christian Hospital (IRB no. CR318057), which waived the requirement for informed consent. The study was conducted using retrospectively collected data and laboratory results. No personal or medical information, other than items required for analysis, was collected.
Statistical analysis
Initially, the study subjects were divided into survivors and non-survivors, and the baseline characteristics were analyzed. The Kolmogorov-Smirnov test was used to confirm normality for numeric data, and distribution of data was determined as parametric data when the p-value was larger than 0.05. For parametric data, the results were presented as means ± standard deviations (SDs), and were compared using Student’s t-test. For non-parametric data, the results were presented as medians and interquartile ranges (IQRs), and were compared using the Mann-Whitney U test.
Then, we compared the abilities of various parameters including PCT, CRP, and PC ratio to predict 90-day mortality, using receiver operating characteristic (ROC) curve analysis. The values of area under the curve (AUC) were calculated. At the point where the sensitivity and specificity are equal, the specificity was low (50–65%). Therefore, to minimize the false positive rate, thresholds at a fixed high specificity (80%) were calculated. For laboratory findings, the number of patients with an abnormal value (above the threshold) was further analyzed.
We also further evaluated the diagnostic performance depending on various PC ratio cut-off values for estimating the mortality of stroke patients. The sensitivity, specificity, positive predictive value, negative predictive value, agreement rate, and positive likelihood ratio, and negative likelihood ratio were calculated according to various cut-off values.
Results for numeric data were compared using analysis of variance (ANOVA) or the Kruskal-Wallis test (for parametric or non-parametric data, respectively), and when significant differences were found Tukey’s adjustment was used for pairwise comparisons.
Categorical data were presented as frequencies and percentages, and group categorical variables were compared using the χ2 test. Univariate and multivariate logistic regression analyses were performed before and after adjusting for confounders. Survival analysis was performed using the Kaplan-Meier estimation, and statistical significance was confirmed using the log rank test. For all statistical analysis, p < 0.05 was considered as statistically significant.
The analysis was performed using SPSS version 20.0 (IBM Corp., Armonk, NY, USA) and Analyse-it version 5.01 (Analyse-it Software, Ltd., Leeds, UK) added-in Microsoft Excel (Microsoft Corporation, Redmond, WA, USA).
Results
Baseline characteristics
A total of 675 patients who met our selection criteria from February 2008 to January 2018 were recruited in this study. Of these, 333 had both PCT and CRP results and were included in the analysis. Baseline characteristics of the 333 study subjects are provided in Table I. Short-term survival (90-days) was evaluated for all patients; 65 (19.5%) patients died within the 90-day follow-up period. In terms of medical histories, heart failure was more frequent (p = 0.041) and systolic blood pressure was higher (p = 0.032) in non-survivors. In terms of laboratory findings, the percentages of patients with abnormal neutrophils (%) and PCT were much higher in non-survivors than in survivors (p = 0.023 and < 0.001, respectively). On the other hand, when the basic characteristics of the study subjects were divided into genders and analyzed in the same way, there was no significant difference between males and females (p > 0.05 for all).
Table I
Baseline characteristics of stroke patients
| Baseline variables | Survival | Non-survival | P-value | Male | Female | P-value |
|---|---|---|---|---|---|---|
| N (%) | 268 (80.5) | 65 (19.5) | – | 201 (60.4) | 132 (39.6) | – |
| Age [years], mean ± SD: | 73.1 ±13.5 | 72.4 ±12.3 | 0.719 | 71.1 ±14.0 | 75.3 ±11.5 | 0.419 |
| Male, n (%) | 161 (60.1) | 40 (61.5) | 0.829 | – | ||
| Female, n (%) | 107 (39.9) | 25 (38.5) | ||||
| Medical history of, n (%): | ||||||
| Hypertension | 42 (15.1) | 9 (13.8) | 0.714 | 33 (16.4) | 18 (13.6) | 0.536 |
| Diabetes mellitus | 22 (8.2) | 6 (9.2) | 0.790 | 20 (10.0) | 8 (6.1) | 0.233 |
| Atrial fibrillation | 35 (13.1) | 10 (15.4) | 0.623 | 25 (12.4) | 20 (15.2) | 0.514 |
| Heart failure | 9 (3.4) | 6 (9.2) | 0.041* | 8 (4.0) | 7 (5.3) | 0.597 |
| Coronary artery occlusive disease | 9 (3.4) | 2 (3.1) | 0.909 | 5 (2.5) | 6 (4.5) | 0.355 |
| Malignancy | 17 (6.3) | 2 (3.1) | 0.308 | 13 (6.5) | 11 (8.3) | 0.524 |
| Clinical findings, mean ± SD [mm Hg]: | ||||||
| Systolic blood pressure | 128.3 ±29.3 | 118.4 ±26.7 | 0.032* | 125.9 ±28.4 | 127.4 ±29.8 | 0.701 |
| Diastolic blood pressure | 74.1 ±16.7 | 71.8 ±18.2 | 0.386 | 74.7 ±16.8 | 72.2 ±17.7 | 0.280 |
| Laboratory findings†, n (%): | ||||||
| White blood cells: 15.5 × 10⁹/l | 54 (19.6) | 16 (28.1) | 0.156 | 43 (21.4) | 27 (20.5) | 0.891 |
| Neutrophil: 88.2% | 56 (20.3) | 20 (35.1) | 0.023* | 46 (22.9) | 30 (22.7) | 0.999 |
| PCT: 1.3 ng/ml | 52 (18.8) | 24 (42.1) | < 0.001* | 46 (22.9) | 30 (22.7) | 0.999 |
| CRP: 159.0 mg/l | 57 (20.7) | 14 (24.6) | 0.484 | 50 (24.9) | 21 (15.9) | 0.056 |
| ESR: 18.0 mm/h | 181 (65.6) | 31 (54.4) | 0.130 | 125 (62.2) | 87 (65.9) | 0.560 |
| BNP: 453.6 pg/ml | 30 (10.9) | 10 (17.5) | 0.179 | 20 (10.0) | 20 (15.2) | 0.170 |
| CK-MB: 3.3 ng/ml | 180 (65.2) | 38 (66.7) | 0.879 | 133 (66.2) | 85 (64.4) | 0.814 |
| FDP: 22.2 µg/ml | 30 (10.9) | 11 (19.3) | 0.118 | 21 (10.4) | 20 (15.2) | 0.234 |
| D-dimer: 1569.0 mg/l | 34 (12.3) | 13 (22.8) | 0.057 | 20 (10.0) | 27 (20.5) | 0.010* |
| Fibrinogen: 385.0 mg/dl | 116 (42.0) | 21 (36.8) | 0.555 | 76 (37.8) | 61 (46.2) | 0.140 |
SD – standard deviation, IQR – interquartile range, PCT – procalcitonin, CRP – C-reactive protein, ESR – erythrocyte sedimentation rate, BNP – B-natriuretic peptide, CK-MB – creatine kinase-muscle/brain, FDP – fibrin degradation product.
† The number and percentage of patients with abnormal laboratory findings (above the threshold value determined in Table II) are shown.
Predictive abilities of PCT, CRP, and PC ratio
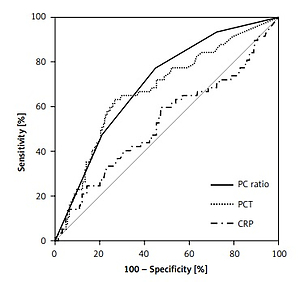
Both PCT and CRP values in non-survivors tended to be higher than in survivors, but did not show statistical significance. However, median PC ratios were significantly higher for non-survivors (16.5, IQR: 4.4–45.6) than survivors (5.0, IQR: 2.0–17.0) (p = 0.002). The results of ROC curve analysis are shown in Figure 1 and Table II. And, the diagnostic performances depending on various PC ratio cut-off values for estimating the mortality of stroke patients are shown in Supplementary Table SI (means and 95% confidence intervals are displayed).
Figure 1
Receiver operating characteristic (ROC) curves of procalcitonin (PCT), C-reactive protein (CRP), and procalcitonin to C-reactive protein (PC) ratio for the prediction of 90-day mortality in ischemic stroke patients
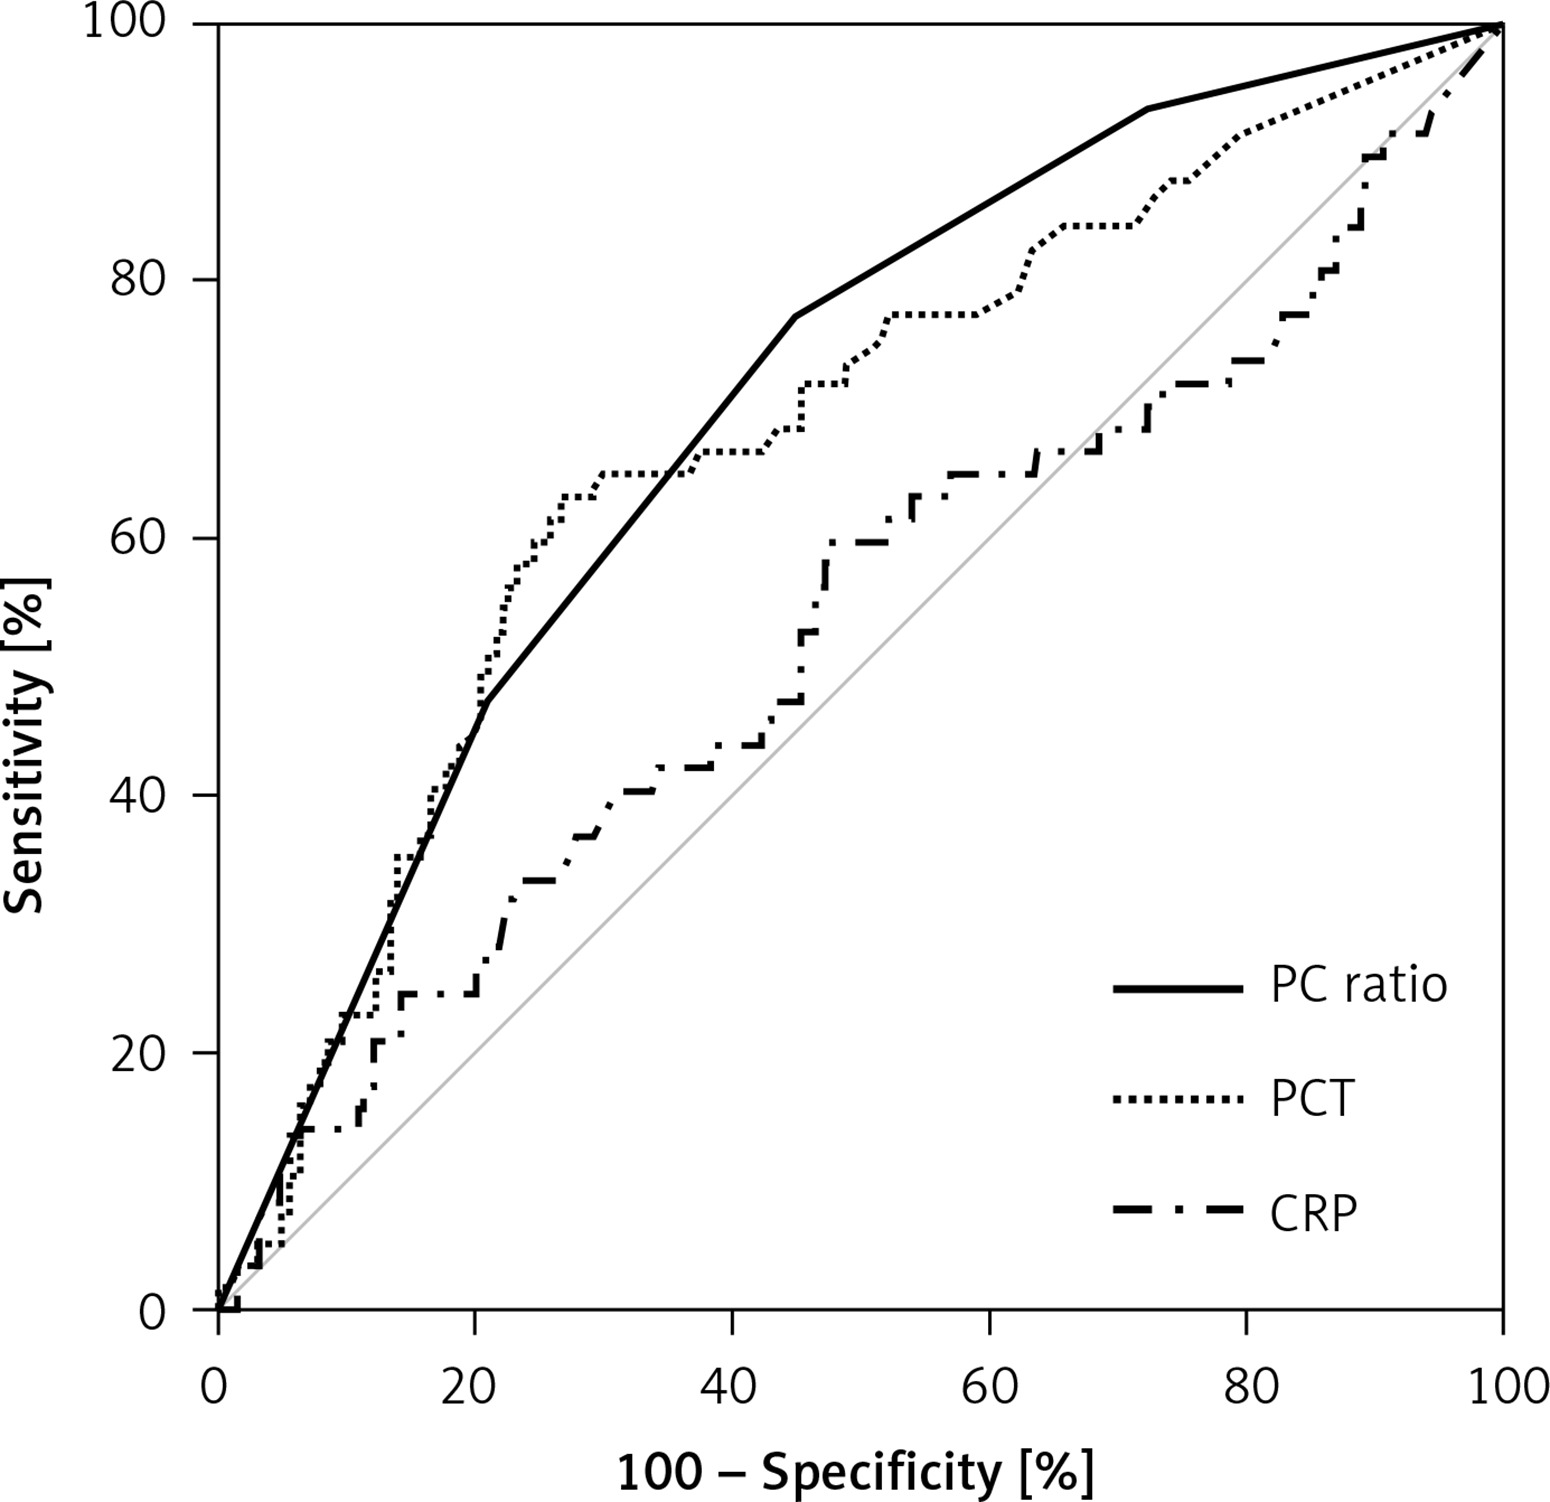
Table II
Receiver operating characteristics curve analysis
[i] AUC – area under curve, CI – confidence interval, PCT – procalcitonin, CRP – C-reactive protein, PC ratio – procalcitonin to C-reactive protein ratio, WBC – white blood cells, ESR – erythrocyte sedimentation rate, BNP – brain natriuretic peptide, CK-MB – creatine kinase muscle/brain, FDP – fibrin degradation product.
The relationship between PC ratio and associated variables
The 333 study subjects were allocated to PC ratio (× 10–6) quartiles, which were as follows: first quartile 0–2.1, second quartile 2.2–6.3, third quartile 6.4–19.6, and fourth quartile ≥ 19.7. Table III provides a summary of patients’ characteristics by PC ratio quartile. Most laboratory items showed a statistically significant association (p < 0.05), but only PCT showed a significant increase with each quartile (p for trend < 0.05).
Table III
Patient characteristics according to quartiles of procalcitonin to C-reactive protein (PC) ratio
| Baseline variables | Q1§ | Q2§ | Q3§ | Q4§ | P-value |
|---|---|---|---|---|---|
| n (%) | 83 (24.9) | 84 (25.3) | 83 (24.9) | 83 (24.9) | – |
| Age [years], mean ± SD: | 74.0 α14.3 | 74.8 α10.4 | 72.3 α11.1 | 70.1 α16.0 | 0.096 |
| Male, n (%) | 54 (65.1) | 50 (59.5) | 48 (57.8) | 49 (59.0) | 0.783 |
| Female, n (%) | 29 (34.9) | 34 (40.5) | 35 (42.2) | 34 (41.0) | |
| Medical history of, n (%): | |||||
| Hypertension | 11 (13.3) | 20 (23.8) | 10 (12.0) | 10 (12.0) | 0.097 |
| Diabetes mellitus | 6 (7.2) | 7 (8.3) | 8 (9.6) | 7 (8.4) | 0.957 |
| Atrial fibrillation | 11 (13.3) | 17 (20.2) | 6 (7.2) | 11 (13.3) | 0.109 |
| Heart failure | 4 (4.8) | 4 (4.8) | 4 (4.8) | 3 (3.6) | 0.977 |
| Coronary artery occlusive disease | 1 (1.2) | 2 (2.4) | 2 (2.4) | 6 (7.2) | 0.134 |
| Malignancy | 6 (7.2) | 5 (6.0) | 6 (7.2) | 2 (2.4) | 0.493 |
| Clinical findings [mm Hg], mean ± SD: | |||||
| Systolic blood pressure | 129.6 ±18.7 | 128.1 ±22.3 | 130.6 ±28.8 | 116.8 ±41.3 | 0.035* |
| Diastolic blood pressure | 74.5 ±11.6 | 74.2 ±13.8 | 78.3 ±19.9 | 67.7 ±20.7 | 0.008* |
| Laboratory findings†, n (%): | |||||
| White blood cells: 15.5 × 10⁹/l | 9 (10.8) | 20 (23.8) | 16 (19.3) | 25 (30.1) | 0.020* |
| Neutrophil: 88.2% | 7 (8.4) | 17 (20.2) | 17 (20.5) | 35 (42.2) | < 0.001* |
| PCT: 1.3 ng/ml | 0 (0.0) | 2 (2.4) | 16 (19.3) | 58 (69.9) | < 0.001* |
| CRP: 159.0 mg/l | 17 (20.5) | 10 (11.9) | 15 (18.1) | 29 (34.9) | 0.014* |
| ESR: 18.0 mm/h | 62 (74.7) | 57 (67.9) | 46 (55.4) | 47 (56.6) | 0.026* |
| BNP: 453.6 pg/ml | 5 (6.0) | 7 (8.3) | 10 (12.0) | 18 (21.7) | 0.010* |
| CK-MB: 3.3 ng/ml | 59 (71.1) | 56 (66.7) | 46 (55.4) | 57 (68.7) | 0.429 |
| FDP: 22.2 µg/ml | 5 (6.0) | 6 (7.1) | 11 (13.3) | 19 (22.9) | 0.003* |
| D-dimer: 1569.0 mg/l | 9 (10.8) | 12 (14.3) | 9 (10.8) | 17 (20.5) | 0.236 |
| Fibrinogen: 385.0 mg/dl | 28 (33.7) | 36 (42.9) | 30 (36.1) | 43 (51.8) | 0.081 |
PC ratio – procalcitonin to C-reactive protein ratio, SD – standard deviation, IQR – interquartile range, PCT – procalcitonin, CRP – C-reactive protein, ESR – erythrocyte sedimentation rate, BNP – B-natriuretic peptide, CK-MB – creatine kinase-muscle/brain, FDP – fibrin degradation product.
† The number and percentage of patients with abnormal laboratory findings (above the threshold value determined in Table II) are shown.
Survival analysis according to PC ratio
Logistic regression was used to evaluate the association between PC ratio and 90-day survival. Table IV summarizes univariate and multivariate logistic regression results obtained after adjusting for possible confounders. Univariate logistic regression analysis showed that patients in the third and fourth PC ratio quartiles had higher 90-day mortality rates than patients in the first quartile; patients in the second quartile showed a non-significant increase. Multivariate logistic regression adjusted for age, sex, medical history, and laboratory findings (e.g., glucose, neutrophils (%), lymphocytes (%), monocytes (%), and fibrinogen) showed similar findings.
Table IV
Univariate and multivariate logistic regression of the association between procalcitonin to C-reactive protein (PC) ratio and 90-day mortality
| PC ratio quartiles | Univariate | Multivariate 1† | Multivariate 2§ | |||
|---|---|---|---|---|---|---|
| OR (95% CI) | P-value | OR (95% CI) | P-value | OR (95% CI) | P-value | |
| First quartile | 1 | – | 1 | – | 1 | – |
| Second quartile | 1.56 (0.60–4.05) | 0.358 | 1.59 (0.61–4.13) | 0.350 | 1.47 (0.62–4.20) | 0.440 |
| Third quartile | 2.49 (1.01–6.15) | 0.048* | 2.56 (1.04–6.43) | 0.046* | 2.54 (0.95–5.91) | 0.048* |
| Fourth quartile | 4.52 (1.91–10.70) | 0.001* | 4.89 (1.98–11.31) | < 0.001* | 4.10 (1.73–9.80) | 0.002* |
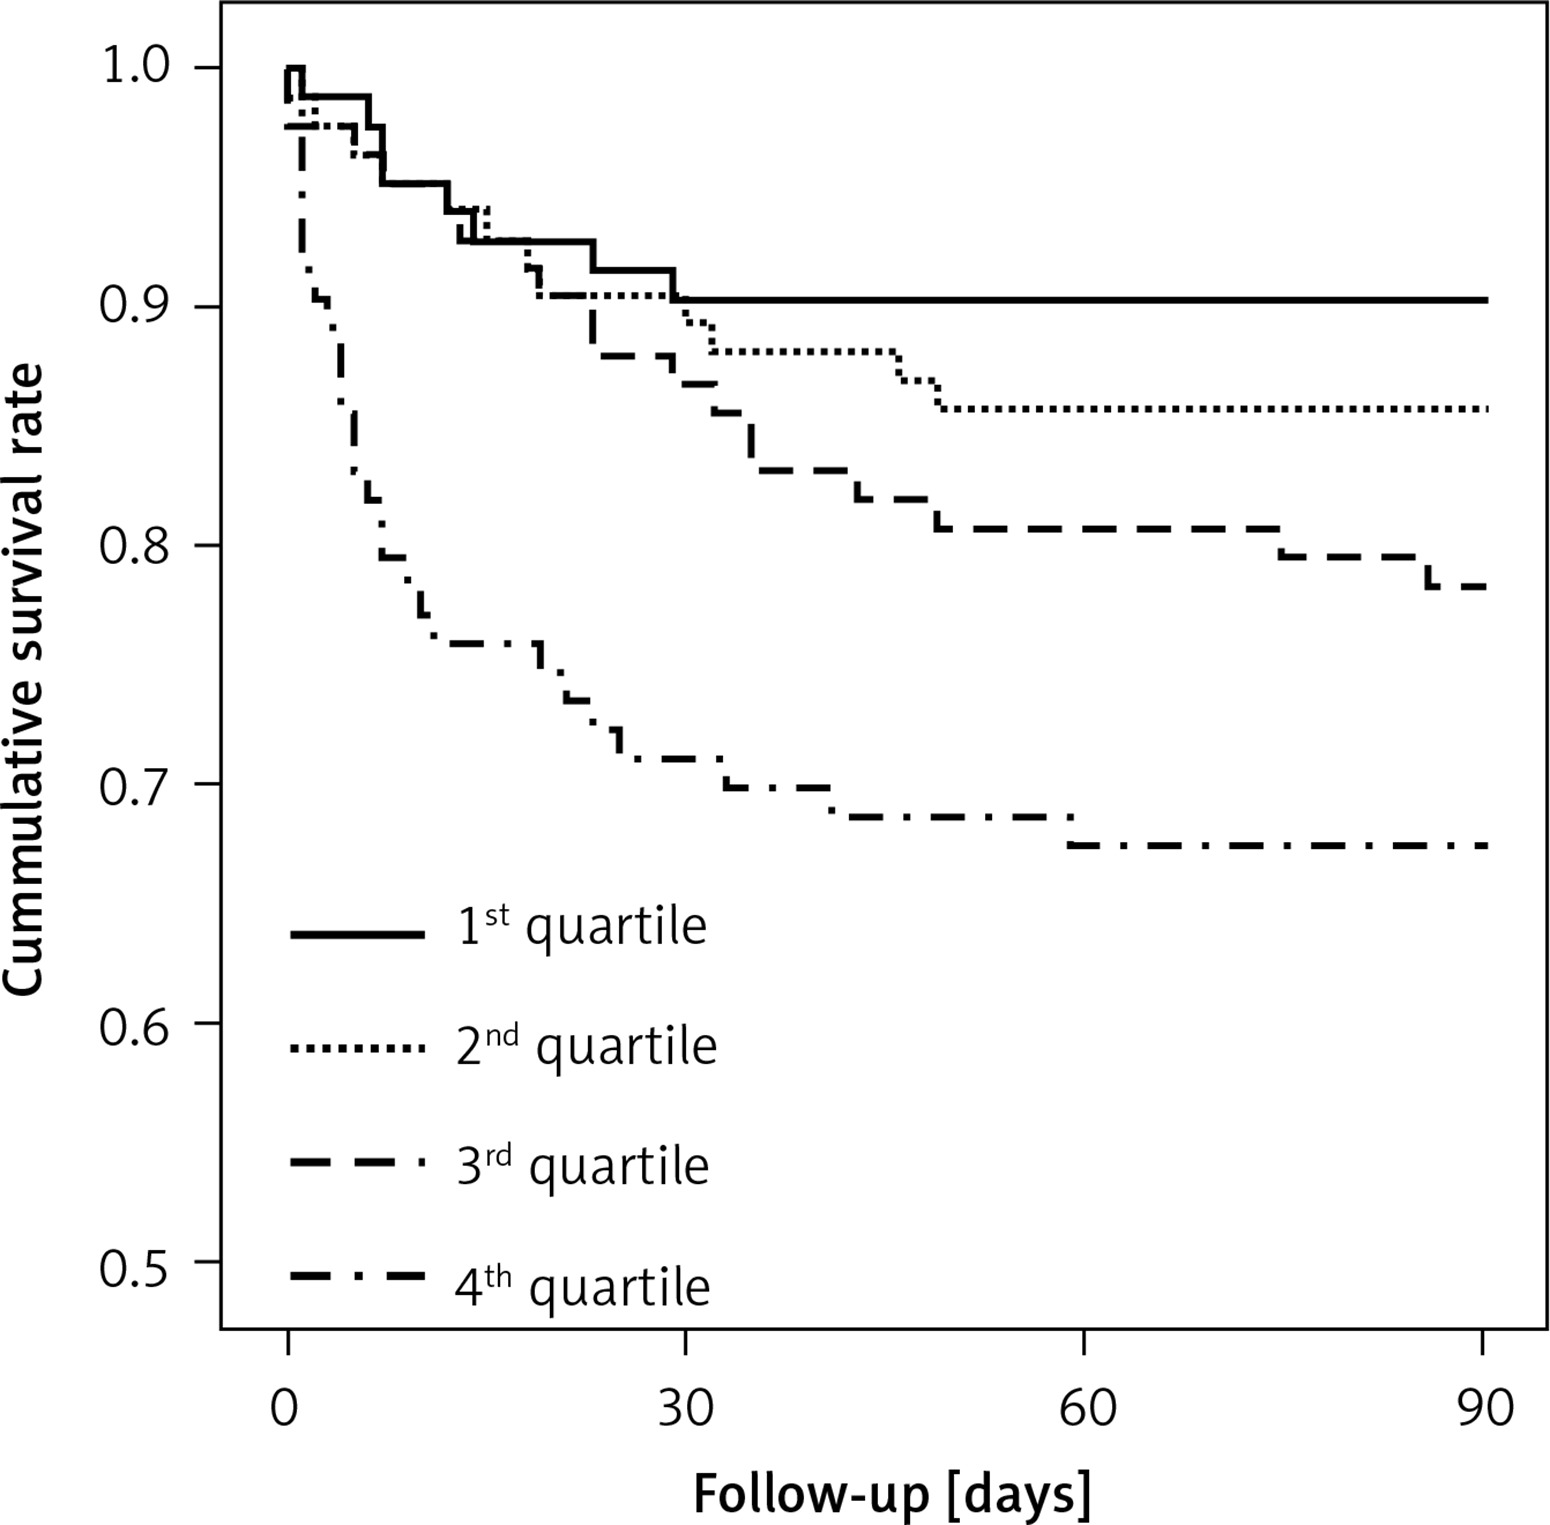
Survival rates at 90 days after admission were inversely correlated with PC ratio quartiles (p for trend = 0.001). Furthermore, the percentage of non-survivors who died during the 7-day period after admission was greatest in the fourth quartile (Table V).
Table V
Mortality rates for procalcitonin to C-reactive protein (PC) ratio quartiles
| Characteristic | N (%) | P-value | |||
|---|---|---|---|---|---|
| Q1* | Q2* | Q3* | Q4* | ||
| 90-day mortality: | |||||
| Survival | 74 (89.2) | 72 (85.7) | 66 (79.5) | 56 (67.5) | 0.001* |
| Non-survival | 9 (10.8) | 12 (14.3) | 17 (20.5) | 27 (32.5) | |
| Gender difference: | |||||
| Male: | |||||
| Total death | 5 (6.0) | 6 (7.2) | 11 (13.2) | 20 (24.1) | 0.223 |
| Neurological | 2 (2.4) | 1 (1.2) | 3 (3.6) | 9 (10.8) | |
| Female: | |||||
| Total death | 4 (4.8) | 6 (7.2) | 6 (7.2) | 7 (8.4) | |
| Neurological | 0 (0.0) | 4 (4.8) | 3 (3.6) | 4 (4.8) | |
| Cause of death: | |||||
| Neurological event | 2 (2.4) | 5 (6.0) | 6 (7.2) | 13 (15.7) | 0.187 |
| Pneumonia | 2 (2.4) | 2 (2.4) | 3 (3.6) | 3 (3.6) | |
| Sepsis | 2 (2.4) | 0 (0.0) | 3 (3.6) | 7 (8.4) | |
| Cardiac event | 2 (2.4) | 2 (2.4) | 2 (2.4) | 1 (1.2) | |
| Other or unknown | 1 (1.2) | 3 (3.6) | 3 (3.6) | 3 (3.6) | |
| Length of survival: | |||||
| Died 0–7 days | 2 (2.4) | 3 (3.6) | 2 (2.4) | 15 (18.1) | 0.008* |
| Died 8–15 days | 3 (3.6) | 2 (2.4) | 4 (4.8) | 4 (4.8) | |
| Died 16–30 days | 3 (3.6) | 3 (3.6) | 5 (6.0) | 4 (4.8) | |
| Died 31–60 days | 0 (0.0) | 3 (3.6) | 5 (6.0) | 3 (3.6) | |
| Died 61–90 days | 1 (1.2) | 1 (1.2) | 1 (1.2) | 1 (1.2) | |
We further analyzed the percentages of non-survivors at 90 days by gender difference, but there was no statistically significant association. The causes of death were also analyzed. However, there was no significant difference according to PC ratio quartile, even divided by neurological and non- neurological cause.
Kaplan-Meier survival estimates by PC ratio quartile are shown in Figure 2. Furthermore, survival rates were found to be significantly and negatively associated with PC ratio quartiles (p < 0.001).
Discussion
The results of this study suggest that PC ratio was positively correlated with short-term (90-day) mortality in ischemic stroke patients. A previous study suggested that serum PCT and CRP are associated independently with prognosis in ischemic stroke, though PCT showed greater discriminatory power than CRP in ischemic stroke patients [22]. In our ROC curve analysis, no parameter showed a good AUC value above 0.8. However, PCT had the highest AUC value among them, and in the combination of each marker, PC ratio showed the best AUC value. A previous study attempted to identify the relationship between stroke severity and several combinations of known indicators, such as the ratio of two indicators, rather than an individual parameter alone [27]. Therefore, we focused on the value of PCT and CRP as prognostic markers in ischemic stroke.
In this study, we found that non-survivors showed a much higher proportion of patients with an abnormal PCT level than survivors, and a higher PC quartile was correlated with a higher short-term (90-day) mortality. Some previous studies have assessed the prognostic value of PCT in patients with ischemic stroke [22, 23] and cardiovascular disease [28]. Our findings were the first to analyze the relationship between PC ratio and ischemic stroke, which is difficult to compare with previous research results. However, the prognostic value of PCT in inflammatory conditions such as ischemic stroke as shown in this study is supported by the results from these previous studies.
It has been reported that serum PCT level is a useful diagnostic and prognostic marker for bacterial infections [18–21, 24–26]. The specificity of PCT for bacterial infections was demonstrated in a study which showed that mediators of viral infections attenuate PCT levels [17]. Accordingly, studies on PCT have focused on its relations with infectious diseases such as pneumonia and sepsis. CRP is also a useful marker of inflammation, but because of the non-specific nature of its elevation, disease predictions based on CRP levels have limitations in clinical practice [24, 29].
For the reasons mentioned above, PCT and CRP have been studied with a focus on infectious diseases and relatively few have addressed relations between them and aspects of ischemic stroke. Nevertheless, it has been reported that CRP elevation is associated with higher risks of atherosclerotic or atheroembolic diseases [16, 30], and that CRP is related to acute ischemic stroke severity, etiologic subtype [16], and prognosis [31]. In addition, it has been reported that some non-infectious conditions appear to stimulate PCT secretion into circulation [21, 29, 31, 32]. Although the role played by PCT in non-infectious inflammatory conditions has not been determined, it seems that PCT increases during the early phase of inflammation are associated with inflammatory disease progression.
Cardioembolic stroke is the subtype of ischemic infarcts with the highest in-hospital mortality, around 20%. Furthermore, the short-term prognosis of patients with cardioembolic stroke is poor compared to other ischemic stroke subtypes [33]. Therefore, early diagnosis and risk assessment is important for stroke management. Although this study is a preliminary report and it will require a lot of further research to prove it, we might be able to see the possibility for the use of PCT as a predictive marker of ischemic stroke. The findings in our study are partially consistent with some previous studies in some aspects.
The present study has several limitations. The first is that it was based on a retrospective review of medical chart data in one institution and was not a case control study. Furthermore, other possible confounders, such as concurrent renal disease or malignancy, and medical history, could not be fully assessed. The second limitation is that we did not reflect dietary factors for analysis. A previous study suggested that dietary factors influence all-cause mortality [4]. This is one of our limitations.
The third limitation is that it did not reflect the different ischemic stroke subtypes or severity based on the imaging study data. This is a preliminary new study using a combination of laboratory tests for screening the severity of stroke patients. We think that a specific stroke subtype study should be added in future prospective validation research. In this study, we demonstrated that routine clinical laboratory tests can have a new diagnostic value to evaluate stroke severity. If this new analysis has clinical significance for screening stroke severity diagnosis, it can be effective and economical for another diagnostic approach.
The fourth limitation is that PCT and CRP measurements were made at admission time only, and it has been shown that serial measurements have more predictive power than single values [34, 35]. However, it is also known that PCT at admission time is an important predictor of the presence of infectious disease.
Nevertheless, we found that an elevated initial PCT level was correlated with prognosis in ischemic stroke. In fact, the present study is the first to address the relationship between PC ratio and prognosis in ischemic stroke. Previous studies have focused on the relation between PCT and prognosis in non-infectious conditions, such as trauma and stroke [21–23]. Others have reported that PC ratio has predictive value in infectious conditions, such as community-acquired pneumonia and sepsis [24, 25]. In the present study, we found that higher PC ratios were negatively correlated with survival duration and survival rates.
We also assessed stroke risk according to gender difference. Arboix et al. reported that women differ from men in the distribution of risk factors, stroke subtype, stroke severity, and outcome [36]. As mentioned above, however, in our study there was no significant difference in survival rate by gender difference, and no difference in ESR or CRP level. In addition, there was no significant difference in the causes of death (neurological or non-neurological) according to either gender or PC ratio.
In conclusion, in this study, we found that higher PC ratios were positively correlated with 90-day mortality in ischemic stroke patients. We suggest that PC ratio is a useful blood marker for predicting the mortality of ischemic stroke. Therefore, we suggest PC ratio might be used as a new additive screening tool for evaluation of short term mortality of stroke patients. Further well-organized large-scale studies are needed to confirm our results and elucidate the mechanistic link between PC ratio and the pathogenesis of ischemic stroke. In addition, more prospective studies are required to validate the association between PC ratio and short-term mortality in clinical practice.