Introduction
Adverse events, including death, occur frequently during hospitalizations. To date, numerous articles regarding in-hospital deaths have been published, mostly focusing on deaths related to specific causes or groups of diseases. For instance, Gierlotka et al. analyzed nationwide data on acute myocardial infarction patients in 2009–2012, finding a mortality rate of 8.5% [1]. In another study, Ovbiagele assessed nationwide patterns in hospital deaths of patients who experienced an acute stroke and found that about 10% of cases of patients hospitalized after a stroke resulted in death [2]. There are also studies assessing mortality in specific hospital departments, mostly intensive care units [3, 4]. Other studies, when analyzing large and very large populations [5–11], did not distinguish between surgical and non-surgical deaths or showed only surgical mortality [12]. However, there are no studies assessing non-surgical mortality in a large population (of any country) across all diseases or disease groups.
It is well known that the population over the age of 65 is significantly and rapidly growing. Consequently, hospitalizations of elderly patients are more frequent, consume a large amount of financial resources allocated to health care, and in comparison to hospitalizations of younger patients carry a higher risk of being prolonged, complicated by adverse events and terminated with death [13]. Indeed, in spite of the fact that the elderly account for a large percentage of patients who die in hospitals [11, 14], most of the data published on this subject are available for relatively small populations and are limited to subjects admitted to geriatric/internal disease departments [15–17] or to intensive care units [18], or include only patients suffering from a single disease or diseases related to a single organ or system (e.g. cardiovascular disease) [19], or exclude malignancies [20].
Taking into account the fact that there are no published data on age-dependent non-surgical in-hospital mortality across all diseases or disease-related groups, the aim of this study was to assess such mortality statistics in a large, nationwide study with a special focus on the elderly.
Material and methods
Data for the years 2009–2013 were obtained from the database of the National Health Fund (NHF), a public organization financing medical procedures in Poland. This is a particularly valuable source of information, because almost 100% of Polish citizens are insured by the NHF [21] and any healthcare service paid for by the NHF (regardless of whether the health service provider is state- or privately owned) must be contracted with this institution and reported to it. Health service providers establish and maintain electronic registers of services. Complete data on all patients must be entered in all hospitals in the country on the day of discharge or death. The data that must be transferred to the NHF include the patient’s name, personal ID number, sex, age, and type of discharge (nine types, including death), diagnosis according to ICD-10, number of the diagnosis-related group (DRG) [21], and the major diagnostic category. Non-surgical procedures are divided by the algorithm of the NHF computer system according to DRGs: nervous system, gastrointestinal tract, biliary tract, liver and pancreas and spleen, heart and circulation, vascular, respiratory system, endocrine system, bone and muscles, haemopoietic system, intoxications and infectious diseases, head and neck, skin and mammary gland, genitourinary tract, female genital tract. However, for the purpose of the current analysis, some DRG sections have been merged: the heart and circulation section was analyzed together with the vascular section; the gastrointestinal tract section with the liver, biliary tract, pancreas and spleen sections; and the genitourinary tract section was merged with female genital tract diseases.
Only data regarding non-surgical hospitalizations of adult patients (≥ 18 years) were included in this study. “In-hospital death” was defined as death during hospitalization, regardless of the length of hospital stay. Such cases were identified based on the type of discharge from hospital defined in the NHF database as “death”. Deaths following discharge from a hospital were not analyzed. A crude mortality rate (CMR) was calculated using the following following formula: CMR = number of hospitalizations andede by death in a given year/all hospitalizations in a given year.
Patients were divided into nine age groups (18–24, 25–34, 35–44, 45–54, 55–64, 65–74, 75–84, 85–94 and ≥ 95 years old) or, for other analyses, into two groups – a younger group (18–64 years old) and an elderly group (≥ 65 years old). The mortality rates were calculated for each calendar year. The odds ratios (OR) with 95% confidence intervals (CI) for mortality rates were calculated for all the age groups in relation to the 18–24 age group. Additionally, ORs were calculated for the 65–74, 75–84, 85–94 and ≥ 95 age groups for those diagnosis-related groups in which mortality was the highest.
Statistical analysis
Differences in mortality rates between age groups were tested for significance using Pearson’s χ2 test, Fisher’s exact test and the test of proportions. The analysis of odds ratios (OR) is described above; all odds ratios shown are calculated as mean ORs for the years 2009–2013.
All tests were verified at three levels of significance: *0.01, **0.001, ***0.0001 [22].
Results
The analysis covers hospitalizations in the years 2009–2013. For each year, approximately 3 million non-surgical hospitalizations fulfilled the inclusion criteria. In total, over 15.3 million hospitalizations were analyzed. With the exception of the ≥ 95 age group, which comprised about 8000 hospitalizations, several hundred thousand hospitalizations were analyzed for every age group. The mean in-hospital non-surgery-related mortality was 3.96 ±0.17% and increased from 3.79% in 2009 to 4.2% in 2013. The distribution of the number of hospitalizations and number of deaths in particular age groups is shown in Table I.
Table I
Frequency of non-surgery-related in-hospital deaths in the years 2009–2013 according to age
| Age group [years] | 2009 | 2010 | 2011 | 2012 | 2013 | |||||
|---|---|---|---|---|---|---|---|---|---|---|
| Deaths (mortality rate) | Hospitalizations | Deaths (mortality rate) | Hospitalizations | Deaths (mortality rate) | Hospitalizations | Deaths (mortality rate) | Hospitalizations | Deaths (mortality rate) | Number of Hospitalizations | |
| 18–24 | 246 (0.11%) | 215 781 | 220 (0.11%) | 195 229 | 222 (0.12%) | 187 945 | 229 (0.13%) | 178 999 | 187 (0.11%) | 169 294 |
| 25–34 | 755 (0.21%***) | 368 188 | 709 (0.2%***) | 348 298 | 728 (0.21%***) | 343 108 | 729 (0.22%***) | 335 330 | 687 (0.21%***) | 328 541 |
| 35–44 | 1 927 (0.77%***) | 249 630 | 1 841 (0.77%***) | 239 238 | 1 921 (0.8%***) | 240 272 | 1 930 (0.81%***) | 238 729 | 1 794 (0.76%***) | 235 411 |
| 45–54 | 7 604 (1.76%***) | 432 650 | 6 941 (1.77%***) | 391 608 | 6 546 (1.77%***) | 369 790 | 6 450 (1.89%***) | 342 014 | 5 537 (1.79%***) | 309 560 |
| 55–64 | 16 912 (2.79%***) | 606 479 | 16 852 (2.76%***) | 610 232 | 1 7488 (2.79%***) | 626 694 | 17 835 (2.91%***) | 612 258 | 17 560 (2.98%***) | 588 666 |
| 65–74 | 24 158 (4.12%***) | 585 908 | 22 756 (4.16%***) | 547 050 | 22 210 (4.06%***) | 546 386 | 22 555 (4.22%***) | 534 313 | 22 829 (4.3%***) | 531 124 |
| 75–84 | 44 826 (7.54%***) | 594 632 | 42 780 (7.42%***) | 576 582 | 42 361 (7.19%***) | 588 790 | 42 379 (7.31%***) | 579 891 | 42 404 (7.48%***) | 566 863 |
| 85–94 | 23 017 (14.98%***) | 153 650 | 24 265 (14.98%***) | 162 010 | 25 963 (14.49%***) | 179 167 | 28 284 (14.84%***) | 190 597 | 30 376 (15.05%***) | 201 781 |
| 95+ | 2 279 (26.36%***) | 8 646 | 2 315 (26.78%***) | 8 644 | 2 260 (26.58%***) | 8 503 | 2 250 (26.38%***) | 8 530 | 2 178 (27.18%***) | 8 014 |
| Total | 121 724 (3.79%) | 3 215 564 | 118 679 (3.85%) | 3 078 891 | 119 699 (3.87%) | 3 090 655 | 122 641 (4.06%) | 3 020 661 | 123 552 (4.20%) | 2 939 254 |
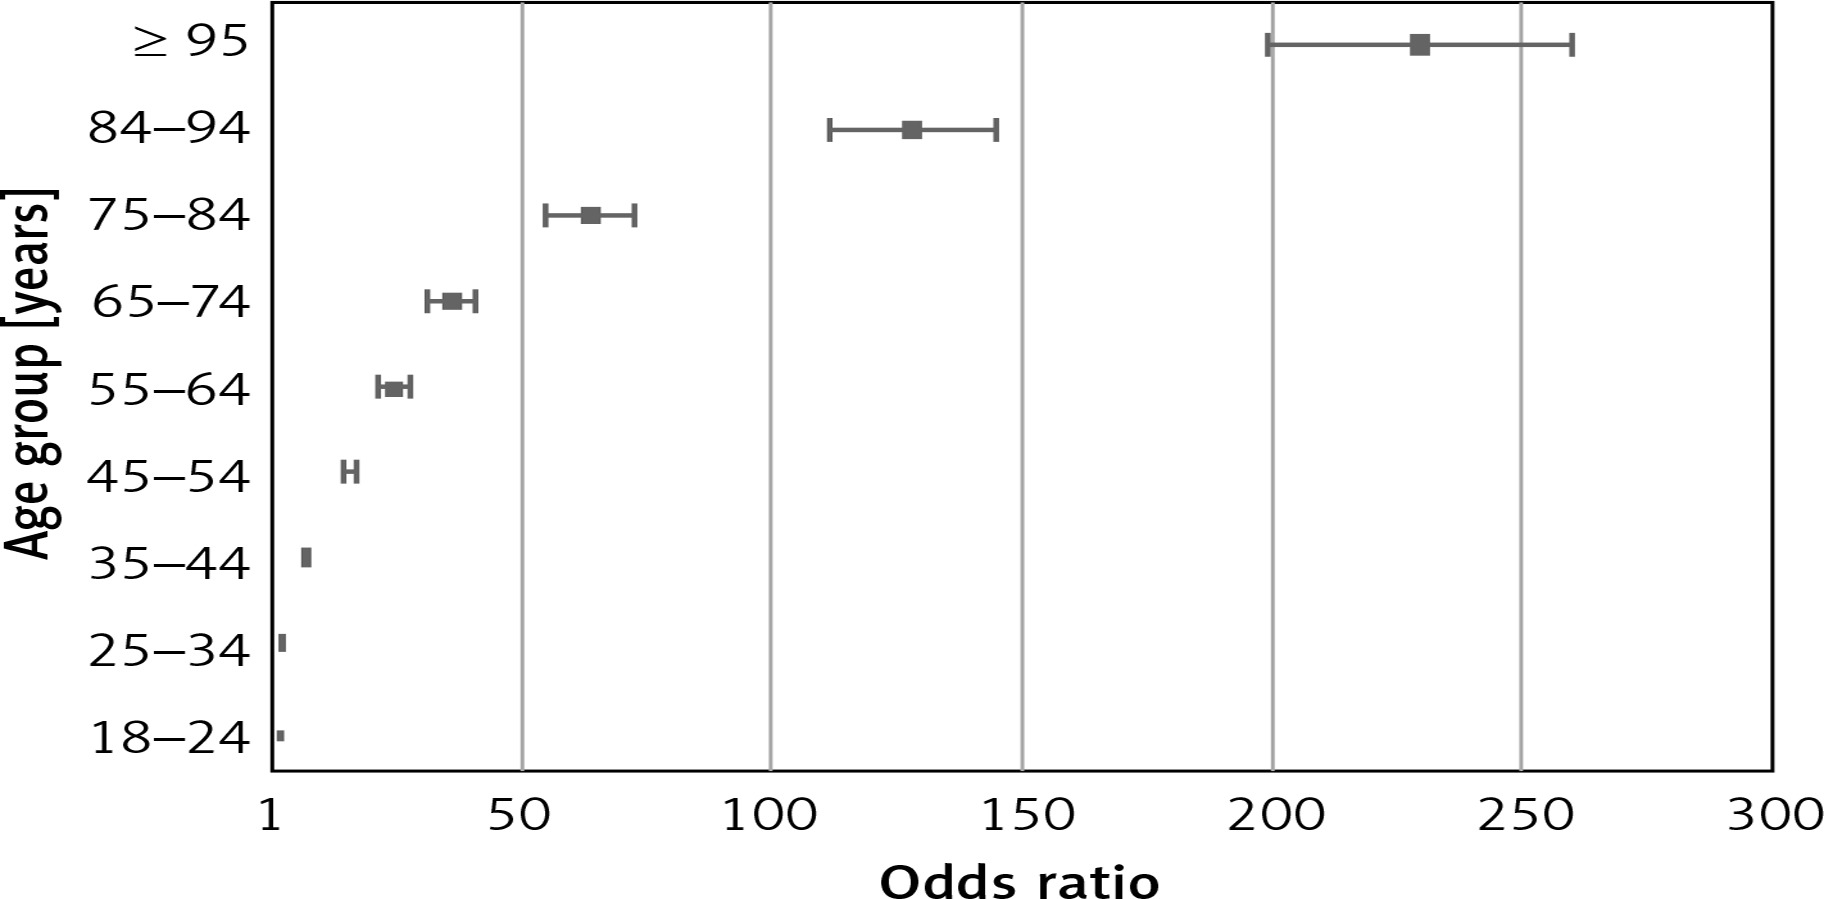
Interestingly, in the examined population the highest absolute number of hospitalizations occurred in patients aged 55–64 years (Table I). However, having in mind that it was the elderly patients (aged ≥ 65 years) whose hospitalizations were more frequent and usually carry a higher risk of various complications, we compared mortality rates in the younger (18–64 years) and elderly (≥ 65 years) age groups. The mean mortality rate for the 5-year observation period was 1.53 ±0.06% in the younger patients and 7.18 ±0.2% in the elderly group, amounting to a 4.7-fold difference (Table II). A detailed analysis showed that the mean mortality rates systematically increased with age, from 0.12 ±0.01% in the 18–24 age group to 4.17 ±0.08%, 7.39 ±0.12%, 14.87 ±0.20% and 26.65 ±0.30% in the 65–74, 75–84, 85–94 and ≥ 95 age groups, respectively. The mean odds ratio for in-hospital death also increased with age, reaching as high as 229 ±15.06 in the ≥ 95 years age group when compared to the youngest study subjects (Figure 1).
Table II
Frequency of non-surgery-related in-hospital deaths in the years 2009–2013 in younger and elderly patients
| Age group [years] | 2009 | 2010 | 2011 | 2012 | 2013 | |||||
|---|---|---|---|---|---|---|---|---|---|---|
| Deaths (mortality rate) | Hospitalizations | Deaths (mortality rate) | Hospitalizations | Deaths (mortality rate) | Hospitalizations | Deaths (mortality rate) | Hospitalizations | Deaths (mortality rate) | Hospitalizations | |
| 18–64 | 27 444 (1.47%) | 1 872 728 | 26 563 (1.49%) | 1 784 605 | 26 905 (1.52%) | 1 767 809 | 27 173 (1.59%) | 1 707 330 | 25 765 (1.58%) | 1 631 472 |
| ≥ 65 | 94 280 (7.02%***) | 1 342 836 | 92 116 (7.12%***) | 1 294 286 | 92 794 (7.01%***) | 1 322 846 | 95 468 (7.27%***) | 1 313 331 | 97 787 (7.48%***) | 1 307 782 |
Figure 1
Odds ratio of non-surgical in-hospital mortality rates in age groups in relation to the 18–24 age group (OD 1)
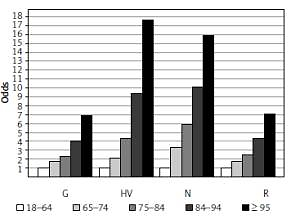
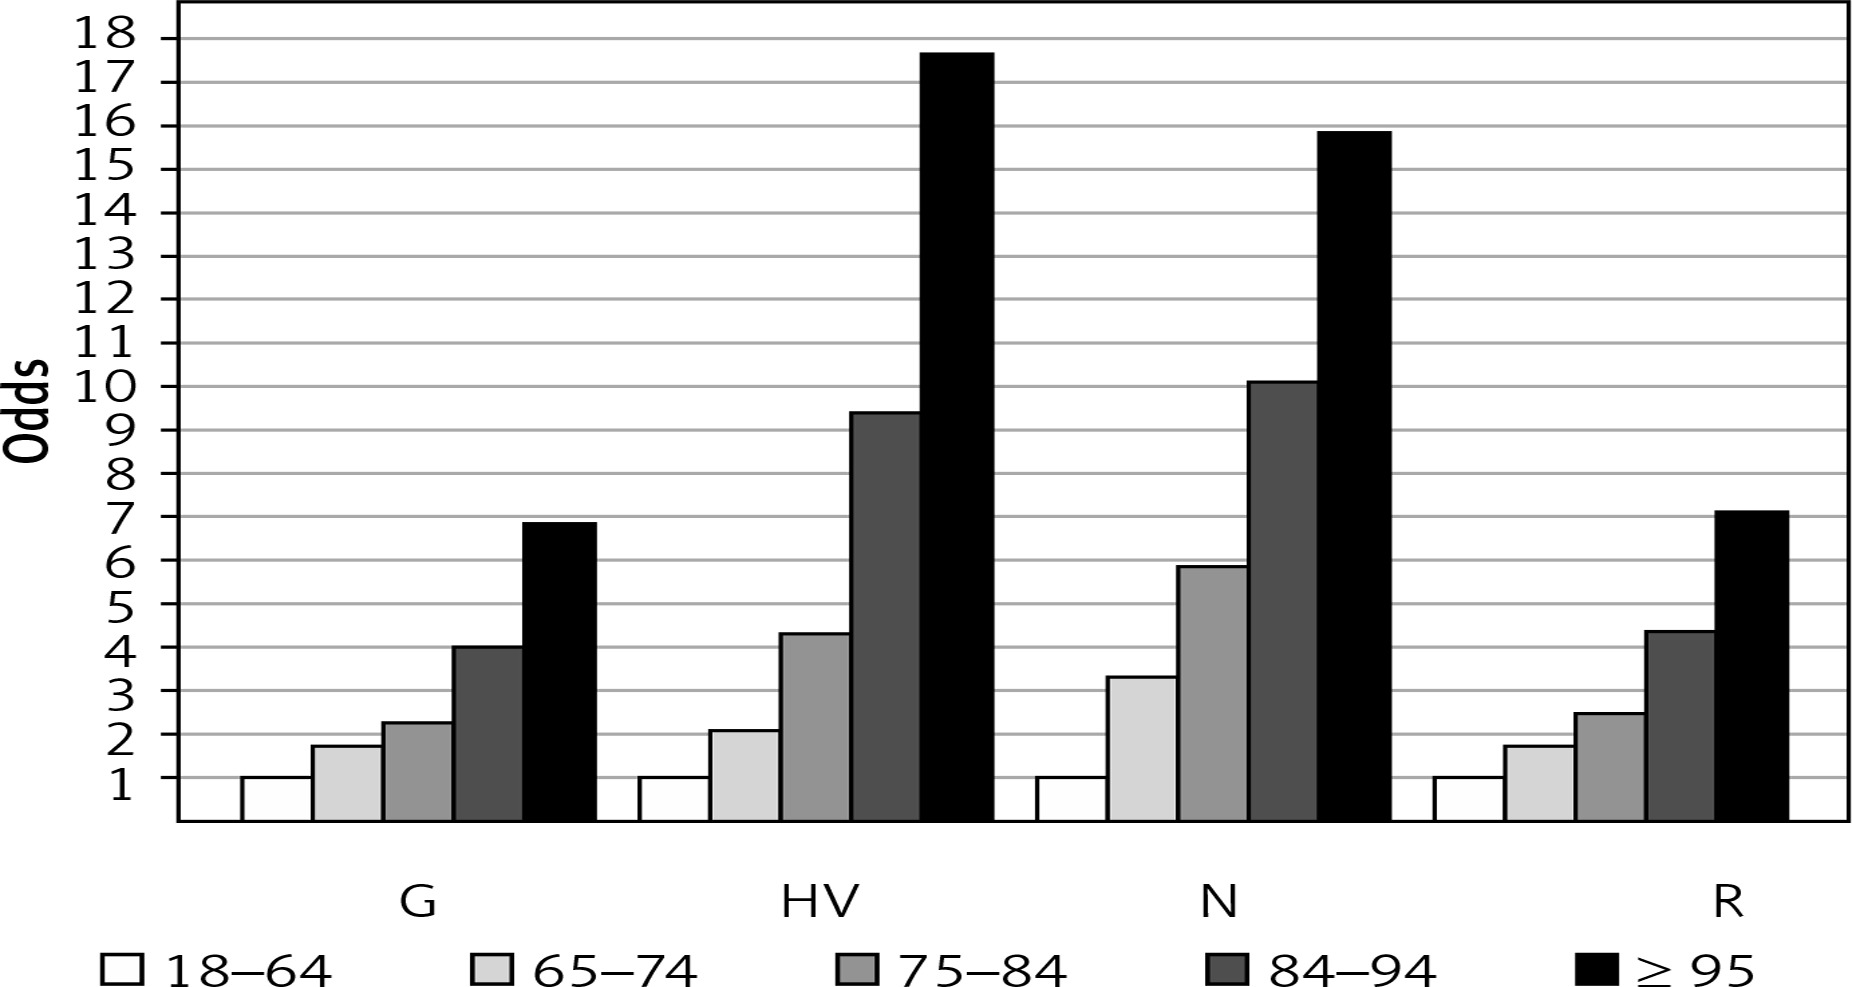
The highest mean mortality rate was observed in patients with respiratory diseases (6.91 ±0.20% of all deaths). The next three groups of diseases with the highest mortality rates were: heart and vascular diseases (5.65 ±0.27%), nervous system diseases (5.46 ±0.05%), and combined gastrointestinal tract, liver, biliary tract, pancreas and spleen diseases (4.01 ±0.13%). The lowest mean mortality rate was observed for head and neck (0.35 ±0.01%), and bone and muscles diseases (0.56 ±0.03%). In the elderly patients with respiratory diseases, the mean mortality rate was 2.4-fold higher than in the younger group (9.54 ±0.25% vs. 3.96 ±0.07%). The mortality rates for the elderly were 4.4-fold higher than those of the younger patients with heart and vascular diseases (7.84 ±0.27% vs. 1.79 ±0.08%), 5.6-fold higher (10.22 ±0.35% vs. 1.83 ±0.03%) in patients with nervous system diseases, and 2.3-fold higher in patients with combined gastrointestinal tract, liver, biliary tract, pancreas and spleen diseases (6.09 ±0.19% vs. 2.70 ±0.05%). Detailed analysis regarding the 65–74, 75–84, 85–94 and ≥ 95 age groups of patients in groups of diseases where mortality rates were the highest (Figure 2) showed that the difference between the elderly and younger subjects in mortality rates due to head and neck, as well as bone and muscles diseases, where overall mortality was the lowest, was 2.29-fold (0.27 ±0.02% vs. 0.62 ±0.08%) and 6.57-fold (0.19 ±0.02% vs. 1.26 ±0.08%), respectively.
Figure 2
Mean (2009–2013) odds ratios of mortality for 65–74, 75–84, 85–94 and ≥ 95 years age groups of the elderly (with respect to mortality for 18–64 years age group) in diagnosis-related groups of diseases where mortality was the highest. G – gastrointestinal tract, liver, biliary tract, pancreas and spleen diseases, HV – heart and vascular diseases, N – nervous system diseases, R – respiratory diseases
Discussion
In this paper we present an analysis of in-hospital non-surgical mortality based on data from a database including almost all hospitalizations that occurred between the years 2009 and 2013 in Poland. Since private insurance plans covering costs of non-surgical hospitalizations are uncommon in this country, only a small number of such hospitalizations may have been possibly omitted.
Although in some previously published papers their authors did exclude surgery-related events from the assessment of mortality risk, to the best of our knowledge, this is the first analysis of a large national database that assessed general in-hospital non-surgery-related mortality (not associated with any specific disease or medical specialty). Thus, we are able to compare our results only with data regarding total (surgical together with non-surgical) mortality assessed in other countries. An analysis of patients hospitalized in Massachusetts hospitals between 2005 and 2008 (the data set included records for 2,529,268 patients discharged from all 81 Massachusetts hospitals) showed a case fatality rate of 3.96% [7], whereas the National Hospital Discharge Survey showed the mortality rate in the US in the year 2010 to be twice as low, only 2.03% [10]. The 4-year crude death rates in England, where 7,653,527 hospital admissions were analyzed, varied across hospitals from 3.4% to 13.6% (the average for England being 8.5%) [8]. Interestingly, in another publication where deaths in hospital and within 30 days of dischare were analyzed, the mean mortality was only 4.2% for males and 4.5% for females [12]. In the Netherlands, out of 2,363,332 hospital admissions in the years 2005–2007, 3.85% ended with death [9]. In an analysis of hospital data from Chile for the period 2001–2010 covering 16,205,314 discharges, death was reported in 3.5% of cases [6]. In our previous study we assessed in-hospital mortality in patients undergoing surgical treatment on the basis of a 4-year observation of the same general population as in the current study and found that the mean surgery-related in-hospital yearly mortality was approximately 1% [23], thus four times lower than the one for non-surgery-related deaths reported here. After adding the number of surgery-related (from our previous publication) and non-surgical hospitalizations and deaths for the years 2009–2012, it can be stated that the total (surgical and non-surgical) mean in-hospital mortality rate in these years was about 2.6%. This figure is lower than in Massachusetts, England, the Netherlands and Chile [6–9, 12], but higher than the figure from the National Hospital Discharge Register [10].
Elderly age is associated with various health problems and increased risk of death. In our study, the mean non-surgery-related mortality rate in the elderly (≥ 65 years of age) hospitalized patients was 7.18% (4.7-fold higher than in the younger group; see Table II). We were not able to compare our results with another study evaluating non-surgery-related mortality in such a large elderly population due to the lack of published data regarding similarly designed studies. Most of the available data regarding this issue come from studies carried out in much smaller groups, in specialized hospital wards and departments. In Brazil, the mortality rate among 856 patients aged 60 to 104 years admitted to the geriatric care unit was 16.4% [15]. In the retrospective analysis of 1012 patients aged ≥ 65 years hospitalized at the Internal Medicine Clinic in Turkey, the rate of in-hospital mortality was 8.4%; however, in this study patients with malignancy were excluded, which significantly affected the obtained results [19]. In other studies, the rate of in-hospital mortality among elderly patients hospitalized in internal medicine (158 patients) [16] or geriatric (987 patients) wards [17] was reported to be 12–14.9%. In comparison to these limited data, the mortality rate of elderly patients in our study was lower. This difference probably results from the fact that hospitalizations of the elderly in internal medicine or geriatric departments usually involve individuals with numerous comorbidities and, therefore, a higher risk of death. In contrast, our analysis also included hospitalizations in wards treating diseases that carry a low risk of death. On the other hand, in a large US study including all hospitalizations countrywide, 83% of all deaths in 2010 [10] occurred in patients aged 65 years and over, a figure similar to the 77.6% of deaths in our population in the same year.
We found that the highest mortality rate occurred in hospitalizations due to respiratory diseases, heart and vascular diseases, nervous system diseases, as well as combined gastrointestinal tract, liver, biliary tract, pancreas and spleen diseases. According to WHO data, the leading causes of death in the years 2000–2012 were ischemic heart disease, stroke, lower respiratory infections and chronic obstructive lung disease [24]. In turn, Eurostat statistics show that diseases of the circulatory system, cancer, respiratory diseases and diseases of the nervous system were the leading causes of death in the European Union in 2012 [25, 26]; therefore, our results seem to be consistent with these data.
We observed the highest mortality rate due to respiratory diseases regardless of the age of patients. A similar figure was reported for the US, where 33.4% of deaths in the year 2010 were due to respiratory failure, pneumonitis caused by solids and liquids and other types of pneumonia [10]. In that report however, the age of patients was not mentioned. Similarly, the major causes of death for people aged ≥ 65 years in the European Union are heart diseases, cerebrovascular diseases (including stroke) and respiratory diseases, with data presented in this paper seeming again to be consistent with these data.
In summary, this is the first study comparing the general and DRG-category related, in-hospital non-surgical mortality rates in particular age groups (including oldest-old patients), using a large database including more than 15,000,000 hospitalizations, calculating overall in-hospital non-surgical mortality in various age groups and defining the diagnosis-related groups in which there occurs the highest and the lowest risk of death. The strength of this study relies on a very high number of analyzed hospitalizations making the results more reliable than in smaller studies, and on the fact that it is one of the few studies that assess mortality according to DRG categories. On the other hand, the study has some limitations. First, we used a crude mortality rate. The main disadvantage of this method is that it does not take into account factors such as gender, race, comorbidities, socio-economic status, type of admission, and other variables that might affect mortality. The reason for this is that the NHF database does not contain some of these data. In addition, stratifying such a large population according to age and diagnosis-related group categories alone already generated many potential interpretation problems which could be aggravated with further stratification. Therefore, assessment of the influence of the factors mentioned above on mortality requires further studies. The second potential limitation is the use of the “in-hospital mortality” concept defined as death only during hospitalization, regardless of its length. Again, the NHF database does not contain information about deaths after discharge from the hospital. In addition, there is no consensus about the time after discharge during which death could be still related to the preceding hospital stay, and published data describe periods ranging from 30 days after the start of hospitalization up to 1 year after discharge. Therefore, since death during hospitalization is a parameter which is always recorded in hospital statistics, we consider our approach to analyze mortality data to be reliable and generating data that can be easily compared to other studies.
In conclusion, the in-hospital non-surgery-related mortality rate in the studied population was almost 4%, and increased with age of the patient, so that the relative risk of death was 229-fold higher in ≥ 95-year-old patients than in 18–24-year-old patients. Some DRG categories (respiratory diseases, heart and vascular diseases, nervous system diseases and gastrointestinal tract, liver, biliary tract, pancreas and spleen diseases) were characterized by a high mortality rate, while for others (head and neck, as well as bone and muscle diseases) we noted a low mortality rate. The results may be helpful in calculating standardized mortality rates for particular age groups and DRG categories, allowing comparison and assessment of mortality in different health care units.