Introduction
Chronic obstructive pulmonary disease (COPD) is the third leading cause of death worldwide. It is characterized by persistent airflow limitations, typically associated with symptoms such as chronic cough, sputum production, and shortness of breath during exertion [1, 2]. These symptoms are underpinned by chronic inflammation involving increased production of pro-inflammatory mediators by immune cells, primarily tumor necrosis factor-α (TNF-α), interleukin-6 (IL-6), and interleukin-8 (IL-8) [3]. The pathogenesis and progression of COPD have been reported to be associated with the effect of growth differentiation factor 15 (GDF-15) on airway epithelial cells. GDF-15, a member of the transforming growth factor-β (TGF-β) superfamily, is expressed in response to cellular stress and pathological conditions and is considered a key component of the senescence-associated secretory phenotype protein repertoire [4]. It has been demonstrated that cigarette smoke exposure increases GDF-15 expression in airway epithelial cells and induces cellular senescence through activation of the ALK1/Smad1 pathway, with significant increases in both early senescence marker p21 and late senescence marker p16 [5]. Elevated GDF-15 levels are closely associated with COPD progression and infectious exacerbations [6, 7]. Husebø et al. [8] in a 9-year study involving 413 COPD patients observed that high GDF-15 levels were associated with a higher rate of exacerbations, increased mortality, and a greater decline in both forced expiratory volume in 1 s (FEV1) and forced vital capacity (FVC). A recent study showed that higher baseline GDF-15 concentrations were associated with cardiovascular events in COPD patients during 5-year follow-up [9].
To reduce mortality in COPD patients, various strategies are employed, primarily aimed at limiting exposure to causative factors such as cigarette smoking and environmental pollutants, as well as implementing pulmonary rehabilitation, oxygen therapy, noninvasive ventilation, and surgery [1, 2]. Since inflammation underlies COPD, one therapeutic strategy involves searching for pharmacological agents that reduce its extent. One such group of drugs with pleiotropic and anti-inflammatory effects is 3-hydroxy-3-methylglutaryl-coenzyme A (HMG-CoA) reductase inhibitors, known as statins [10, 11]. Statins, which are potent cholesterol-lowering agents, highly effective in the prevention of cardiovascular diseases [12], have been shown to improve lung function in COPD patients [13]. Statins may also prolong exercise tolerance as a measure of health status [14], reduce COPD exacerbations [15, 16], and decrease COPD-specific mortality [17].
It has been reported that statin use may affect GDF-15 levels [18, 19], though evidence is inconclusive. It has been suggested that statins may indirectly lower GDF-15 by reducing local inflammation [18]. In patients with acute coronary syndrome undergoing percutaneous coronary intervention (PCI), increased plasma concentrations of GDF-15 at the time of PCI and stent implantation identified high-risk patients who may benefit from high-dose, highly efficient statin therapy [18]. In 3,501 patients following acute coronary syndrome, higher GDF-15 levels were associated with the risk of death or myocardial infarction, but no interaction was found between GDF-15 and intensive statin therapy [19]. In type 2 diabetes patients, GDF-15 levels remained unchanged after 8 weeks of atorvastatin at both 10 mg/day and 40 mg/day [20]. To our knowledge, the impact of statin use on GDF-15 levels in COPD patients has not been investigated. The current analysis was conducted to assess the effect of statins on GDF-15 levels in COPD and determine factors affecting this biomarker.
Material and methods
Patients
We assessed 54 patients with stationary stages of COPD who were recruited at the University Hospital in Krakow, Poland. COPD was diagnosed in line with the Global Initiative for Chronic Obstructive Lung Disease (GOLD), based on the modified Tiffeneau-Pinelli index reduced under 0.7, observed in spirometry after inhalation of a bronchodilator [21]. The study group has been described in detail previously [22, 23]. The exclusion criteria were: major or acute illness, including state of inflammation defined as increased CRP (> 25 mg/l) and recent (within the preceding 3 months) venous thromboembolism (VTE) or an acute coronary event, current hypolipidemic or anticoagulant therapy, congestive heart failure, decreased left ventricular ejection fraction (< 40%), cancer, and hepatic or renal failure (creatinine > 177 µmol/l). Current smokers were defined as patients smoking at least 1 cigarette per day.
Initial study protocol
Patients were randomly assigned (1 : 1) in an open-label manner, using a computer-based random number generator, to receive simvastatin 40 mg/day (Zocor, Merck Sharp and Dohme, Merck & Co., Inc., Rahway, NJ, USA) (n = 28) or to remain without statins for 3 months (n = 28), as described previously [19, 20]. Simvastatin was preferable due to the strongest clinical evidence, the status of a reference therapy in guidelines, good availability, and a favorable cost-effectiveness profile. The study protocol adherence was tested at each follow-up visit based on the number of used tablets. No significant differences in age, sex, or comorbidities were found between the two groups.
Patients attended three visits: at baseline and then at 1 month and 3 months. The visits included physical examination, spirometry and blood sampling for laboratory tests. Lifestyle and diet guidance was provided, and prior pharmacotherapy was not modified. The statin treatment was planned to be discontinued if intolerance occurred, defined as elevated alanine aminotransferase (ALT) three times and/or a creatine kinase (CK) level elevated more than five times the upper limit of the reference value.
Spirometry was carried out in line with American Thoracic Society (ATS) standards, and the results – FEV1 and FEV1 to FVC ratio after inhalation of bronchodilator – were presented as percentages of the predicted value for individual patients.
Laboratory investigations
Blood samples were collected from an antecubital vein with minimal stasis between 8 and 10 A.M. at baseline and at each follow-up visits and then stored at –80°C until analysis. The patients were advised to fast and abstain from smoking for at least 2 h prior to the test.
Lipid profile was assessed by routine laboratory methods. CRP was assayed by latex nephelometry (Dade Behring, Marburg, Germany). Fibrinogen was assessed according to the von Clauss method. Serum GDF-15 levels were assessed in a post-hoc analysis using enzyme-linked immunosorbent assay (ELISA; R&D Systems Inc., Minneapolis, USA) with the minimum detectable dose < 4.4 pg/ml, intra-assay variability < 4% and inter-assay variability < 7%. IL-6, TNF-α, and matrix metalloproteinase 9 (MMP-9) were also assayed using ELISAs (all R&D Systems Inc.). Plasminogen activator inhibitor type 1 (PAI-1) antigen (American Diagnostica, Greenwich, CT, USA) was also determined by ELISA. Analysis of samples was performed by technicians blinded to their source.
Statistical analysis
Variables are presented as numbers and percentages or median and interquartile range (IQR), as appropriate. Normality was assessed using the Shapiro-Wilk test. Differences between groups were compared using the Mann-Whitney U-test (due to the small number of observations). Categorical variables were compared using Pearson’s χ2 test. To determine the predictors of high levels of GDF-15, the logistic regression model was applied. The Hosmer-Lemeshow test was used to assess the goodness of fit of the resulting regression model. Pearson’s correlation or Spearman’s rank correlation coefficient was calculated to evaluate the relationships between numerical variables. The three measurements of GDF-15 were compared over time with repeated measures ANOVA. Post-hoc analyses were also performed. To minimize the potential confounding impact of age on GDF-15, linear regression models were employed, adjusting for additional covariates included as fixed effects in the model. The post-hoc study power was calculated for a paired-samples t-test using the observed mean difference, the standard deviation of the paired differences, the sample size, and a two-sided significance level of α = 0.01, yielding a power of 0.82. A P-value < 0.05 was considered statistically significant. All statistical analyses were performed using R [24] v. 4.1.0 and Statistica 13.3 software (StatSoft Inc., Tulsa, Oklahoma, United States).
Results
Baseline
Fifty-four enrolled patients (49 [90.7%] men) aged 64.5 (56.3–73.0) years were assessed (Table I). There were 25 (46.3%) patients with healthy weight (BMI 18.5 to less than 25 kg/m2), 22 (40.7%) overweight patients (BMI between 25 and 29.9 kg/m2), and 7 (13.0%) patients with obesity. Twenty (37%) patients were active smokers. Patients randomly assigned to the statin group vs. non-statin group had similar baseline characteristics, except for higher incidence of hypertension in the former group (Table I).
Table I
Baseline characteristics of COPD patients randomly assigned to statin treatment
[i] Data are presented as number (percentage) or median [interquartile range]. ASA – acetylsalicylic acid, BMI – body mass index, CRP – C-reactive protein, FEV1 – forced expiratory volume in 1 s, FVC – forced vital capacity, HDL – high-density lipoprotein, LDL – low-density lipoprotein, PAI-1 – plasminogen activator inhibitor type 1, TNF-α – tumor necrosis factor α, IL-6 – interleukin-6, MMP-9 – metalloproteinase-9.
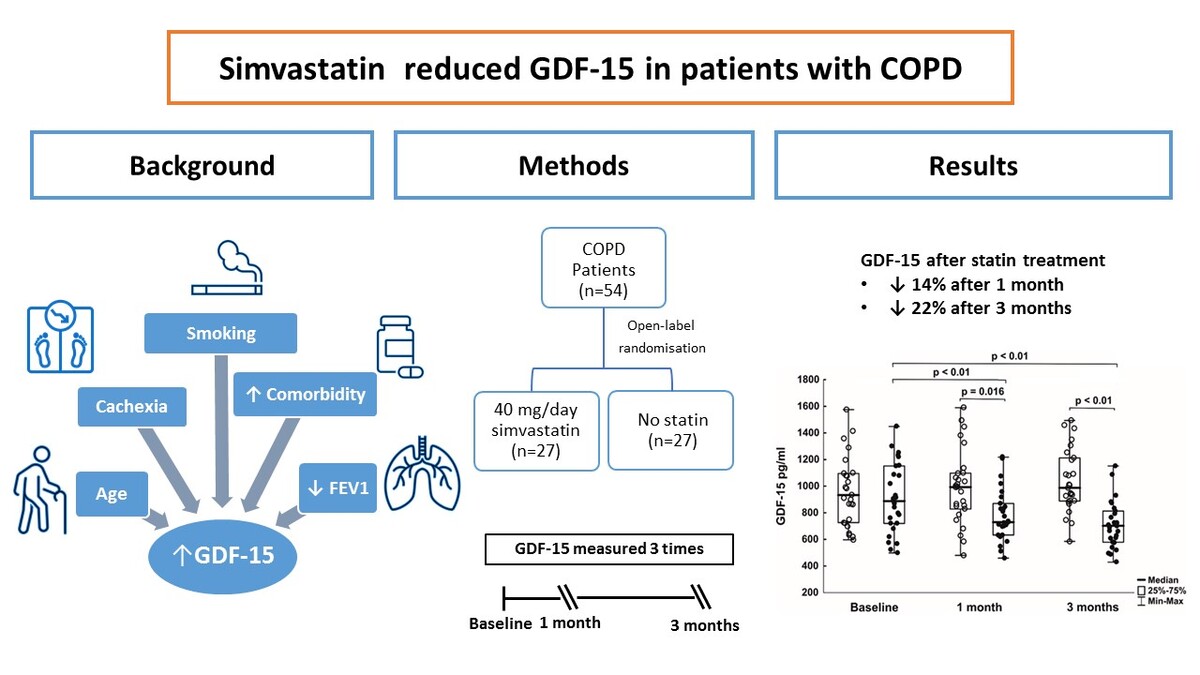
At baseline, median serum GDF-15 was 907.5 pg/ml (interquartile range, 720–1095 pg/ml; Figure 1). COPD patients with GDF15 ≥ 907.5 pg/ml were older by 9 years (Table II).
Figure 1
Baseline and follow-up levels of growth differentiation factor-15 (GDF-15) in COPD patients receiving statin (black dots) or not (white dots)
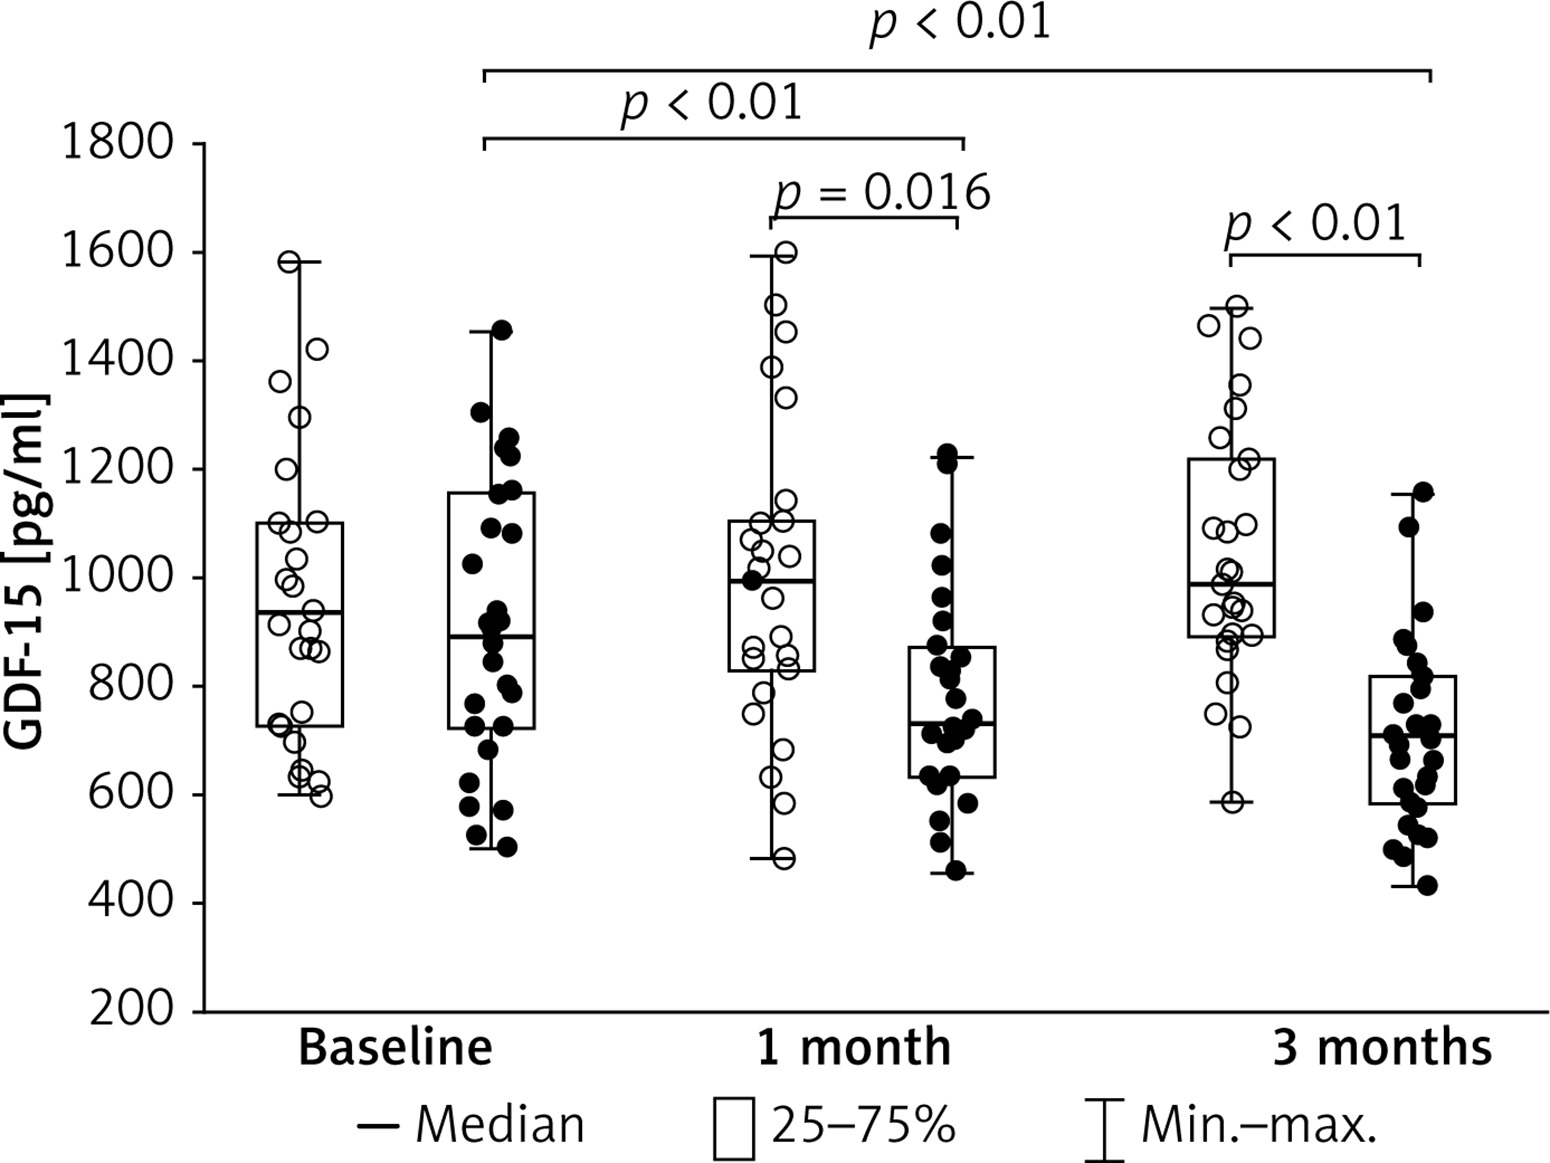
Table II
Baseline characteristics of COPD patients stratified according to GDF-15 concentrations
[i] Data are presented as number (percentage) or median [interquartile range]. ASA – acetylsalicylic acid, BMI – body mass index, CRP – C-reactive protein, FEV1 – forced expiratory volume in 1 s, FVC – forced vital capacity, HDL – high-density lipoprotein, LDL – low-density lipoprotein, PAI-1 – plasminogen activator inhibitor type 1, TNF-α – tumor necrosis factor α, IL-6 – interleukin-6, MMP-9 – metalloproteinase-9.
The effect of simvastatin on GDF-15
All patients declared adherence to the treatment protocol. No adverse statin events were observed. No significant differences in regard to age, sex, or comorbidities were found between the two groups. Compared to baseline, statins reduced total cholesterol and LDL-C after 1 month (–28% and –38%, respectively) and after 3 months (–21.4% and –30.3%, respectively).
We found 14% and 22% lower levels of GDF-15 after 1 month and after 3 months of statin use when compared to the controls (Figure 1). The differences remained significant after adjustment for age, both at 1 and 3 months (p = 0.0009 and p < 0.0001, respectively).
Correlations between GDF-15 levels and clinical or laboratory parameters
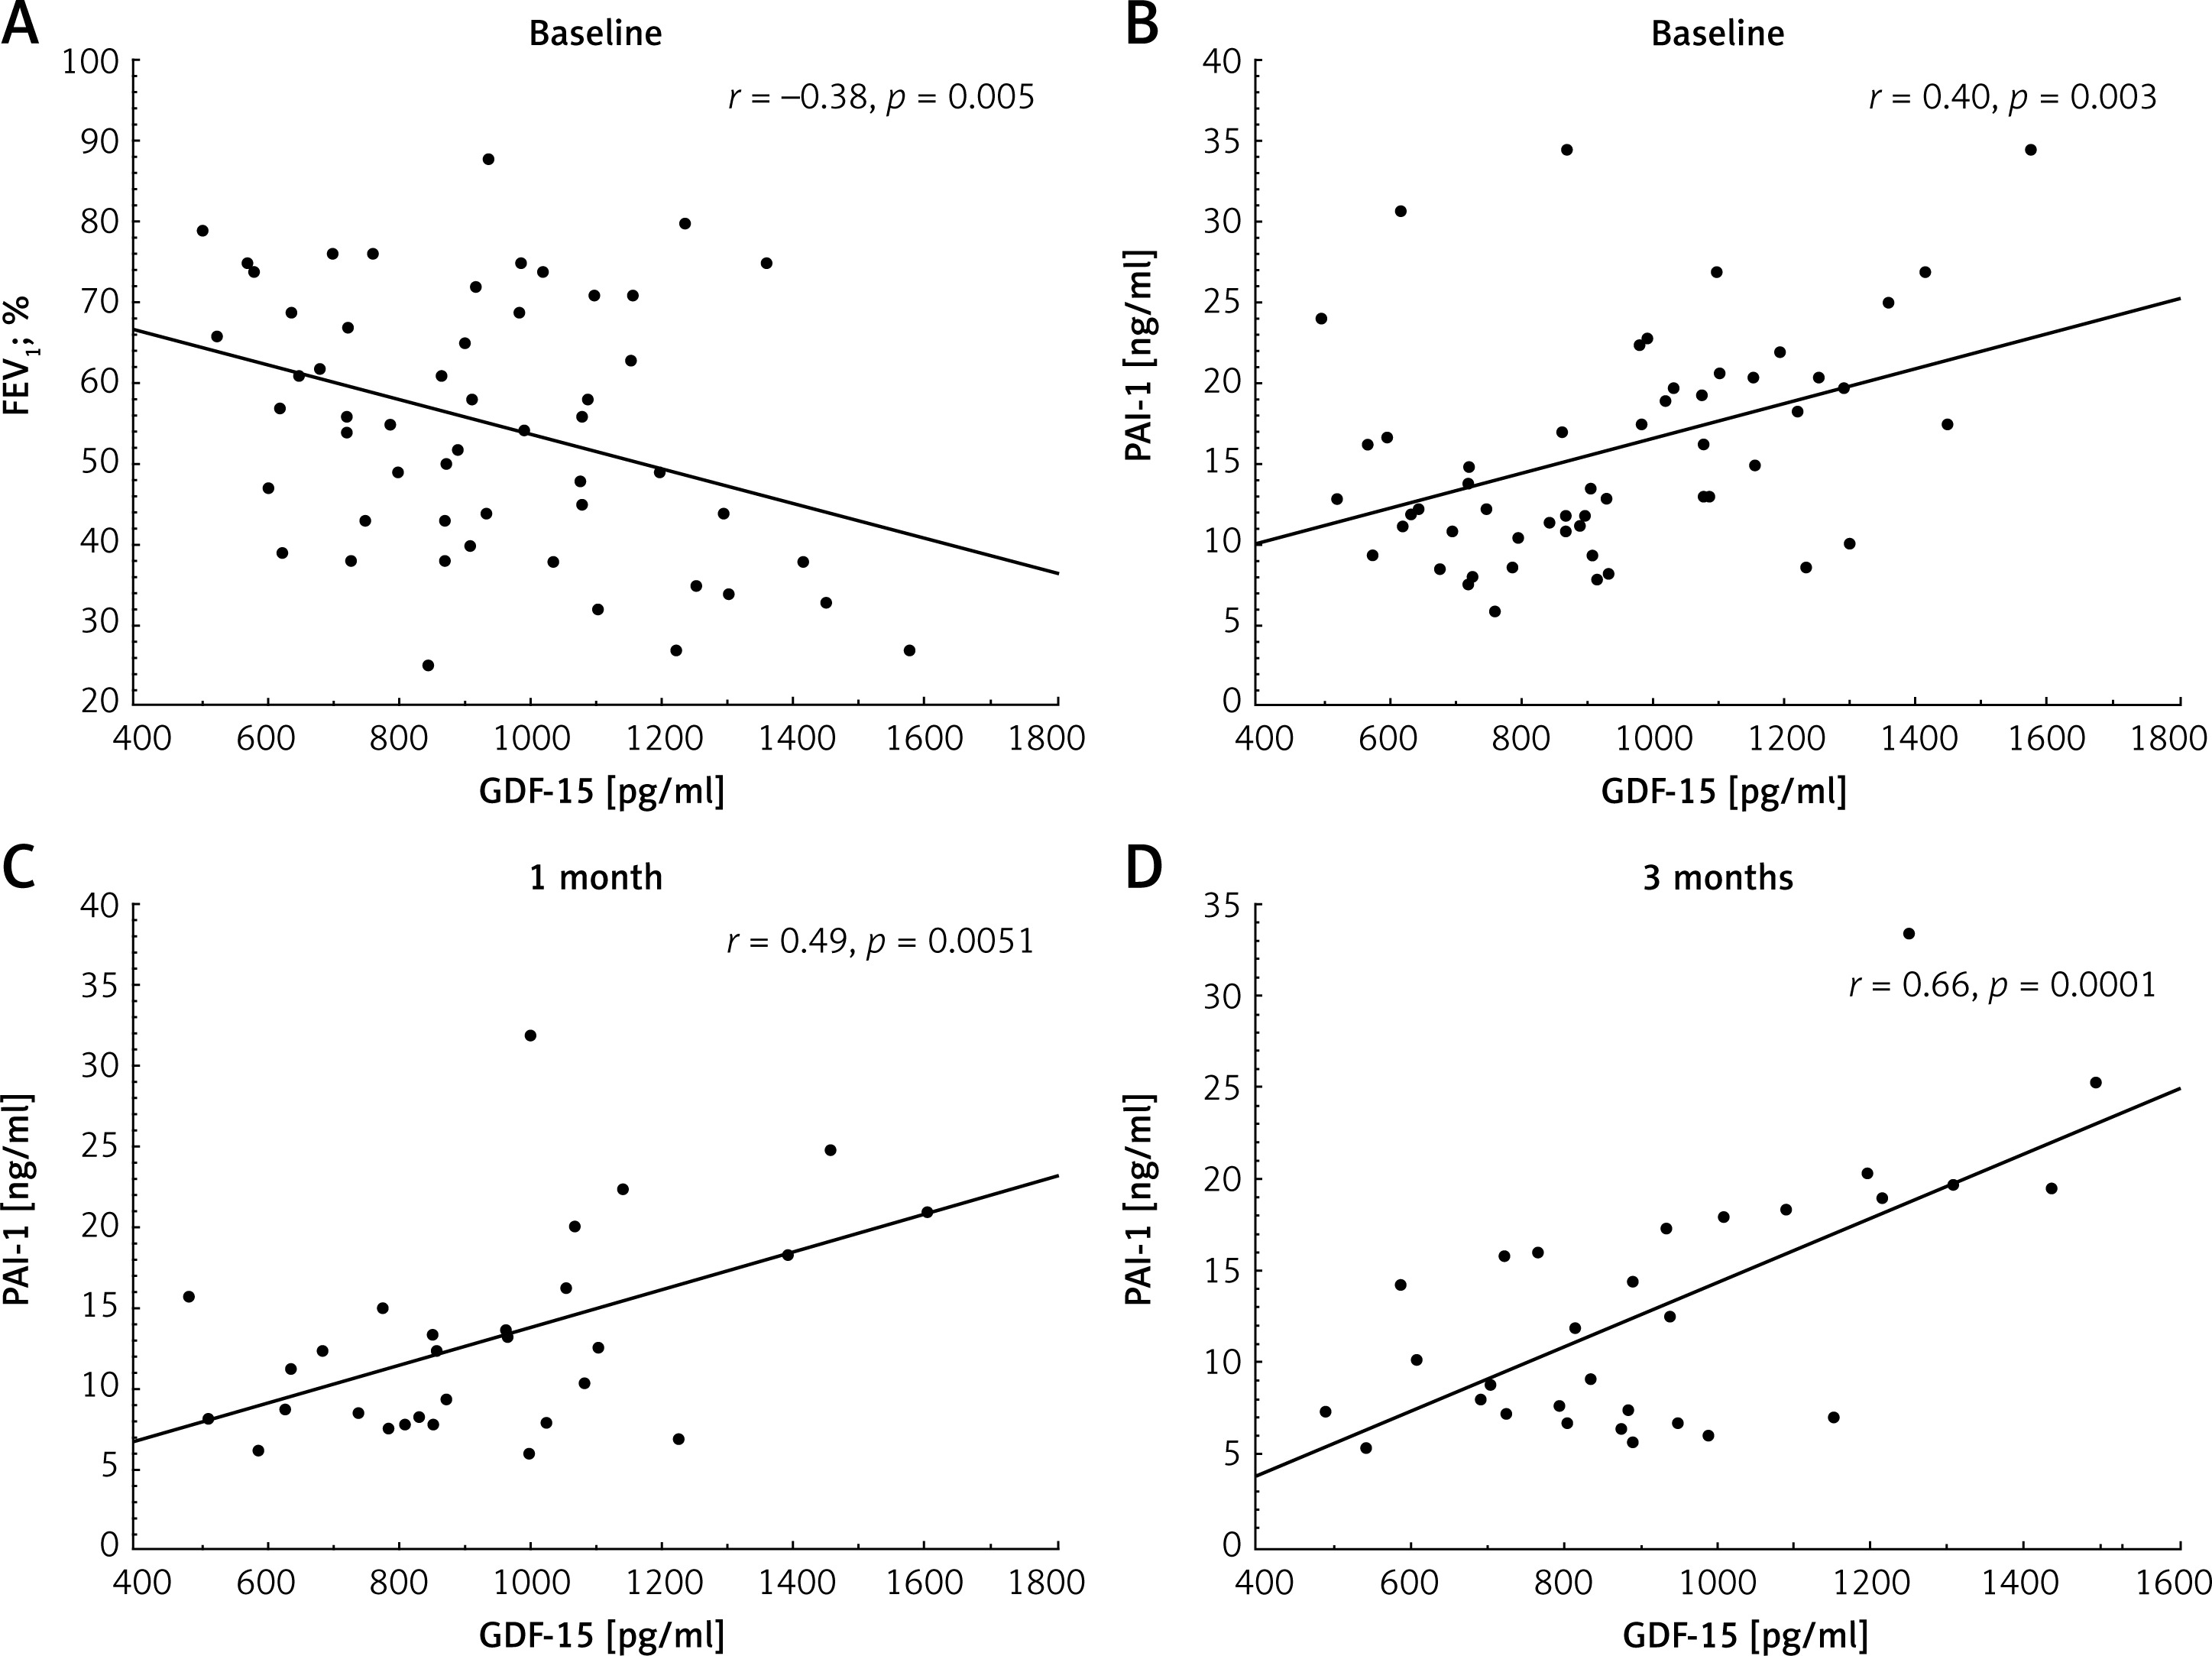
At baseline, serum GDF-15 correlated positively with age (r = 0.32, p = 0.017) and TNF-α (r = 0.31, p = 0.031), but not with sex, smoking, or comorbidities. GDF-15 was also negatively associated with FEV1 (Figure 2 A). GDF-15 did not correlate with LDL levels or other lipid parameters in either group at any time points (all p > 0.05), despite the significant hypolipidemic effect observed in the group of patients taking statins. Importantly, GDF-15 correlated positively with PAI-1 levels at all time points (Figures 2 B–D), but this association was not observed following statin therapy (Table III).
Table III
Associations between GDF-15 and laboratory or spirometry parameters
Figure 2
Associations of growth differentiation factor-15 (GDF-15) with 1-second forced expiratory volume (FEV1; A) and plasminogen activator inhibitor type 1 (PAI-1; B) in the whole study group at baseline and between GDF-15 and PAI-1 at 1 month (C) and 3 months (D) in patients without statin treatment
Determinants of high levels of GDF-15
Regression modelling showed that the key predictors of high levels of GDF-15 at baseline were age and PAI-1 (Table IV). For age, each year increased the likelihood of GDF-15 ≥ 907.5 pg/ml by 9%, while for PAI-1 each unit increased the likelihood by 13%. We also tested different models including FEV1 or TNF-α, but only age and PAI-1 remained significant.
Discussion
Our hypothesis-generating study demonstrated for the first time that statin therapy led to a significant reduction in GDF-15 levels during a 3-month follow-up, even after adjustment for age. However, we found that older age and higher PAI-1 concentrations remained independently associated with higher GDF-15 levels at baseline. A moderate association of GDF-15 with PAI-1 was abolished by statin therapy. GDF-15 reduction after statin therapy may likely reflect decreased cellular stress and local inflammation in COPD.
COPD is a progressive inflammatory lung disorder characterized by airflow limitation and structural remodeling of the airways. COPD is more prevalent in individuals over 50 years of age and is closely linked to accelerated lung aging [1]. Mechanisms underlying accelerated lung aging include enhanced oxidative stress induced by exposure to environmental pollutants, particularly cigarette smoke, chronic inflammation, and increased number of senescent cells in the respiratory tract [25]. GDF-15 has been identified as a key cell-autonomous regulator of cellular senescence [5]. Elevated circulating GDF-15 levels have been proposed as a useful biomarker in COPD. Compared to healthy control subjects, circulating GDF-15 concentrations were 2.1-fold higher in stable COPD patients [26]. GDF-15 has also been reported to correlate with disease severity, exacerbation frequency, prognosis, increased mortality, greater rates of exacerbations, and accelerated decline in lung function [8].
In our cohort, we observed an association between aging and increasing GDF-15 concentrations. In the current study, age emerged also as a key predictor of elevated GDF-15 levels. Our study population was representative of the typical COPD demographic, comprising predominantly of male patients over 50 years of age, the majority of whom were current or former smokers. Notably, we did not include individuals with cachexia or low BMI, which constitutes a limitation of our study. Previous research has demonstrated associations between elevated GDF-15 levels and features of cachexia [8]. In contrast, we observed no differences in GDF-15 levels among individuals with normal weight, overweight, or obesity. Unexpectedly, we found no association between smoking status and GDF-15 levels. While previous studies indicated a link between smoking and elevated GDF-15 concentrations, differences in study populations may explain the discrepancy [8]. It was also surprising that there was no correlation between cardiovascular risk factors, such as high LDL cholesterol levels, and GDF-15 concentration. We further validated earlier observations that linked GDF-15 levels to FEV1 values. Our analysis revealed a consistent negative correlation between GDF-15 concentrations and FEV1 across all measured ranges, whereas previous studies reported such an association only in patients with severely reduced FEV1 (< 30%) [8]. However, regression analysis showed that FEV1 was not an independent determinant of GDF-15 in patients with COPD.
Multiple studies have demonstrated interactions between GDF-15 and TNF-α signaling pathways [27]. Indeed, GDF-15 expression in macrophages is markedly upregulated by IL-1β and TNF-α [28]. GDF-15 inhibits TNF-α production in macrophages, revealing its autocrine regulatory effect on macrophages [29]. In our study, we found a weak correlation between GDF-15 and TNF-α concentrations solely at baseline, suggesting that GDF-15 and TNF-α interactions may be primarily localized and only intermittently reflected systemically.
Among the pleiotropic therapeutic options for COPD patients are statins, which exert anti-inflammatory and antithrombotic effects [22]. Numerous studies have confirmed that statin therapy positively influences COPD outcomes, particularly by slowing the decline of spirometric parameters in smokers and former smokers. Additionally, statins have been associated with reduced rates and severity of exacerbations, lower hospitalization rates, reduced need for mechanical ventilation, and prolonged time to first exacerbation [30]. However, to date, the effect of statins on GDF-15 levels in COPD patients has not been clearly established. Our study provides the first evidence that 3-month simvastatin therapy markedly reduces GDF-15 concentrations in circulating blood.
COPD is also characterized by a hypercoagulable state with hypofibrinolysis [22], mostly associated with higher PAI-1 levels. We observed that statins exerted a profibrinolytic effect in COPD, as evidenced by the lack of correlation between PAI-1 and GDF-15 levels in the statin-treated group, in contrast to persistent positive correlations between PAI-1 and GDF-15 in patients not receiving statins. This suggests that GDF-15 could serve as a valuable, independent biomarker of hypofibrinolysis. Supporting this hypothesis, a recent prospective study of 1,531 cancer patients with 2 years of observation found that higher GDF-15 levels were associated with arterial and venous thromboembolic events in univariate analysis [31]. Moreover, it is known that PAI-1 is a TGF-β-inducing molecule and GDF-15, as a member of the TGF-β superfamily, regulates cellular functions through the downstream pathway of TGF-β [32, 33]. Li et al. [33] reported that administration of GDF-15 significantly increased PAI-1 luciferase activity in head and neck cancer cell lines, whereas GDF-15 silencing suppressed this activation. Therefore, we hypothesize that statins may exert a beneficial effect in patients with COPD through the complex regulation of multiple pathways, with PAI-1 emerging as a newly identified contributing factor, which warrants further investigation in future trials.
Some limitations of our study should be mentioned. First, the sample size was limited. However, the population represented typical COPD patients. Second, the follow-up time was relatively short, and longitudinal studies are needed to detect long-term effects and associations with clinical outcomes in patients with COPD treated with statins. Third, due to evolving treatment guidelines for hypercholesterolemia, current recommendations suggest that most patients with LDL-C levels > 3.0 mM should receive cholesterol-lowering therapy, primarily with statins [34, 35]. As a result, the present findings may not be generalizable to individuals with normal or low cholesterol levels. Moreover, we did not assess genetic variants known to modulate lipid profile [36]. Fourth, we did not assess other factors associated with COPD outcomes, such as exposure to air pollution [37], which can further modulate inflammatory responses and potentially influence GDF-15 levels. Last but not least, our original study, conducted in 2008 according to the good clinical practice guidelines, was locally funded and not registered. This investigation was designed as a randomized study focusing on the evaluation of biomarkers in predicting disease progression, including a post-hoc analysis of GDF-15 levels.
In conclusion, our study suggests that statin treatment is associated with reduced GDF-15 levels, which may be an additional benefit of such treatment, beyond lipid-lowering effects. Further studies on larger cohorts are needed to validate our findings.