Introduction
Metabolic disturbances which are conceptualized as metabolic syndrome (MS) diagnosis features, such as hyperglycemia, dyslipidemia (high triglycerides (TG) and low high-density lipoprotein-cholesterol (HDL-C) concentration) and hypertension, as well as elevated waist circumference (WC), are very common in the elderly population and pose a huge health and economic problem worldwide [1–5]. Nowadays, the same problem is increasingly identified in young people. Additionally, an increasing number of reports have pointed out the occurrence of unexpected constellations of metabolic disturbances, such as metabolically obese normal weight (MONW) or metabolically healthy but obese (MHO) syndromes [6]. This is a significant diagnostic and clinical problem due to the lack of mandatory laboratory examinations for young people, in contrast to the elderly and at-risk populations.
The criteria of MS diagnosis have, however, changed over recent decades and have adapted to the results derived from population studies. Currently, definitions of MS are established by the appropriate scientific societies, the International Diabetes Federation (IDF) and the NCEP-ATPIII (National Cholesterol Education Program) [7, 8], but for MONW syndrome there are still no agreed guidelines for its diagnosis [9]. Metabolically obese normal weight syndrome is mainly characterized by insulin resistance (IR), and occurs with a normal body mass index (BMI). As we showed in our preliminary report, both classic metabolic disturbances and MONW syndrome are very common in young populations [10]. In this context, it is interesting to review commonly used and cheap laboratory parameters potentially associated with MS and MONW syndrome. One of them is serum uric acid (UA). However, its usefulness in metabolic syndrome diagnosis in elderly people is debatable because of the co-occurrence of factors affecting its concentration in this age group [11].
Uric acid is the end product of dietary and endogenous purine metabolism in humans. Its serum concentration depends on the balance between the intake, endogenous synthesis, excretion ratio and metabolism of purines [12]. Higher UA concentrations (above 6.8 mg/dl (404 μmol/l), called hyperuricemia) obviously occur in gout, and are used as a routine diagnostic parameter of this disease [13]. Elevated levels of UA are also reportedly associated with various metabolic disorders, such as glucose intolerance, elevated blood pressure, dyslipidemia, and atherosclerotic cardiovascular diseases [14–16]. However, the definitive role of uric acid in these diseases is still a subject of research, since it is usually accompanied by other risk factors such as unbalanced diet [17], obesity, and dyslipidemia, for which the association with higher UA concentration is more visible in the elderly population. Moreover, it is not yet established whether high serum uric acid concentration is a coexisting marker of these pathological processes or whether it plays the role of a causative risk factor of metabolic disturbances [18]. Some authors have observed that an elevated serum uric acid concentration greatly precedes the development of insulin resistance, which used to be one of the MS diagnostic features. They suggest that an elevated level of UA could be a new/old marker of MS [19, 20]. Even in potentially healthy individuals, the existence of an association between high UA concentration and MS features has been reported [21].
In the light of the above-mentioned facts, the incorporation of serum uric acid measures into the diagnostic test panel for metabolic disturbances appears interesting, especially in the population of young people, whose metabolic disorders do not have many years of history. In our study we decided to evaluate serum uric acid concentration in relation with MS, as well as MONW syndrome features, and to examine its usefulness in improving MS and MONW syndrome diagnosis in young people, which has not previously been investigated in such a constellation of parameters and application of statistical tools.
Material and methods
The study involved 349 young, apparently healthy people, 260 women (W) and 89 men (M), aged between 18 and 31 years (mean: 23 ±2). Participants obtained information about recruitment from advertisements distributed at universities of Wroclaw, and most of them are current or former students. This group was representative for such an age population with a specified socio-economic status in our opinion. All of them took part in the research voluntarily and gave their written consent, after being informed about the purpose and procedure of the study. The study protocol was approved by the Bioethics Committee of Wroclaw Medical University. The criteria for inclusion in the study were age 18–35 years, willingness to participate in the study and good overall health. The exclusion criteria were a history of diabetes, liver or kidney failure, past cancer, acute infections during the 2 weeks preceding the study, or taking anti-allergic drugs during the 3 months preceding the study, as reported by the participants. Before the study all participants completed a specific author’s questionnaire, in which data about smoking status, physical activity, current health condition (subjectively assessed), current medication intake and family history of metabolic disorders were collected. After completing the questionnaire, participants underwent a physical examination with anthropometric measurements such as height, weight, and waist and hip circumference. Also systolic and diastolic blood pressure (SBP, DBP) were measured and body mass index was calculated. Venous blood samples were drawn under fasting conditions using the Sarstedt S-Monovette system to obtain serum or plasma. In plasma, fasting glucose (FG) concentration was determined by the glucose oxidase and peroxidase method, while lipid parameters – total cholesterol (TC), HDL-C and triglycerides (TG) – were determined in blood serum. Low-density lipoprotein-cholesterol (LDL-C) was calculated by the Friedewald formula. Uric acid concentration was also determined in serum using the uricase and peroxidase method. All biochemical parameters were measured with the Konelab 20i Thermo Scientific autoanalyzer and intra- and inter-assay coefficients of variation for FG were 1.13% and 1.99%, for TC 1.72% and 2.27%, for HDL-C 1.33% and 2.42%, for TG 1.74% and 4.08%, respectively.
Serum insulin and C-peptide concentrations were determined by an enzyme-linked immunosorbent assay (ELISA), using the DRG Diagnostics reagent kit with a Scanit Go microplate reader (Thermo Scientific). Intra- and inter-assay coefficients of variation for insulin and C-peptide were 5.5%, 8.7% and 7.1%, 11.4%, respectively. Homeostasis Model Assessment of Insulin Resistance (HOMA1-IR) was calculated based on fasting glucose and insulin concentrations, using an online calculator [22].
For MS diagnosis, the IDF 2009 criteria were used as follows: waist circumference (women ≥ 80 cm, men ≥ 94 cm), blood pressure (SBP ≥ 130 mm Hg and/or DBP ≥ 85 mm Hg), fasting glucose (≥ 5.5 mmol/l), HDL cholesterol (women < 1.2 mmol/l, men < 1.0 mmol/l) and triglycerides (≥ 1.7 mmol/l). We assigned to the group of participants with MS those who fulfilled 3 or more of the above-mentioned criteria [7].
The most frequent method of establishing the HOMA1-IR cut-off value is assessing the upper quartile in the studied population among people without metabolic disturbances [23]. In our previous unpublished study, we established this value as 2.8 in a reference group of 130 selected 18–29 year old, normal-weight people, without carbohydrate metabolism disorders (hyperglycemia, glucose intolerance) and without MS. The same laboratory methods were used for glucose and insulin measurement as in the current study. Based on these results, we accepted HOMA1-IR > 2.8 for insulin resistance diagnosis and BMI < 25 kg/m2 (normal body weight), in accordance with the WHO recommendation [24], as the criteria of MONW syndrome diagnosis. We assigned to the group of participants with MONW syndrome those who fulfilled both the above-mentioned features [23].
All participants of our study were examined for MS and MONW syndrome occurrence, and there was a possibility of MS and MONW syndrome diagnosis in the same participant.
Statistical analysis
Normality of all parameters’ distribution was confirmed by the Kolmogorov-Smirnov test and all results of the examined parameters were presented as mean with ± 2SD observed values. Groups of women and men were compared using Student’s t-test. Correlations between uric acid and other parameters were studied with the Pearson test. Interquartile comparison was conducted by ANOVA for continuous variables and the prevalence of metabolic disturbances was compared as categorical data by the χ2 test. The results of logistic regression analysis give the relative amount by which odds for occurrence of analyzed variables’ (in our case MS or MONW syndrome) increase (OR > 1) or decrease (OR < 1) depending on uric acid quartiles. We also used two data mining techniques, correspondence and discriminate analysis, which are widely used in economic, but lately they have been more frequently and successfully applied in medical studies for assessing the interrelationships between numerous analyzed biochemical parameters. These techniques allow for a multidimensional assessment of the links between data expressed as categorical variables (correspondence analysis) or continuous variables (discriminate analysis) [25–27]. The structure of data categorized into groups of four serum uric acid quartiles (Q1–Q4) and MS, MONW syndrome or absence of these disorders by correspondence analysis followed by logistic regression of MS and MONW syndrome occurrence in uric acid quartiles was examined. The main purpose of the correspondence analysis is to present the analyzed categorical data set (in our case groups of MS, MONW syndrome or apparently healthy participants in quartiles of uric acid concentration) in a two-dimensional space while maintaining the fullest information on the diversity of variables taking into account belonging to specific groups. Discriminate analysis was performed in order to examine the utility of MS and MONW syndrome criteria, and additionally uric acid concentration, in classification into MS and MONW syndrome groups. This method is used mainly for finding a set of prediction equations based on independent variables that are used to classify individuals into groups. Discriminate functions created in this method allows one to determine which of the analyzed variables discriminate subjects between two or more naturally occurring groups (in this study into groups of subjects with MS, MONW syndrome and without MS and/or MONW syndrome). In interpretation, the larger the value of the variables’ loading (eigenvalues), the greater is the contribution of the respective variable to the discrimination function. Interpreting the predictive equation allows for better understanding of the relationships that may exist among the variables and assessing their contribution to discriminate power. The proportion of total variation of each discriminate function, shown as a percentage, describes the ability of the analyzed variables to explain the proportion of the variance accounting for the discriminate function, relative to the total variance. Statistical analysis was performed using Statistica PL version 13. The p-value < 0.05 was considered as significant.
Results
The anthropometric and biochemical characteristics of all examined participants regarding gender with statistical analysis are provided in Table I.
Table I
Anthropometric and biochemical parameters of all study groups presented separately in groups of women and men
[i] BMI – body mass index, DBP – diastolic blood pressure, FG – fasting glucose, HC – hip circumference, HDL-C – high-density lipoprotein-cholesterol, HOMA1-IR – Homeostasis Model Assessment 1 – Insulin Resistant, LDL-C – low-density lipoprotein cholesterol, SBP – systolic blood pressure, TC – total cholesterol, TG – triglycerides, UA – uric acid, WC – waist circumference.
The average values of all analyzed parameters, for the total examined group, are located within the range of reference intervals. However, we observed significant differences between genders for all parameters except for total cholesterol concentration and C-peptide.
Correlation analysis of uric acid concentration with biochemical and anthropometric parameters, in decreasing order of correlation coefficient value, is presented in Table II.
Table II
Coefficients of uric acid correlation analysis with biochemical and anthropometric parameters in all study participants
[i] BMI – body mass index, SBP – systolic blood pressure, DBP – diastolic blood pressure, FG – fasting glucose, HDL-C – high-density lipoprotein cholesterol, HOMA1-IR – Homeostasis Model Assessment 1 – Insulin Resistant, r – correlation coefficient for Pearson’s correlation test, WC – waist circumference, TG – triglycerides.
The highest correlation coefficient values were observed for anthropometric parameters such as WC and BMI, and for the remaining variables, weak, but still significant correlations were noted (from TC to C-peptide).
On the basis of IDF 2009 criteria for MS and criteria established by us for MONW syndrome diagnosis as BMI < 25 kg/m2 and HOMA1-IR > 2.8 (see Materials and methods section), MS and MONW syndrome were identified in 30 (8.6%) and 86 (24.7%) persons, respectively. Only in one woman and two men, representing 0.4% and 2.2% of all study participants, was the simultaneous occurrence of MS and MONW syndrome observed. We examined the values (continuous variables expressed as mean) and prevalence (categorical variables expressed as percent) of every single feature of MS and MONW syndrome diagnosis, in quartiles of increasing uric acid concentration in the whole examined group of young adults. Rows 1–6 and 7–8 refer to diagnostic features of MS and MONW syndrome, respectively. Results of this comparison with statistical analysis are presented in Table III.
Table III
Mean values of MS and MONW features in quartiles of increasing uric acid serum concentration, along with the percentage of people who presented a single feature of MS and MONW in particular uric acid concentration quartiles in the whole examined group
| Variables/Cut-off values | Uric acid [μmol/l] | P-value, χ2 Pearson for % values | |||
|---|---|---|---|---|---|
| Q1: ≤ 241 n = 87 | Q2: > 241 and ≤ 280 n = 87 | Q3: > 280 and ≤ 333 n = 87 | Q4: > 333 n = 88 | ||
| Mean ± SD (%) | Mean ± SD (%) | Mean ± SD (%) | Mean ± SD (%) | ||
| WC [cm] | 71.7 ±8.6 | 73.3 ±9.0 | 75.6 ±10.0 | 87.1 ±12.9a,b,c | < 0.001 |
| ≥ 80 W; ≥ 90 for M | (12.94) | (17.65) | (22.89) | (39.29) | |
| SBP [mm Hg] | 115 ±9 | 117 ±13 | 117 ±15 | 126 ±17a,b,c | < 0.001 |
| ≥ 130 mm Hg | (5.88) | (11.76) | (16.88) | (34.52) | |
| DBP [mm Hg] | 74 ±8 | 76 ±8 | 75 ±8 | 80 ±8a,g,h | 0.030 |
| ≥ 85 mm Hg | (11.76) | (15.29) | (8.43) | (28.57) | |
| FG [mmol/l] | 4.8 ±0.6 | 4.8 ±0.4 | 4.8 ±0.4 | 5.0 ±0.4a,e,h | 0.016 |
| ≥ 5.6 | (3.53) | (3.53) | (6.02) | (14.29) | |
| HDL-C [mmol/l] | 1.6 ±0.3 | 1.5 ±0.3 | 1.5 ±0.3 | 1.3 ±0.4a,d,f | 0.194 |
| ≤ 1.3 for W; ≤ 1.0 for M | (10.59) | (15.29) | (14.46) | (22.64) | |
| TG [mmol/l] | 0.9 ±0.4 | 0.9 ±0.4 | 0.9 ±0.4 | 1.1 ±0.6a,e,f | 0.011 |
| ≥ 1.7 | (2.35) | (9.41) | (7.23) | (16.67) | |
| BMI [kg/m2] | 21.0 ±3.1 | 21.5 ±2.8 | 22.1 ±3.2 | 25.3 ±4.3a,b,c | < 0.001 |
| < 25.0 | (91.8) | (87.1) | (86.7) | (57.1) | |
| HOMA1-IR | 2.5 ±1.0 | 2.9 ±1.4 | 2.6 ±1.2 | 3.5 ±1.5a,e,c | |
| > 2.8 | (30.58) | (40.0) | (30.1) | (54.8) | 0.003 |
[i] BMI – body mass index, DBP – diastolic blood pressure, FG – fasting glucose, HDL-C – high-density lipoprotein cholesterol, HOMA1-IR – Homeostasis Model Assessment 1 – Insulin Resistant, M – group of men, SBP – systolic blood pressure, TG – triglycerides, W – group of women, WC – waist circumference. (%) percent of participants meeting the diagnostic criteria of MS and MONW in particular quartiles, p-values for continuous variables in ANOVA comparison: aQ4 vs. Q1, p < 0.001; bQ4 vs. Q2, p < 0.001; cQ4 vs. Q3, p < 0.001; dQ4 vs. Q1, p < 0.010; eQ4 vs. Q2, p < 0.010; fQ4 vs. Q3, p < 0.010; gQ4 vs. Q2, p < 0.050; hQ4 vs. Q3, p < 0.050.
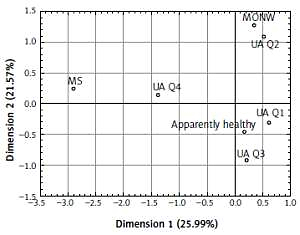
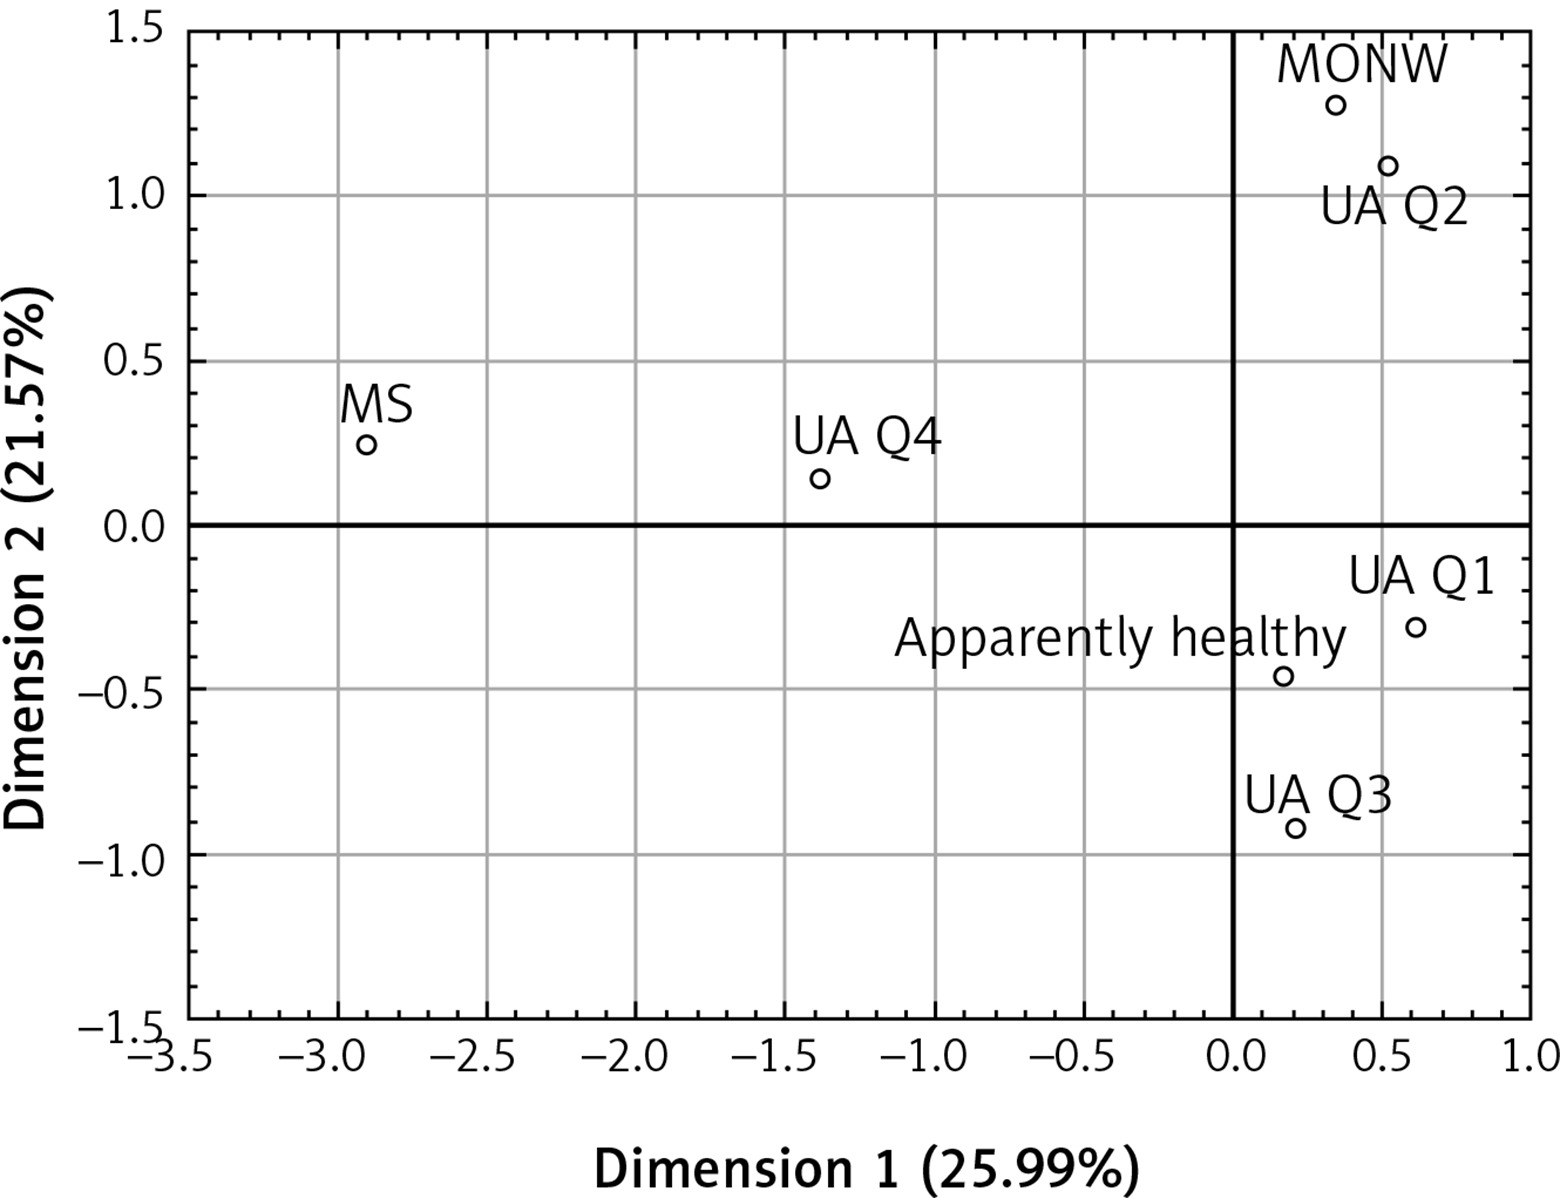
We also observed a significant increase in MS and MONW syndrome diagnostic criteria values from uric acid quartiles one to four, except for HDL-C, for which the concentration decreased from Q1 to Q4, although this difference was not significant. The percentage of people fulfilling the criteria for every single feature of MS and MONW syndrome is significantly higher in Q4 in comparison to Q1–Q3 with the exception of BMI, whose frequency in Q4 was the lowest. Additionally, we analyzed prevalence of MS and MONW syndrome in successive UA quartiles and revealed a significant and consistent increase in MS frequency: Q1 – 1.18%, Q2 – 2.35%, Q3 – 4.82%, Q4 – 20.24% (p < 0.010). The highest presence of MS was observed in Q4, which was almost twenty times more frequent than in Q1. In the same way the frequency of MONW syndrome from uric acid quartiles Q1–Q4 was analyzed. The observed results differ from those obtained for MS, because, in contrast to MS, the prevalence of MONW syndrome was practically at the same level in all uric acid quartiles (Q1 – 24.71%, Q2 – 30.59%, Q3 – 20.48%, Q4 – 21.43%) (p = 0.413). For the graphical presentation, we conducted correspondence analysis with the purpose of describing the relationship between serum uric acid quartiles and MS or MONW syndrome diagnosis in apparently healthy people. The concept of the correspondence analysis is described in detail in the Statistical analysis section and the results are shown in Figure 1. This analysis revealed that uric acid quartiles 1, 2 and 3 are connected with the group of participants with fewer than 3 MS features (e.g. apparently healthy people and the MONW syndrome group). These groups are located on the right side of Figure 1 demarcated by dimension 1 (vertical line). However, MS participants are characterized by a high serum uric acid concentration (Q4), and those people are clearly located separately from the apparently healthy and MONW syndrome groups. These groups are located on the left upper side of Figure 1 demarcated mainly by dimension 1 (vertical line). In order to deepen the obtained results of correspondence analysis, where MS occurrence was connected with the highest UA concentration, logistic regression analysis was carried out where hyperuricemia (> 404 μmol/l) (adjusted for age and gender) was treated as a risk factor of MS or MONW syndrome. For the participants with hyperuricemia and also for male gender, we observed a significant increase in the odds ratio of MS (adjusted OR for MS frequency for hyperuricemia of uric acid was 4.4) (95% CI: 1.7–11.8, p < 0.001) and for male gender 5.2 (95% CI: 2.1–13.1, p < 0.001). However, the odds ratio for MONW was not dependent on high uric acid concentration, gender or age.
Figure 1
Correspondence analysis of metabolic syndrome (MS), metabolically obese normal weight (MONW), and apparently healthy participants with uric acid quartiles (Q1–Q4)
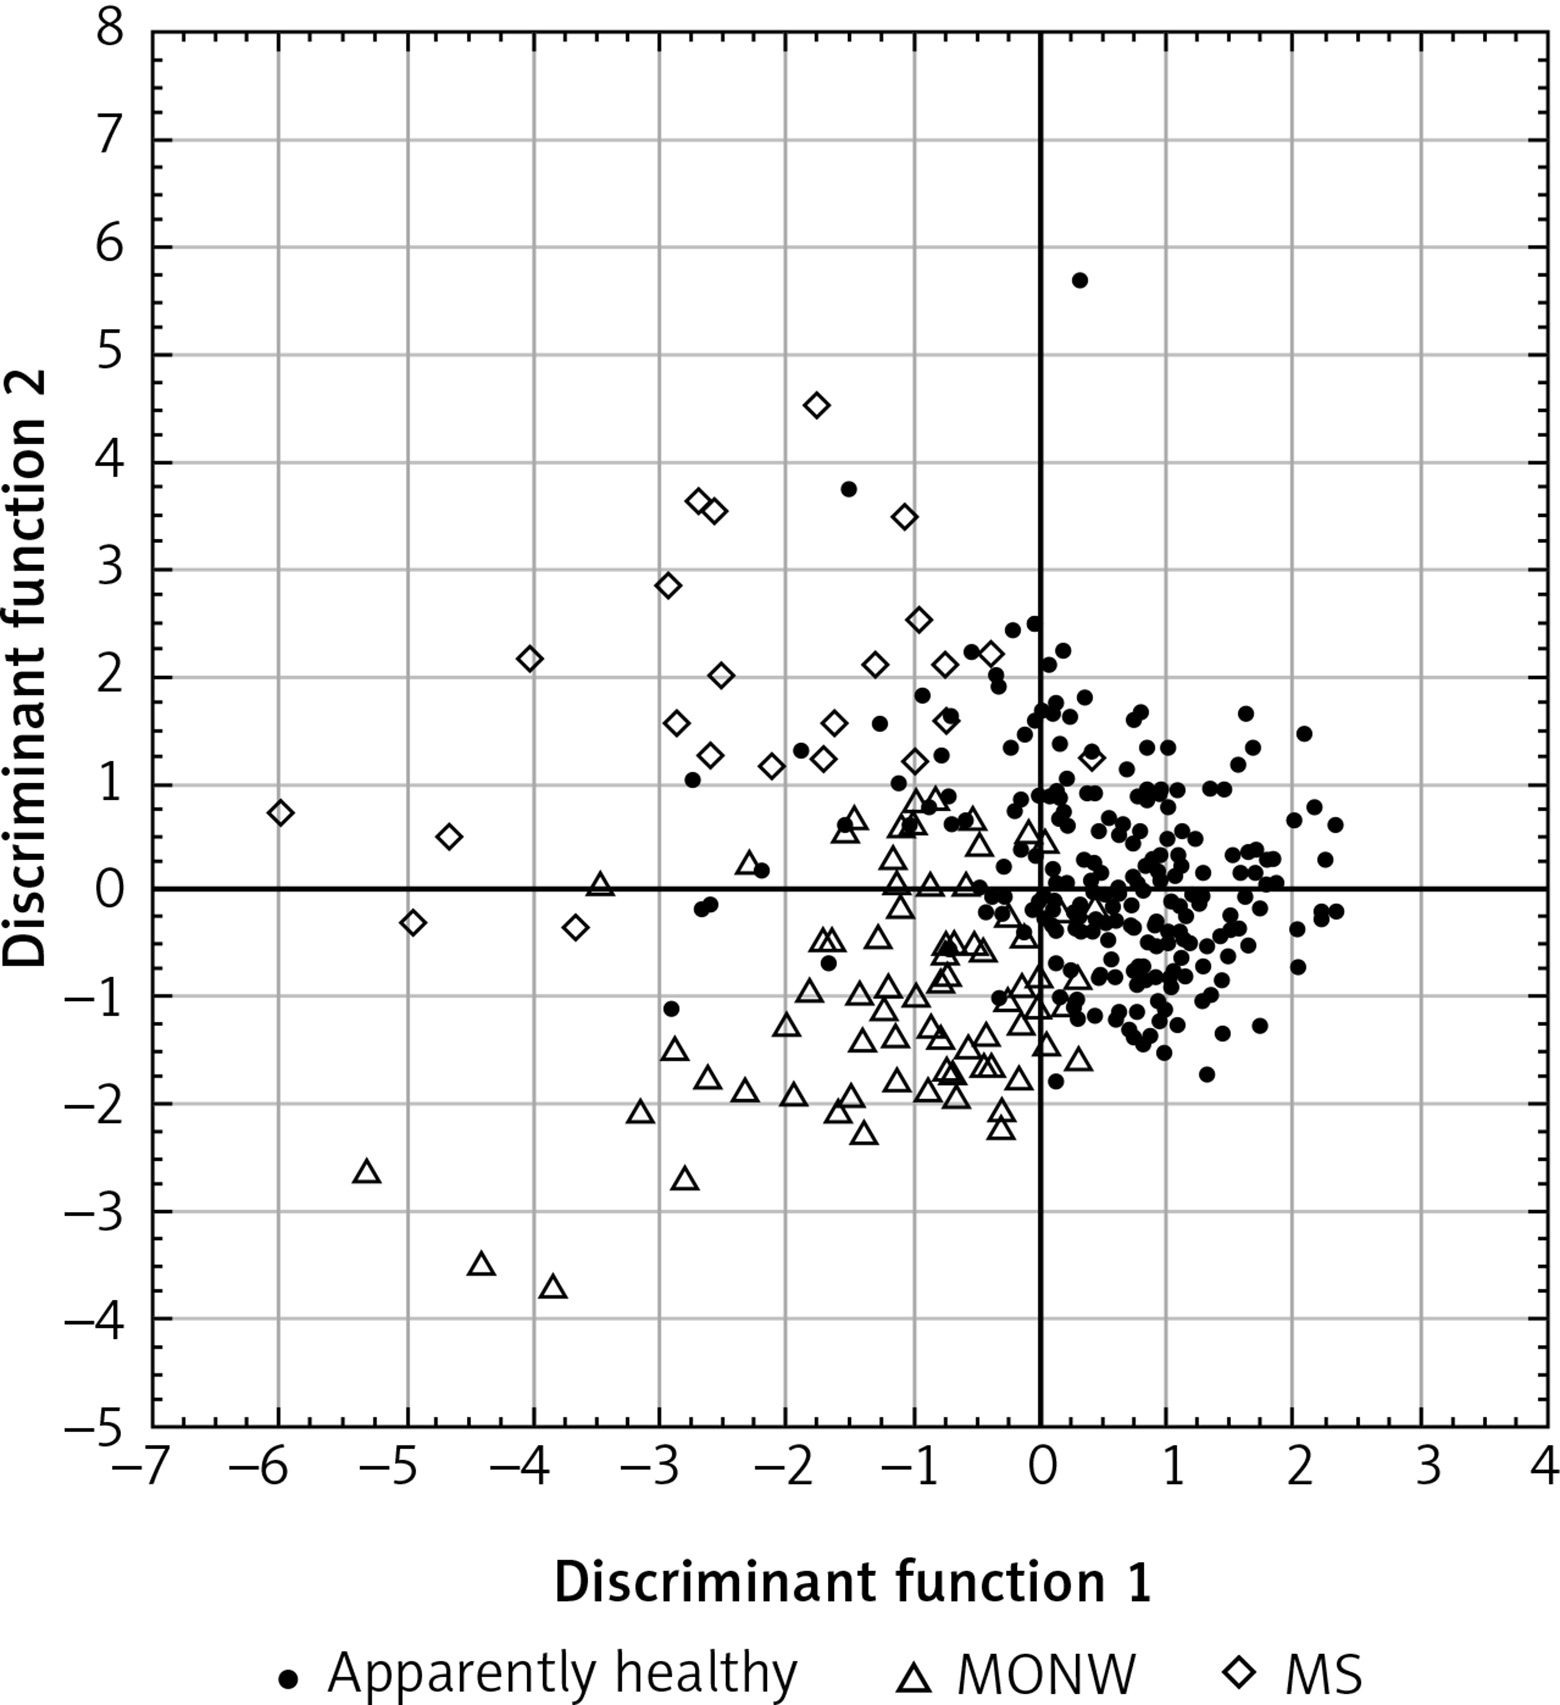
In order to determine the usefulness of introducing UA concentration to MS and MONW syndrome diagnosis in young people, we evaluated whether the increasing concentration this parameter has the same or higher power for MS and MONW syndrome diagnosis as the conventional criteria applied in our study. For this purpose we analyzed simultaneously parameters used previously for MS and MONW syndrome diagnosis (WC, SBP, DBP, FG, HDL-C, TG, BMI, HOMA1-IR) and UA as continuous variables by canonical discriminant analysis followed by forward step analysis. The results of this analysis revealed a significant contribution to the discriminant function for HOMA1-IR, BMI, HDL-C, DBP and WC but not for UA, as shown in Table IV. Standardized canonical discriminant coefficients are used to rank the importance of examined variables. A highly standardized discriminant function coefficient means that the groups differ greatly in accordance with that variable. In our study we observed the lowest eigenvalues for UA values from all those analyzed, which means that its concentration does not contribute to definition of MS and MONW syndrome. The 1st discriminant function was the most weighted by HOMA1-IR and explained 64% of the total variation, whereas the 2nd one was the most weighted by BMI (36% of total variation). Figure 2 was plotted on the basis of these results and shows that positive values of the 1st discriminant function tend to separate apparently healthy participants from those with MONW syndrome and MS identification. Negative values of the 2nd discriminant function tend to separate MS participants from MONW participants, but contribute relatively little to the correct classification of apparently healthy people.
Table IV
Standardized canonical discriminant coefficients for the analyzed variables contributing to discriminant functions for MS, MONW and apparently healthy
Discussion
The associations between serum uric acid levels and MS have been evaluated in many studies, primarily in adults but also in children [28, 29]. The degree of their usefulness is still controversial because of the possibility of the influence of many interfering factors such as inflammation and oxidative stress, excess food and alcohol consumption and stressful lifestyle on UA serum concentration [30, 31]. However, there is little research on MS, MONW and the relationships between their individual components in the community of young people. This is a population with a long life expectancy, but unexpectedly frequent metabolic disturbance incidents occur, as we showed in our previous study [32]. Due to the indicated participation of uric acid in the pathogenesis of metabolic disturbances, also associated with MS, a change in approach to the role of UA is necessary in clinical practice. In this light, UA may be considered as an indicator and/or a predictor of the development of metabolic disorder, especially in young people. Several studies have reported significant associations of hyperuricemia with visceral or central and general obesity (measured by waist circumference and BMI, respectively), TG, vascular endothelial dysfunction, insulin resistance, and cardiovascular diseases [33]. Moreover, some authors have pointed out the emergence of UA as a possible biomarker to distinguish obese middle aged (aged 32–38) patients with and without MS [34]. However, they suggested that longitudinal research on younger patients would be necessary in order to determine whether it is a biomarker of future metabolic syndrome development.
Our results indicate that serum uric acid concentration correlates significantly with all biochemical and anthropometric parameters in the examined young people and the strongest relationships were revealed for WC, BMI, TC and HDL-C. Similar results with respect to strength and order of parameters were obtained by Gil-Compos et al. [29], but in a much younger group (about 10 years old), among which 23–25% of obese children presented at least three MS components. Our previous study showed that metabolic syndrome was mainly predominant among young men, while MONW was almost exclusively detected in women. We suggest that in young people an increase in uric acid levels is more closely related to metabolic syndrome features than insulin resistance. This is supported by our current observation that in the whole examined group, MS prevalence increases along with an increase in UA quartiles, while the percentage of MONW participants was at a similar level in all UA quartiles (Table III). We also found that serum UA level was significantly higher in men than in women. This may be due to estrogen promoting uric acid excretion in women [35].
Increased serum uric acid levels may be an expression of an insulin-resistant state, and metabolic syndrome. This proposition is supported by evidence that higher serum uric acid levels correlate with lower insulin-stimulated glucose uptake and a higher plasma insulin response to oral glucose loading [29]. Furthermore, there are studies which indicate that decreasing uric acid levels may prevent or reverse the course of MS. One possible biological mechanism governing this is related to insulin-stimulated endothelial nitric oxide synthesis. In this way hyperuricemia may induce endothelial cell dysfunction and contribute to the development of MS [36]. Avula et al. [37] examined patients with MS with a mean age of 52.3 years, and found that HOMA1-IR > 3.4 was significantly associated with hyperuricemia (> 404 μmol/l (> 6.8 mg/dl)). We obtained similar results in our study group located within Q4 UA (> 333 μmol/l (> 5.6 mg/dl)), in which the highest mean value of HOMA1-IR (3.5) occurred and the highest prevalence of MS was also observed in this quartile. Additionally, Mangge et al. [34], using the comprehensive logistic regression model, identified uric acid as the best predictor of MS, with an odds ratio of 3.4 (95% CI: 1.4–8.0) per unit increase (i.e., 1 mg/dl) in adults. The results of our study showed that higher UA levels, even those not high enough to fulfill the criteria for hyperuricemia recognition, were associated with an elevated risk of MS, as revealed in quartile comparison and correspondence analysis (Table III and Figure 1). A similar observation was made by Liu et al. [38] among an elderly Chinese population, even though the occurrence of hyperuricemia was noted in only about 16% of that population. For MONW participants, no such connection was observed. Moreover, Chen et al. [39] found that the odds of developing MS are 1.6 times higher in middle aged individuals (aged around 40) with hyperuricemia. A cohort study conducted by Young et al. [40] in the Taiwanese population showed the hazards ratio of UA serum level for MS to be 2.38 in women but only 1.38 in men, compared with the lowest tertile. The underlying mechanism of the sex-related difference is, however, still unclear and needs future investigation [41]. In our study, for assessing the chance of MS or MONW occurrence based on serum uric acid quartiles, logistic regression analysis was conducted. This analysis showed a significant increase in the odds ratio of MS occurrence in patients with hyperuricemia and in males. However the odds ratio for MONW was not dependent on uric acid concentration examined in the quartile range. This observation was also confirmed and illustrated by correspondence analysis, in which we revealed that participants with 3 or more MS features predominated in Q4 UA and are clearly located separately from apparently healthy people, as well as the MONW group (Figure 1).
Studies concerning uric acid in MONW are scarce. Only Zhang et al. [6] have recently examined this connection and using different criteria for MONW diagnosis (normal weight and MS according IDF 2009). They found that uric acid concentration differed significantly between obese people with and without MS, while for normal weight participants (MONW vs. healthy) such a differences was not observed. In our study, on the basis of standardized canonical discriminate coefficients (Table IV), we found that adding UA concentration to the constellation of MS and MONW criteria had low power to distinguish between the analyzed groups of participants. However, the quality of discrimination into 2 groups – apparently healthy, and those with metabolic disturbances (MONW and MS) – is slightly better (Figure 2). In the scientific literature, the usefulness of uric acid determinations for very early prediction of the risk of insulin resistance and metabolic syndrome is still a matter of discussion. To the best of our knowledge, our study is the first to comprehensively and simultaneously examine MONW, MS and apparently healthy people with regard to serum acid concentration, and its usefulness in distinguishing patients with metabolic disturbances from healthy people. The age group of the young people examined by us (18–31 years) is well suited to verify the suitability of hyperuricemia detection as a predictor of insulin resistance, the main component of MONW diagnosis. Comprehensive analysis of the data showed a relationship between uric acid concentration in both quartile and correlation analysis with features of metabolic disorders; however, modern methods of data mining did not indicate its usefulness for distinguishing people with MS from MONW and were not related to a specific MS feature, as demonstrated by the discriminant analysis.
In conclusion, in the group of young adults, occurrence of uric acid concentrations in the area closely related to upper reference values is clearly associated with the occurrence of MS, but the introduction of this parameter to the criteria for the diagnosis of MS or MONW does not seem to have much discriminatory power. In our opinion serum uric acid concentration could not be recommended as an independent, strong marker of MS or MONW occurrence in young people, but its elevated concentration should be a strong indicator for screening for other disturbances associated with MS diagnosis. In view of the constantly changing criteria for diagnosis of metabolic disorders, especially MS and MONW, the search for diagnostic markers is still current and important. Our findings could provide valuable information for understanding the current situation concerning metabolic disturbances among young people.
We are aware of some limitations of our study. While it was performed on a group of young adults aged 18–-31, further studies in a larger study group and in other age groups are needed for improving the assessment of serum uric acid’s usefulness as a predictor of metabolic disturbance in the general population.