Introduction
Psoriasis is one of the most common chronic inflammatory dermatological diseases. Recent research has shown that this disease affects about 2–5% of the global population [1]. Psoriasis is characterized by red to brownish-red papules covered with scales. The lesions are delimited from the surrounding skin. The clinical manifestations of psoriasis vary considerably from patient to patient and from individual eruptions to generalized lesions. Depending on the extent of the changes on the skin, the following forms of psoriasis can be distinguished: plaque, guttate, pustular and so forth [2]. Eruptions can occur on any area of the body; they are most often located on the elbows, knees, scalp and nails (psoriasis of the nails) [3]. Psoriatic arthritis is a severe type of psoriasis. It can cause arthritis and, consequently, leads to the deformity of joints, impaired mobility and even disability. The most common symptom is the involvement of the phalanges and sacroiliac joints and tenderness in the areas of tendon attachment [4, 5].
Even though the etiology of psoriasis is not fully understood, an immunological (Langerhans cells and T helper cells, especially Th1 and Th2), genetic or environmental origin has not been excluded. An autoimmune background is associated with how the body attacks and destroys its own tissues [6]. The molecular mechanism has also not been fully explained. However, cytokines such as tumor necrosis factor α (TNF-α); transforming growth factor β (TGF-β); interferon-γ (IFN-γ); interleukins, such as IL-1-β, IL-6 and IL-8; chemokines (CCL, CXCL and CX3CL), such as CXCL9, CXCL10 and CXCL11; chemokine receptors (CCR, CXCR and CX3CR); and cyclooxygenase-2 (COX-2) play an important role [7]. TNF-α is a pleiotropic cytokine that stimulates, among other processes, T-cell proliferation, B-cell proliferation and differentiation and their release of proinflammatory cytokines. Under the influence of activated T lymphocytes, there is increased proliferation of keratinocytes and thus resistance to apoptosis [4–9].
Psoriasis patients are often diagnosed with comorbid diseases which are included in the metabolic syndrome. These diseases include diabetes, cardiovascular diseases and obesity [10–14]. The findings of a study showed that metabolic syndrome diseases are much more common in psoriasis patients compared to the healthy group [15]. According to the literature, disorders in lipid metabolism, as well as abnormalities in oxidative balance, are associated with chronic inflammation [16]. In addition, proinflammatory cytokines are involved in both the pathogenesis of psoriasis and metabolic syndrome diseases (e.g., obesity) [17].
The majority of the systemic changes in the course of psoriasis and psoriatic arthritis correlate with the Psoriasis Area and Severity Index (PASI), body surface area (BSA) and Dermatology Life Quality Index (DLQI), as well as with inflammatory markers – C-reactive protein (CRP) and Biernacki’s reaction (OB). In addition, in the case of psoriatic arthritis, the Disease Activity Score indicator (DAS28) correspond to the degree of disease activity with respect to joints. Therefore, it is necessary to monitor their values at every stage of treatment.
The choice of therapy method depends on the severity of the skin lesions, the frequency of relapses and the course of the disease. The goal of the treatment is to achieve the longest remission periods [18]. Currently, psoriasis treatment is carried out locally (e.g., using urea, salicylic acid and dithranol) as well as generally (e.g., using retinoids, cyclosporine A and photochemotherapy). It should be emphasized that biological drugs (proteins derived from living cells or obtained by genetic recombination that exhibit pharmacological effects) are currently the only therapy for patients nonresponsive to other treatment methods. The following groups of biological drugs can be distinguished: recombinant human proteins, fusion proteins and chimeric and humanized or human monoclonal antibodies [19].
Biological therapies are successfully used not only in the field of dermatology but also in the treatment of endocrine diseases (e.g., growth hormone), rheumatoid diseases – rheumatoid arthritis, ankylosing spondylitis (e.g., abatacept, golimumab and certolizumab), cancers (e.g., bevacizumab, cetuximab and panitumumab) and chronic inflammatory bowel disease and Crohn’s disease (e.g., anti-TNF drugs) [20, 21]. There are many types of biological drugs to treat psoriasis: drugs blocking IL-12-IL-23 p40 (ustekinumab and briakinumab), anti-IL-17A antibodies (secukinumab), Janus kinase family inhibitors (tofacitinib and tasocitinib) and IL-6 receptor blockers (tocilizumab). But the most common are those that block TNF-α (adalimumab and etanercept) [20, 21].
Various biological drugs may have systemic effects due to the immunological aspect [22, 23]. Their mechanism of action is the inhibition of proinflammatory cytokines. This leads to the blocking of T-cell activity and the migration of inflammatory cells from the lymph nodes to the circulation system and the skin [24].
Patients taking biological drugs are participants in clinical trials, and the effects of the treatment are regularly monitored and subjected to thorough analyses [25, 26]. Many studies have demonstrated the efficacy of adalimumab in the treatment of psoriatic arthritis. However, it has also been proven that this therapy may have numerous side effects – such as nausea, vomiting, headaches and muscle pains, rubor, nettle rash, upper respiratory tract infections, sinusitis and fungal and bacterial infections [27, 28].
Many attempts have been made to identify mRNA in peripheral blood mononuclear cells (PBMCs), which could be easily accessed and used as markers of the intratissue process of various diseases [29, 30]. However, only a few studies have identified genetic pathways of dermatological diseases. In addition, the gene expression profile of the blood samples of patients with psoriasis during adalimumab treatment is still not well known.
Thus, this study aimed to assess the systemic effects of the subcutaneous administration of the biological drug adalimumab to patients with psoriatic arthritis. The influence of the drug on the reduction of the skin lesions defined by the PASI, BSA and DLQI indicators was assessed by analyzing the values of these indicators before the first dose and before the dose after 3 months. Furthermore, the effect of the drug on the OB index, which is one of the indicators of inflammation, was also analyzed. Changes in the value of DAS28 as a result of the treatment were also determined. In addition, the differences in gene expression in the patients’ PBMCs in relation to the control group, who were healthy subjects with no dermatological dysfunctions, were also analyzed.
Material and methods
The study group consisted of 20 patients (12 men and 8 women), aged 48 ±10 years, who were undergoing anti-TNF (adalimumab) biological therapy for psoriatic arthritis in Poland. The main inclusion criterion for the study group was severe psoriasis (PASI > 10, BSA > 10%) that had stopped responding to conventional general treatment methods (at least two antirheumatic disease-modifying drugs administered as monotherapy or polytherapy) or cases in which contraindications to the use of this type of therapy were found. The exclusion criteria were individuals under the age of 18, hypersensitivity to the active substance or auxiliary drug, an active infection of various origins, drug or alcohol abuse and mental illness. The patients were under the care of the Dermatology Clinic of the Silesian Medical University in Katowice. For all of the patients included in the study, the following parameters were determined: PASI, DLQI, BSA (%) and DAS28. In addition, a biochemical panel was created, including the inflammation indicators OB (mm/h) and CRP (mg/l). The characteristics of the experimental group are shown in Table I.
Table I
Selected features of patients participating in the study ([M0] – before the first dose of the drug, [M1] – before the next doses of the drug after 3 months of I-monitoring) (n = 20)
The control group consisted of 20 individuals (8 women and 12 men) aged 46 ±10 years, who had not been diagnosed with psoriatic arthritis and were not using general steroid therapy or any other immunosuppressive treatment.
The biological drug (adalimumab) was administered under the skin of the patients with a 40 mg pre-filled syringe every 2 weeks. Every 3 months, the patients underwent routine tests (called monitoring [M]), including the procedures described above.
The study was approved by the Bioethical Commission of the Silesian Medical University in Katowice (KNW/0022/KB1/59/13) in accordance with the Helsinki Declaration on medical research involving human participants. The patients who were included in the study consciously decided to participate in the project by signing a consent form.
To carry out the molecular analyses, venous blood samples (5 ml) were taken from the aortic vein before administering the biological treatment (adalimumab), during the treatment (follow-up visits, as determined by the above-mentioned monitoring) and after the therapy was discontinued. The extraction of total ribonucleic acid (RNA) from PBMCs was performed using a PAXgene Blood RNA Kit IVD (Qiagen, Wroclaw, Poland) according to the manufacturer’s recommendations. The concentration of the nucleic acid was determined using a Nano MN-913 MaestroNano Pro Micro-volume Spectrophotometer (Maestrogen, Hsinchu City, Taiwan).
For the analysis of the oligonucleotide microarrays, samples from patients with psoriatic arthritis who had been treated were analyzed (before the adalimumab first dose [M0] was administered and during the first monitoring – 3 months before the next doses [M1]) – as well as control samples from the healthy individuals with no dermatological issues [C]). The gene expression profile was analyzed using HG-U133A_2.0 commercial oligonucleotide microarrays (Affymetrix, Santa Clara, CA, USA) according to the manufacturer’s instructions.
The products of the individual stages of the transcriptome determination using oligonucleotide microarrays were quantified using the spectrophotometric and qualitative techniques of agarose gel electrophoresis. Only those samples that met the qualitative and quantitative assessment criteria specified by Affymetrix were used in the next stages of the analysis.
Statistical analysis
The statistical analysis was performed using the Statistica 13.0 software (StatSoft, Kraków, Poland) and the significance level was set at p < 0.05. A one-way ANOVA test with the Benjamini-Hochberg correction was used to assess the significance of differences in the gene expression between the test and control groups. Data from the oligonucleotide microarrays were analyzed using PL-Grid Infrastructure (http://www.plgrid.pl/), which was based on the GeneSpring 13.0 platform (Agilent Technologies, UK Limited, South Queensferry, UK). A list of the genes was prepared, the differential expression of which was identified at the level of two-fold change in at least one pair at p < 0.05. The next stage of the analysis was the classification of the genes in relation to the processes in which they participate (biological, molecular functions, cellular components and pathways). The classification was performed using the Protein Analysis through Evolutionary Relationships (PANTHER) classification system 13.1 database program (http://www.pantherdb.org). The presented system enables large-scale analysis of genomes. Genes are classified according to their function in several ways. It is possible to rank by families, subfamilies, protein classes and pathways. This database gives the opportunity to analyze data using various statistical tests [31].
Using the STRING database, the relationship between genes associated with the process of apoptosis indicated in the overrepresentation test was analyzed. The results are presented in the form of diagrams showing the interactions between individual genes.
The STRING database is an easily accessible program and its information is constantly updated. This database has information about proteins obtained from publicly available scientific texts and experiments. It is mainly used to analyze the functional and structural relationships of individual proteins.
Student’s t-test for dependent tests was used to assess the relationship between adalimumab intake and the dermatological index values and inflammation in the patients. Statistically significant results were assumed when p < 0.05.
Results
When comparing the PBMC transcripts in patients with psoriatic arthritis prior to the administration of the drug – before dosing [M0], after 3 months [M1] and in the control group [C] – statistically significant differences in the expression level of the 4,114 mRNA transcripts were found between the groups (univariate ANOVA analysis using the Benjamini-Hochberg procedure, p < 0.05) (Table II).
Table II
Number of the probe set identifiers (IDs) of the genes differentiating the PBMC transcripts of patients who were undergoing adalimumab treatment (before dosing and before the next dose after 3 months of I-monitoring) from the PBMCs in the control group
| One-way ANOVA variance analysis with Benjamini-Hochberg correction | ||||||
|---|---|---|---|---|---|---|
| P-value | P complete | p < 0.050 | p < 0.020 | p < 0.010 | p < 0.005 | p < 0.001 |
| Pobe set identifiers number | 22277 | 4114 | 2598 | 1720 | 1046 | 229 |
Analysis of the expression profile of 22,277 mRNA transcripts was started with the generation of mRNA heat maps, using Heatmap in the GeneSpring XG program. We determined the changes in the gene expression profile by comparing the changes in the color of the mRNA to the controls. The results are not presented here.
To obtain more detailed data on the degree of differentiation of the concentration profile of the 22,277 mRNA transcripts in individual groups of transcripts, a post-hoc Tukey’s multiple comparison test (p < 0.05) was performed (Table III). The results indicate the number of mRNA transcripts differentiating the PBMC transcripts of the patients with psoriatic arthritis prior to taking the drug [M0] and before the next doses of the drug were administered after 3 months [M1]: [M0] vs. [C] – 4,068 ID transcripts, [M1] vs. [C] – 4,068 ID transcripts, [M0] vs. [M1] – 76 mRNA transcripts.
Table III
The number of the probe set identifiers (IDs) differentiating the examined transcriptome groups from each other ([C] – control, [M0] – before the first dose of the drug, [M1] – before the next doses of the drug after 3 months of I-monitoring)
| Tukey’s post-hoc multiple comparison test | |||
|---|---|---|---|
| Transcriptome group | [C] IDs | [M0] IDs | [M1] IDs |
| IDs [C] | 4114 | 4068 | 4084 |
| IDs [M0] | 46 | 4114 | 76 |
| IDs [M1] | 30 | 4038 | 4114 |
For the analysis, 1,995 mRNA transcripts, which showed more than a two-fold statistically significant change in expression in at least one pair compared to the control, were selected. An increase in the expression of 1,237 mRNA transcripts was observed in at least one pair, whereas the expression of 1,429 mRNA transcripts was silenced in at least one pair.
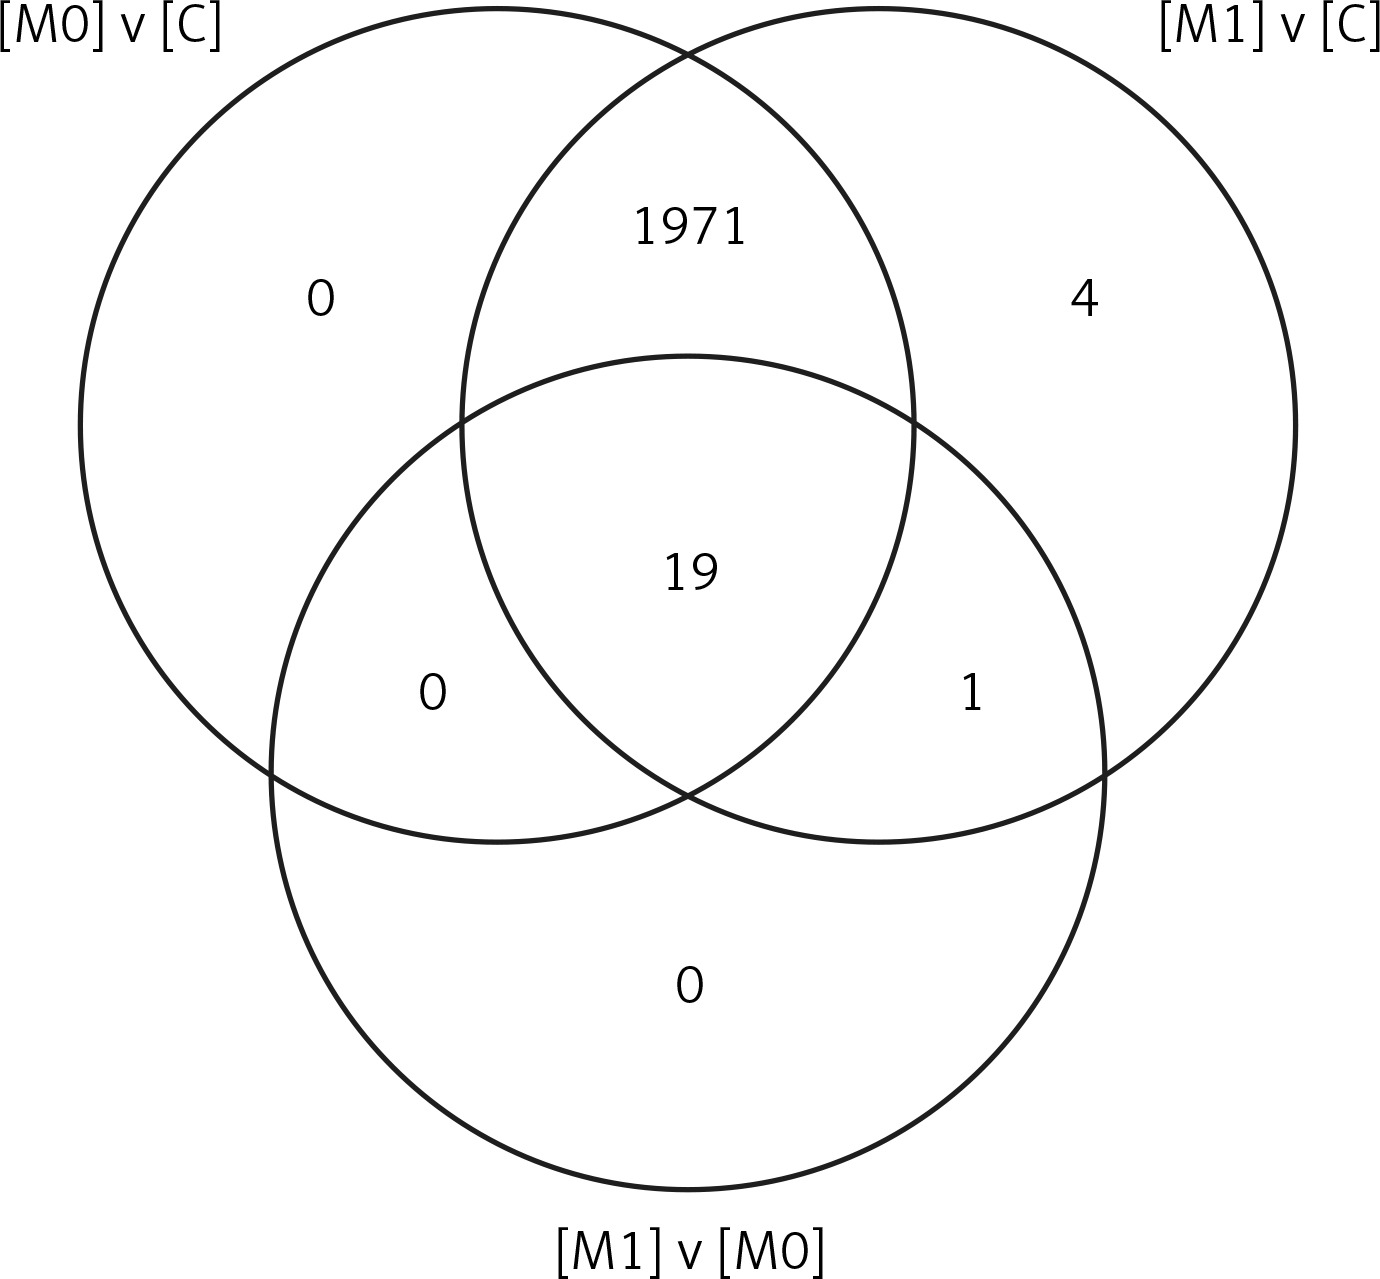
The next stage of the analysis indicated the number of mRNA transcripts differentiating the analyzed transcriptome groups using a Venn diagram (Figure 1). Further PANTHER analysis permitted a more accurate characterization of the observed changes in the PBMCs in patients with psoriatic arthritis prior to drug administration [M0], before the next doses of the drug after 3 months [M1] and in the control group [C] using the hierarchically organized terms of Gene Ontology, which constitute a universal classification and categorization of the biological processes in which a given gene participates, the molecular functions of a given gene product and the signaling pathways in which this gene participates.
Figure 1
Venn diagram grouping the mRNA IDs that was selected by Tukey’s post-hoc test with the Benjamini-Hochberg correction (after the one-way ANOVA test) depending on the specificity of the different groups of PBMC transcripts ([C] – control, [M0] – before the first one dose of the drug, [M1] – before the next doses of the drug after 3 months – I monitoring), FC ≥ 2.0
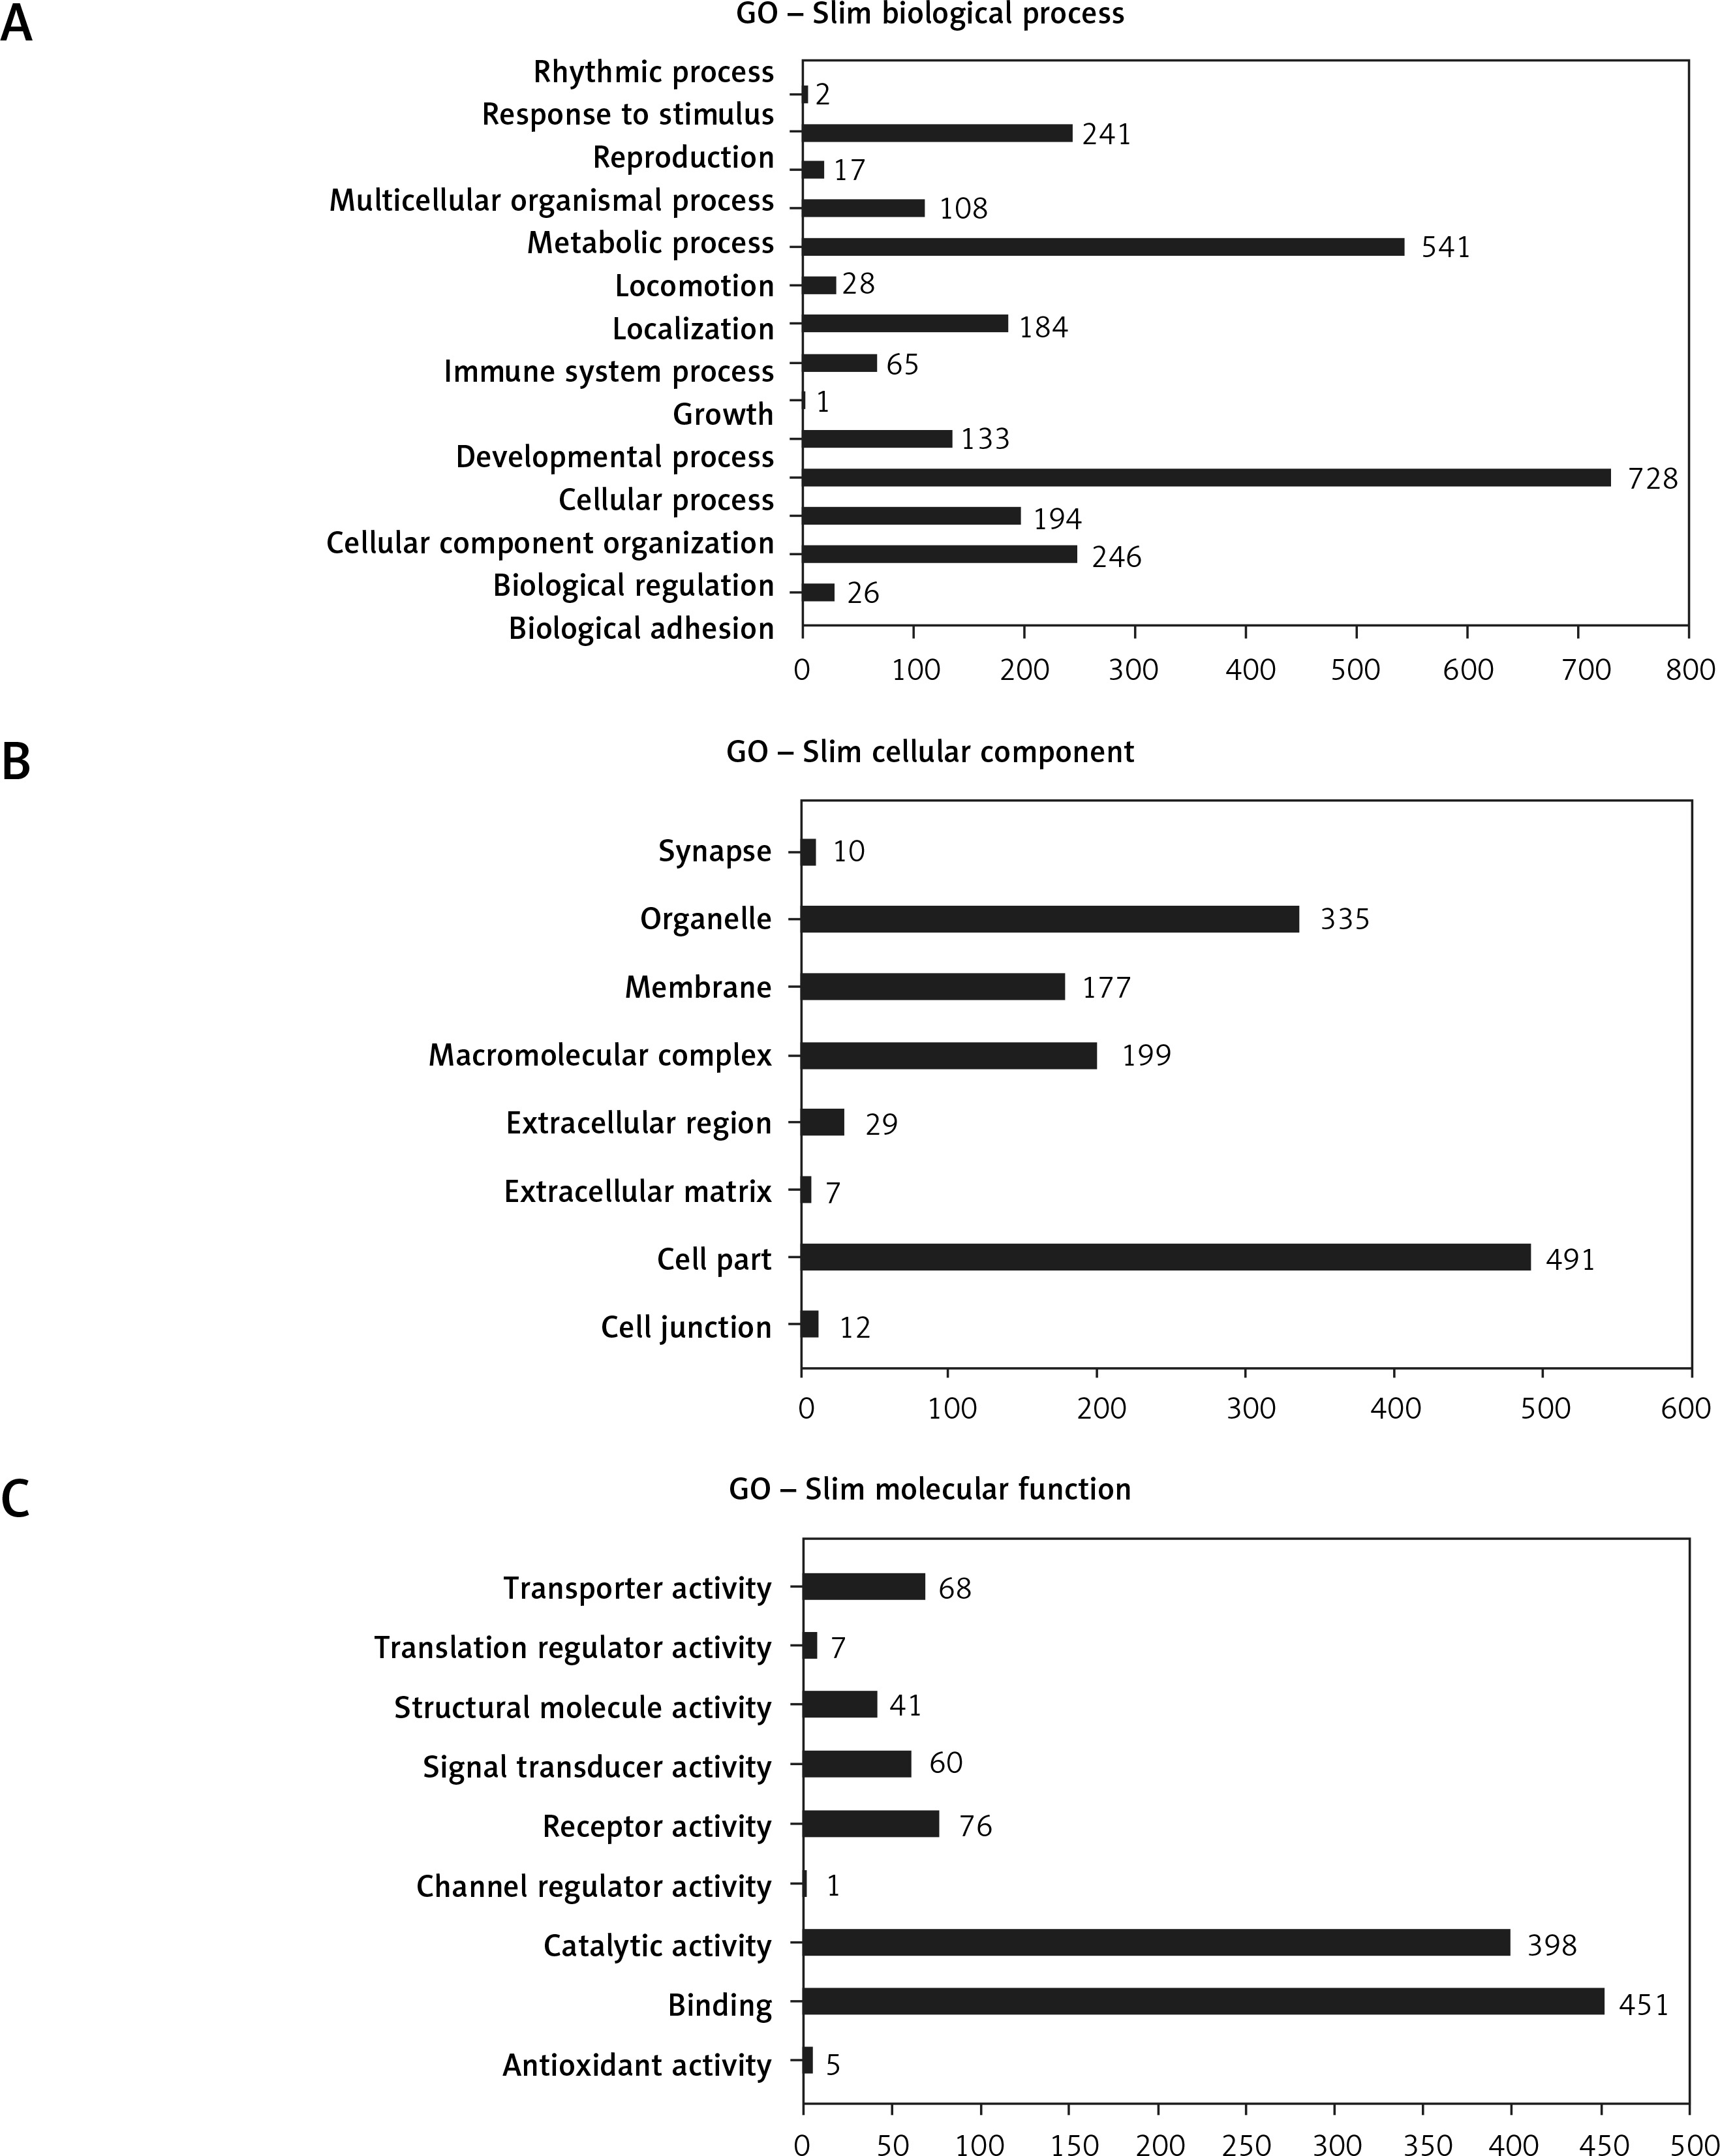
Gene Ontology analysis showed 14 subgroups of differentiating genes which are related to biological processes (p < 0.05) (Figure 2 A). Then 8 subgroups of differentiating genes were determined based on their cellular components (Figure 2 B), 9 subgroups that were associated with molecular functions (Figure 2 C), 23 subgroups that were associated with protein classes and 113 subgroups that were derived from the signaling pathways.
Figure 2
Subgroups of the differentiating genes associated with biological processes (A), cellular components (B), molecular functions (C), selected using the Panther 13.1 program (p < 0.05; PANTHER – Protein Analysis Through Evolutionary Relationships)
GO Slim – only a subset of GO (gene ontology) terms.
The categories that were overrepresented were determined by comparing the tested genes to the National Center for Biotechnology Information reference list of the human genome using the PANTHER program (Table IV).
Table IV
Over-demonstration categories with the genes that were predicted using Bonferroni’s binomial test (PANTHER 13.1).
The PANTHER analysis showed that the genes that were expressed in at least one pair were involved in the molecular pathways, including inflammation that is mediated by the chemokine and cytokine signaling pathways (39 genes), the Wnt signaling pathway (22 genes), the gonadotropin-releasing hormone receptor pathway (27 genes), the cholecystokinin receptor (CCKR) signaling map (18 genes), the integrin signaling pathway (17 genes), the interleukin signaling pathway (17 genes), the platelet-derived growth factor (PDGF) signaling pathway (16 genes), angiogenesis (16 genes), the fibroblast growth factor (FGF) signaling pathway (14 genes), the heterotrimeric G-protein signaling pathway-Gi alpha and the Gs alpha-mediated pathways (14 genes), the apoptosis signaling pathway (12 genes), the epidermal growth factor (EGF) receptor signaling pathway (12 genes), the Huntington disease signaling pathway (12 genes), Parkinson disease (12 genes), the p53 pathway (11 genes), the Alzheimer disease-presenilin signaling pathway (10 genes), the muscarinic acetylcholine receptor 2 and 4 signaling pathway (10 genes) and the nicotinic acetylcholine receptor signaling pathway (10 genes).
In turn, the molecular pathways in which the gene expression was silenced in at least one pair were involved in inflammation that was mediated by the chemokine and cytokine signaling pathways (41 genes), the gonadotropin-releasing hormone receptor pathway (38 genes), the Wnt signaling pathway (32 genes), the PDGF signaling pathway (30 genes), the CCGR signaling pathway (29 genes), the CCKR signaling map (26 genes), angiogenesis (26 genes), the Huntington disease signaling pathway (24 genes), the FGF signaling pathway (22 genes), the EGF receptor signaling pathway (20 genes), the T-cell activation signaling pathway (20 genes), the Parkinson disease signaling pathway (17 genes), the B-cell activation signaling pathway (16 genes), the endothelin signaling pathway (16 genes), the interleukin signaling pathway (16 genes), the vascular endothelial growth factor (VEGF) signaling pathway (16 genes), the Alzheimer disease-pathogen signaling pathway (12 genes), the angiotensin II-stimulated signaling pathway through G proteins and beta-arrestin (11 genes), the Ras signaling pathway (11 genes), the heterotrimeric G-protein signaling pathway-Gi alpha and Gs alpha-mediated pathways (11 genes), cytoskeletal regulation by Rho GTPase (10 genes), the heterotrimeric G-protein signaling pathway-Gq alpha and Go alpha-mediated pathways (10 genes), the nicotinic acetylcholine receptor signaling pathway (10 genes) and the p53 signaling pathway (10 genes).
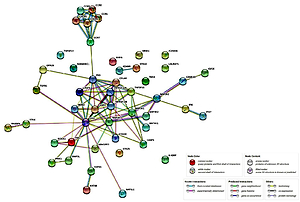
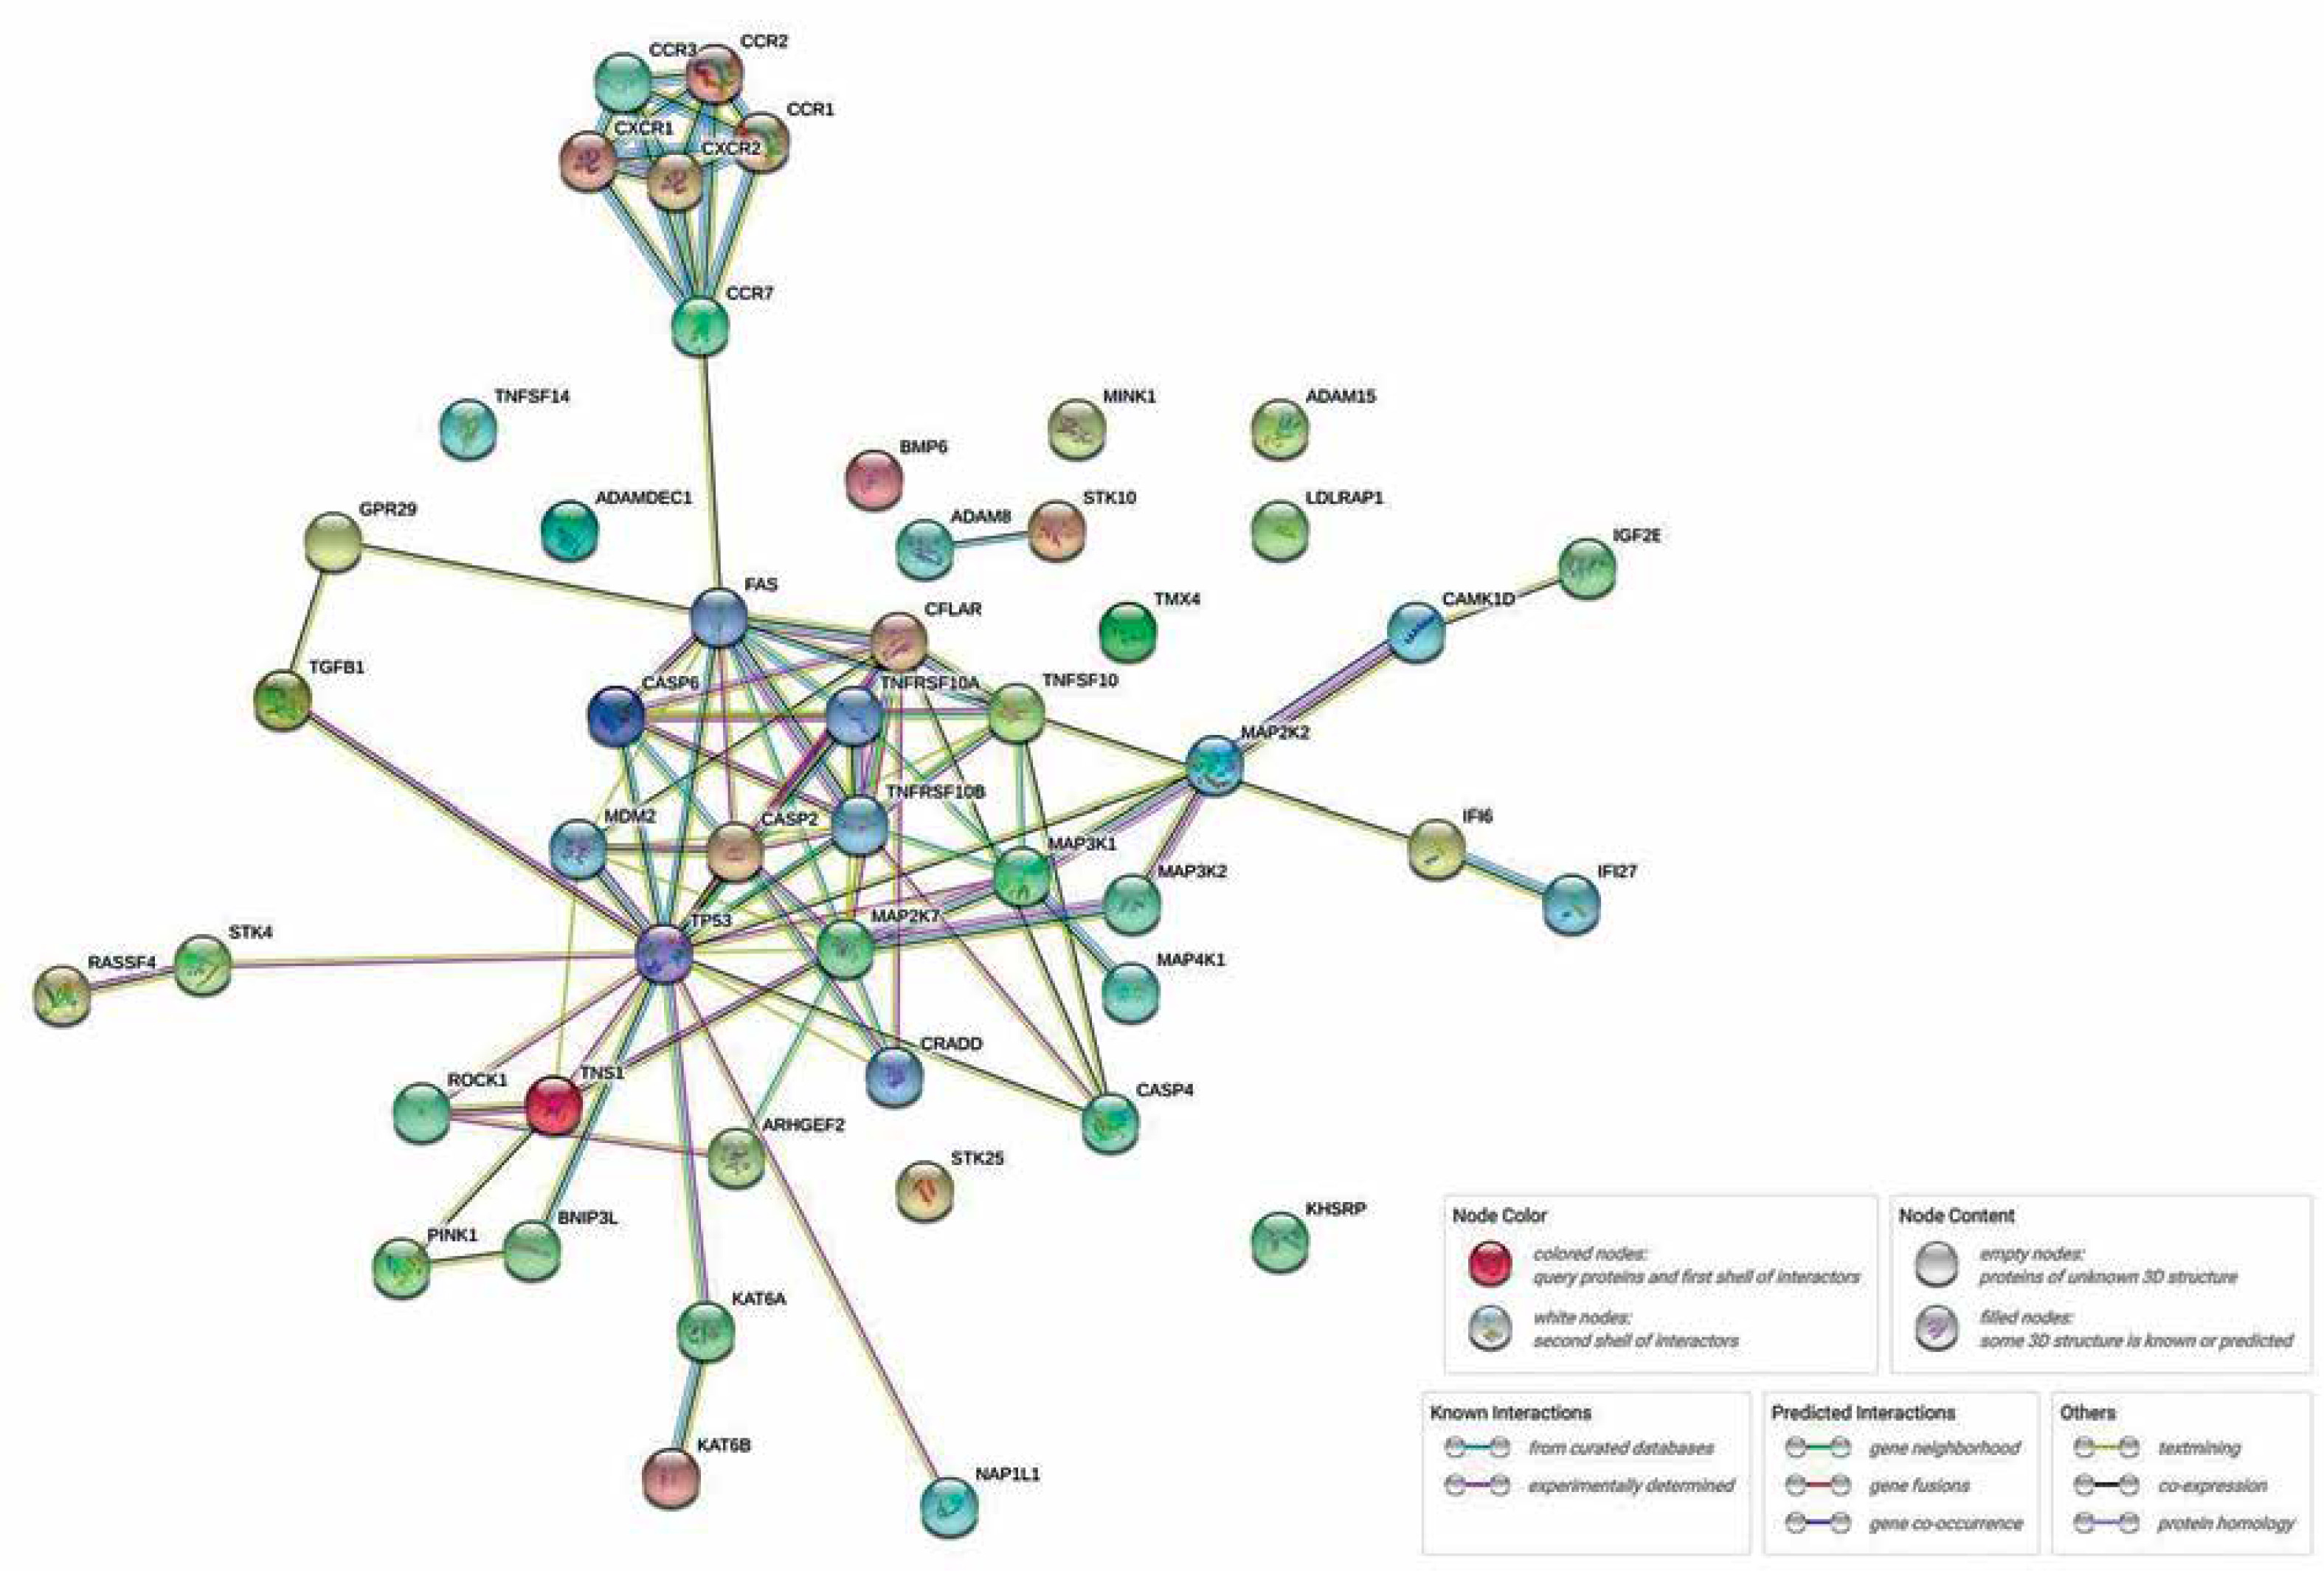
Among the overrepresented categories that were selected using Bonferroni’s binomial test is one of the key processes for the development of psoriasis, which is apoptosis. This process conditions the maintenance of homeostasis within the epidermis, as well as the functioning of the immune system. Forty-four genes associated with this process were selected. In the next stage, the relationships between previously selected genes in the STRING database were investigated. Figure 3 shows the complexity of the apoptosis pathways and the proportion of a large number of genes in the presented process during anti-TNF therapy. We discovered a relationship between the gene encoding the FAS protein and the group of chemokines. A rather interesting relationship was also observed between the TP53 protein and other proteins – mainly ROCK1, which is involved in the cytoskeleton organization, or proteins from the BCL2 family (BNIP3).
Figure 3
Relationships between genes associated with the process of apoptosis in patients with psoriatic arthritis (after overrepresentativity test; STRING database)
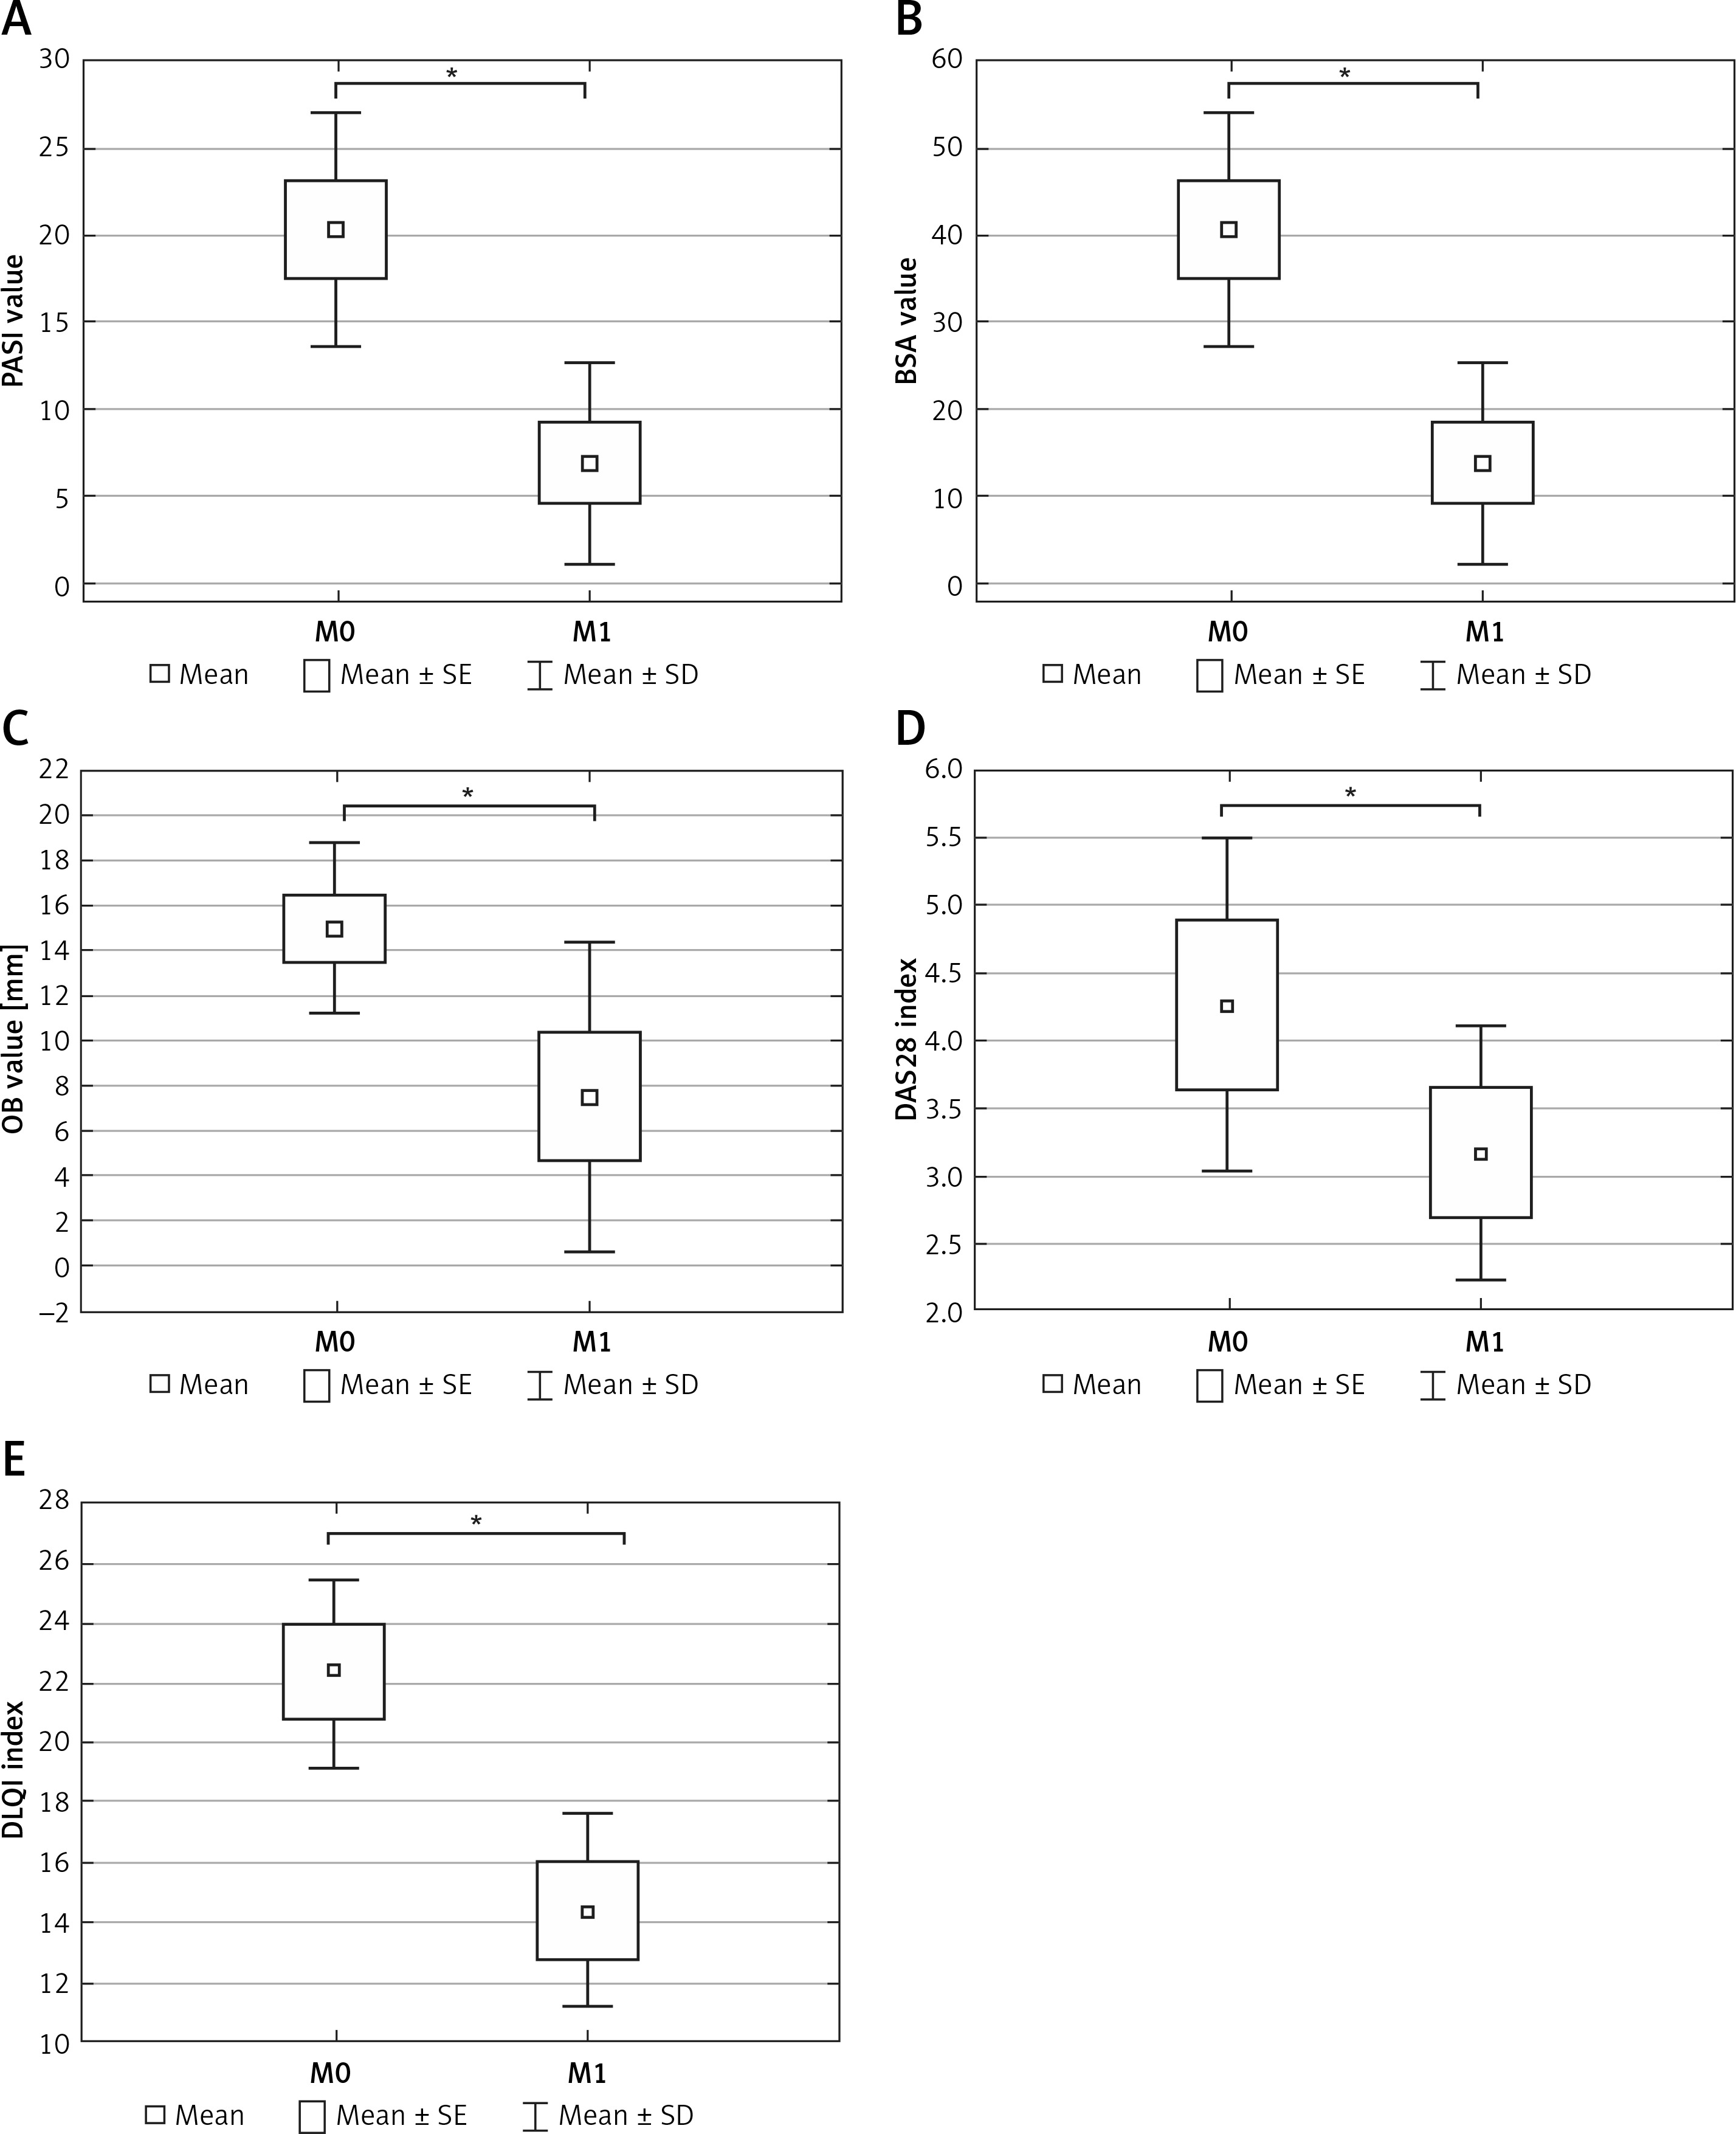
In this study, we found a statistically significant decrease in the PASI dermatological indexes (on average by 13.42 ±5.18) (Figure 4 A) and BSA (on average by 24.66 ±15.95) (Figure 4 B). The OB parameter was also lower (on average by 7.5 ±5.00) (Figure 4 C), as was the DLQI index (on average by 8.00 ±1.93) (Figure 4 D). In addition, a decrease in the DAS28 index (on average by 1.10 ±2.58) indicated an improvement in the clinical condition of the patients regarding joints (Figure 4 E).
Figure 4
Changes in the patients with psoriatic arthritis that were treated with adalimumab: in the PASI index (A), BSA [%] (B), OB parameter (C), DAS28 index (D), DLQI index (E) before the first dose [M1] and prior to the administration of subsequent doses after 3 months of I-monitoring [M0]. Box and whisker plots present the mean ± SE and SD of the indicator values. Statistical significance: *p < 0.05, paired t test
SE – standard error, SD – standard deviation.
Discussion
The efficacy of adalimumab in the treatment of psoriatic arthritis is relatively well understood [32]. However, it is quite important to investigate the systemic effects of the subcutaneous administration of adalimumab based on analysis of gene expression. Therefore, our study focused on the changes in gene expression in the PBMCs of patients with psoriatic arthritis who were treated with a pre-dose of adalimumab and the control group. In addition, we presented an analysis of the clinical effects of administration of a pre-dose to patients with psoriatic arthritis in relation to their condition before the first dose of the drug.
Given the fact that the etiology of psoriasis is not fully understood, any reports that indicate the mechanisms that may affect its development are of interest. Of particular value are the studies that depict the molecular basis of this disease. In a study using oligonucleotide microarray technology, Chow et al. observed a statistically significant change in the expression level of 79 genes in the blood. The study suggested that the effects of adalimumab were related to immune changes in the blood [33]. In addition, this experience permitted the observation of differences in the modulation of different pathways in two systems – in the skin and in the blood (PBMCs) – which is certainly the substantive value of the study.
We found that anti-TNF therapy has a significant influence on the changes in gene expression that are associated with T-cell activation markers, which is partly consistent with previous studies [34].
Analysis by Dolcino et al. [35] of gene ontologies in ankylosing spondylitis patients undergoing treatment with adalimumab showed that a large number of altered transcripts were involved in biological processes that might play an important role in the development of the disease. These findings are consistent with our observations in the aspect of biological processes and pathways such as the immune response (CD4, IMD17, TNFSF8, STAT5B and STAT1), the T-cell receptor signaling pathway (IMD18 and LCK), the Jak-Stat signaling pathway (STAT1) and transforming growth factor beta signaling (TGFβ1).
We observed significant changes in the transcriptional activity of the genes associated with the apoptosis process as a result of the analysis of the genomic profile of gene expression and classification according to the functions that were performed. This process plays one of the key roles in the course of the disease. In the case of psoriatic arthritis, apoptosis disorder causes the destruction of articular cartilage, leading to bone erosion [36].
Many mechanisms lie at the root of this process. According to the literature, in the case of psoriasis manifested by joint dysfunctions, cytochrome c is released into the extracellular space and finally into the circulation. Moreover, cytochrome c levels in the serum become elevated [37].
In this study, the PANTHER program selected other molecular pathways that were involved in the course of this disease – particularly the chemokine and cytokine signaling pathways and activation of B cells and T cells. In the study by Goldminz et al. on the effects of two therapeutic strategies (methotrexate and adalimumab) on the expression of patients’ genes, downregulation of helper T-cell-related mRNA expression (methotrexate responders and nondrug responders) was observed. There were no statistically significant changes in expression in the methotrexate responders compared to those who responded to adalimumab (16 weeks of treatment). In addition, early reduction in expression of chemokine ligand 20 was observed in patients who responded to adalimumab compared to late downregulation in patients who responded to methotrexate [38].
Moreover, our analysis of the STRING database showed significant relationships between FAS genes and a group of chemokines, which may confirm the scientific reports on the participation of these genes in the course of psoriatic arthritis [39, 40].
The FAS/FAS ligand system plays a role in the apoptosis of immune cells by removing autoreactive lymphocytes by FAS. This system also has an impact on the development of comorbidities (metabolic syndrome) such as diabetes, overweight or hypertension [41]. Inhibition of the FAS ligand has been shown to prevent cell apoptosis [42]. In psoriasis, there is inflammatory infiltration due to T lymphocytes; more than 90% contain the CCR10 receptor to which the CCL27 chemokine binds. It has also been shown that patients with psoriatic dermatitis have an increase in the level of the chemokine CXCL8 [43]. Another relationship we observed is between BCL2 family proteins and TP53 protein, which is consistent with the observation of Moorchung et al. [44].
Many new studies have discussed the aspect of apoptosis in psoriatic arthritis; however, most of the research was carried out on clinical material that had been collected from the patients (epidermal scales) [45, 46] or on epidermal or skin cell cultures [47, 48]. In a study carried out on fibroblast cell cultures treated with adalimumab for 2, 8 and 24 h, statistically significant changes were observed in the expression of caspases – protease enzymes, which after activation by apoptosis signals degraded cellular proteins [47].
In the case of psoriasis, the effectiveness of a treatment is indicated by the dermatological indexes that reflect the clinical condition of the patient. The most commonly used indicators are PASI and BSA. In the course of the pilot study of patients with psoriatic arthritis who had been treated with adalimumab, a significant improvement in the clinical condition was observed as was evidenced by a decrease in the psoriatic lesions. This is reflected in the statistically significant decrease in the values of PASI (13.42 ±5.18) and BSA (%) (24.66 ±15.95).
A similar trend to our work was noted in the Outcome of Psoriatic Patients Switched to Adalimumab (OPPSA) study, whose aim was to assess the effect of adalimumab on the remission of changes in patients who had previously been treated with another biological drug (ustekinumab). Therefore, the PASI values were determined at the beginning of the study and after 3, 6, 12, 24 and 36 months following the administration of the drug. There was a decrease in the PASI value (15.1 ±6.2, p < 0.001), which is consistent with our findings [49].
Statistically significant changes in PASI and BSA were also recorded in a study by Tichy et al. [50] involving 66 patients who were treated systemically. The patients, who had been divided into three groups, underwent various types of treatment, including adalimumab treatment. In this group, the PASI index decreased after 12 weeks (3 months) on average by 69.8%, while the BSA value decreased by 74.4%, which is in line with with our results.
Remission of psoriasis in relation to joints using the DAS28 index has been defined in patients with rheumatoid arthritis treated with adalimumab. In a study by Breedveld et al. [51], the remission of lesions was noted in 25% of the patients during the 2-year follow-up period. In the same study, remission was recorded in 49% of the patients as a result of adalimumab and methotrexate therapy.
In addition, after a 2-year follow-up of patients undergoing etanercept therapy (an anti-TNF drug), remission of symptoms was reported in almost 30% of patients with rheumatoid arthritis. In this case, etanercept and methotrexate therapy resulted in remission of lesions in 53.7% of the patients [52]. In addition, etanercept has shown normalized properties against inflammation in animal studies (rats) [53].
Due to the fact that the clinical condition of patients with psoriasis is closely related to the apoptotic process, it can be assumed that even a partial normalization of this process is reflected in the improvement of the symptoms. This situation is associated with the improvement of epidermal cell function, which results in the reduction of psoriatic lesions. Therefore, the drop in the value of dermatological indicators that was observed in our study after 3 months of treatment with adalimumab may be related to the significant changes that were observed in gene expression that were associated with the process of apoptosis in individual groups of patients.
The limitation of our study is the relatively small number of the samples, although it should be noted that this is a pilot research study. In addition, we monitored the effects at the individual stages of the treatment and included data showing the therapeutic effects after the first stage of treatment – that is, after the first monitoring session (3 months after the first dose of the biological medicine). Already, at this stage, the data presented constitute a valuable basis for conducting additional research aimed at final confirmation of the results. The authors of this study have collected data during several years of observations of patients undergoing treatment with adalimumab, which will be presented in subsequent studies that will comprise a series of thematic publications.