Introduction
Inflammatory bowel disease (IBD) is a group of chronic inflammatory diseases of the gastrointestinal tract subject to periods of exacerbation and remission. Crohn’s disease (CD) and ulcerative colitis (UC) are included in this group of diseases. Peak incidence falls between the ages of 15 and 25. The etiology of the disease is not fully known, and many potentially significant factors – environmental, immunological, and genetic – are currently being studied [1, 2]. Among immunological factors, cytokines deserve the most attention. Monocytes and activated macrophages (i.e. the sources of interleukin) increase in number, thus initiating and sustaining the inflammatory state in patients with mucosal changes in the gastrointestinal tract. Such cytokines include interleukin-1α (IL-1α); interleukin-1β (IL-1β); interleukin-2 (IL-2); interleukin-6 (IL-6); interleukin-8 (IL-8); interleukin-12 (IL-12); interleukin-17 (IL-17); interleukin-23 (IL-23); tumor necrosis factor (TNF); and interferon (IFN). The following cytokines also play a significant role in the etiology of IBD by decreasing the inflammatory response: interleukin-4 (IL-4); interleukin-10 (IL-10); and interleukin-13 (IL-13). In CD, the dominating population is the population of Th1 lymphocytes releasing TNF, IFN, IL-2, IL-6, IL-8, as well as those supporting the cellular response [3]. In ulcerative colitis, Th1 and Th2 lymphocytes are activated, which release IL-4, IL-5, IL-10, and TNF as well as those cytokines determining the humoral immune response [4]. Interleukin-17 is produced by the activated T lymphocytes. It suppresses the increase of Th2 lymphocytes, and potentiates the inflammatory process through the production of proinflammatory cytokines. Increased concentration of IL-17 in patients’ serum and gastrointestinal mucosa is associated with a response toward a locally ongoing inflammatory process [5–7]. Inflammatory changes throughout the course of CD may involve the entire gastrointestinal tract from the mouth to the anus, including all layers of the wall, whereas inflammatory changes in patients with UC involve only the mucosal layer.
According to the Montreal classification, three forms of UC can be distinguished depending on the extent of inflammatory changes (Table I) [8].
Table I
Montreal classification of ulcerative colitis (UC) according to the extent of the disease
The severity of UC is also evaluated according to the Montreal classification (Table II) [8].
Table II
Montreal classification of ulcerative colitis according to the severity of exacerbation
Table III shows the Montreal classification of CD according to age at the time of diagnosis, localization, and the course of the disease [8].
Table III
Montreal classification of Crohn’s disease
| Age at the time of diagnosis | A1 | Up to 16 years old |
| A2 | 17–40 years old | |
| A3 | > 40 years old | |
| Localization | L1 | Small intestine |
| L2 | Colon | |
| L3 | Small intestine and colon | |
| L4* | Isolated upper gastrointestinal tract involvement | |
| Disease course | B1 | Without strictures or fistulas |
| B2 | With strictures | |
| B3 | With fistulas | |
| P** | Perianal involvement |
Vitamin D plays the role of a prohormone in the body, as its active form results from metabolic changes. The main sources of vitamin D for most humans are the diet and casual exposure of the skin to solar ultraviolet B (UVB; 290–315 nm) radiation [9]. Research in Poland shows that close to 70% of the country’s population suffers from vitamin D deficiency [10–13]. It is estimated that 22–70% of patients with CD, and around 45% of patients with UC, have a vitamin D deficiency [14–18]. Decreased exposure to sunlight [19], inadequate diet, inflammatory changes of the intestinal mucosa, and patient states after gastrointestinal surgical resections have been postulated as the main causes of vitamin D deficiency throughout the course of IBD [20, 21]. Aside from helping regulate calcium-phosphate economy and bone metabolism, vitamin D plays a crucial role in the regulatory function of the immunological system, contributing to the activation and proliferation of lymphocytes, differentiation of Th lymphocytes, and production of antibodies [22]. Vitamin D stimulates the innate and humoral response of the body. 1,25(OH)2D influences the transition of Th1 lymphocytes (secreting IL-2, INF-γ), as well as Th17 (secreting IL-17 and IL-21) in the direction of Th2 lymphocytes, thus simultaneously increasing the secretion of IL-4 with anti-inflammatory properties. The best marker for the body’s supply of vitamin D is 25(OH)D, on the basis of which the following categories of supply of vitamin D were designated: deficiency 0–20 ng/ml, suboptimal concentration > 20–30 ng/ml, optimal concentration > 30–50 ng/ml, high concentration > 50–100 ng/ml, potentially toxic concentration > 100 ng/ml, toxic level > 200 ng/ml [23].
Interleukin-17 (also defined as IL-17A) was discovered in 1995. Since then, six cytokines from the IL-17 family have been described (IL-17A, IL-17B, IL-17C, IL-17D, IL-17E, IL-17F), each with different functions and produced by different types of cells. Interleukin-17 is a proinflammatory cytokine produced by activated CD4 lymphocytes whose receptor is present in many cell types. Interleukin-17 has a pleiotropic effect on many cell types, including neutrophils, macrophages, fibroblasts, endothelial, and mesothelial cells. IL-17 plays a mediating role in the inflammatory response as a consequence of T lymphocyte activation. This process is regulated by IL-23, and the IL-17/IL-23 axis plays an important role in the pathogenesis of IBD.
Osteopenia and osteoporosis constitute a significant medical problem among patients with inflammatory bowel diseases [24]. According to the World Health Organization (WHO), essential for diagnosis is determination of bone mineral density (BMD) in the lumbar (L) region of the spine and the proximal femoral neck (FN) using the DXA method (dual energy X-ray absorptiometry, previously DEXA). Diagnosis is made on the basis of the T-score expressed as a standard deviation number, where the reference point is peak bone mass (T-score > –1 SD – normal value, T-score from –1 to –2.5 SD – osteopenia, T-score < –2.5 SD – osteoporosis). Bone mass loss in patients with CD and UC has many causes, including absorption disturbances, malnutrition, and the inflammatory process itself. There is an increase in proinflammatory cytokines (for example IL-17), which activate osteoclasts and stimulate osteoblast apoptosis, thus leading to loss of bone mass.
The aim of this research was to determine the relationship of vitamin D levels, IL-17, and bone mineral density with localization of inflammatory changes in the gastrointestinal tract, as well as intensity of the development of the disease in patients also suffering from inflammatory bowel disease.
Material and methods
The research sample consisted of 208 persons, including 83 patients (43 men and 40 women) with CD, 86 patients (38 men and 48 women) with UC, and 39 persons (20 men and 19 women) in the control group. The inclusion criteria were: inflammatory bowel disease diagnosed based on endoscopic, histopathological, and radiologic studies; age 18 and above; and consent to take part in the study. The exclusion criteria were: age below 18; pregnancy; concomitant diseases which might have an effect on bone mineral density (chronic kidney disease, active cancer, liver insufficiency, thyroid diseases, rheumatoid arthritis, chronic obstructive pulmonary disease (COPD), celiac disease); and lack of consent to take part in the study.
Clinical data were collected on: mineral bone density of the lumbar spine (L2–L4); mineral bone density of the femoral neck (FN); weight; height; and the age at the time of densitometry. Densitometry studies were performed using the DXA method, with a DPX-Plus camera by Lunar. 25OHD (a marker of vitamin D status in the body) concentration was measured in patients’ serum using the electrochemiluminescent binding method test and the Cobas e 601 analyzer (by Roche). According to the procedure specified by the manufacturer, the concentration of IL-17 was measured by means of a monoclonal antibody test using an immunoenzymatic method (enzyme-linked immunosorbent assay – ELISA) and a sandwich enzyme immunoassay (sandwich ELISA). Concentration of IL-17 in the serum was measured using the ELISA test by R&D Systems (USA) and the Sunrise microplatelet factor by Tecan Group Ltd. (Switzerland), with a respective analytical sensitivity of 15 pg/ml. Inside-serial and inter-serial variability coefficients were calculated at 5.8% and 6.1%. Patients were classified into subgroups according to the Montreal classification on the basis of interviews.
Ethical approval
The study subjects included inflammatory bowel disease (IBD) patients from the Clinic of Gastroenterology, Human Nutrition and Internal Diseases of Poznan University of Medical Sciences (Poznan, Poland), and 41 healthy volunteers without IBD All patients gave their written consent to participate in the genetic testing and the study was approved by the Bioethical Committee of Poznan University of Medical Sciences (Poznan, Poland; approval no. 92/09).
Statistical analysis
Statistical analysis was performed with Statistica software, version 12.0. Normality dispersion was first checked using the Shapiro-Wilk test, and variation homogeneity in the subgroups using Levene’s test. Because these conditions were fairly frequently compromised, and because of the big differences in group size, the groups were compared using the nonparametric Kruskal-Wallis test. If the Kruskal-Wallis test yielded a significant result, further post hoc analysis was performed using Dunn’s test. If a statistically significant result was obtained, as a measure of effect size for the Kruskal-Wallis test, a eta-squared (η2) – presented by Cohen (2008) – was calculated [25]. Eta-squared concerned the proportion of variability of the dependent variable, which is explained by the between-group effect. In the case of a correlation between two groups of patients with regard to disease duration and the number of exacerbations, the Mann-Whitney test was performed. Pearson and Spearman coefficients were used for the correlation analysis if the normality dispersion condition was fulfilled. P < 0.05 was accepted as the significance level.
Results
Characteristics of the groups are shown in Table IV.
Table IV
Characteristics and clinical parameters of the researched groups
| Parameter | CD patients (n = 83) | UC patients (n = 86) | Controls (n = 39) | P-value |
|---|---|---|---|---|
| Age [years] | 35.02 ±11.991 | 39.58 ±14.74 | 30.74 ±8.63 | ***< 0.01 |
| Weight [kg] | 63.83 ±14.15 | 68.21 ±14.91 | 73.62 ±13.65 | **< 0.01 |
| Height [cm] | 171.64 ±10.23 | 170.74 ±9.73 | 172.69 ±9.35 | NS |
| BMI [kg/m2] | 21.51 ±3.68 | 23.31 ±4.38 | 24.57 ±3.45 | *< 0.01 **< 0.001 |
| L2–L4 BMD [g/cm2] | 1.12 ±0.18 | 1.16 ±0.14 | 1.22 ±0.08 | **< 0.001 ***< 0.05 |
| L2–L4 T-score | –0.83 ±1.45 | –0.47 ±1.15 | 0.09 ±0.70 | **< 0.001 *** < 0.05 |
| L2–L4 Z-score | –0.45 ±1.29 | –0.17 ±1.17 | 0.09 ±0.66 | **< 0.05 |
| FN BMD [g/cm2] | 0.95 ±0.17 | 0.98 ±0.15 | 1.07 ±0.16 | **< 0.001 ***< 0.05 |
| FN T-score | –0.62 ±1.26 | –0.29 ±1.17 | 0.41 ±1.03 | **< 0.001 ***< 0.01 |
| FN Z-score | –0.26 ±1.09 | 0.09 ±1.05 | 0.38 ±0.99 | **< 0.01 |
| 25-OHD [ng/ml] | 21.33 ±12.50 | 22.04 ±9.56 | 21.56 ±9.11 | NS |
| IL-17 [pg/ml] | 8.55 ±10.90 | 11.67 ±12.97 | 5.16 ±2.00 | NS |
There were significant age differences between the three groups studied (p < 0.01, η2 = 0.041). Comparative analysis revealed that the patients with UC were older than the individuals from the control group (p < 0.01). There were also significant differences in body mass between the groups (p < 0.01, η2 = 0.044). Detailed comparisons showed that members of the control group had a significantly higher body mass than the patients with CD (p < 0.01). The groups also had significantly different body mass index (BMI) values (p < 0.001, η2 = 0.083). A multiple comparison analysis showed statistically significant differences in BMI between CD and UC patients (p < 0.01), and CD patients and the control group (p < 0.001). The three groups were significantly different in terms of lumbar spine (L2–L4) bone mineral density (p < 0.01, η2 = 0.057). Further analyses revealed that the control group had significantly higher BMD values than the patients with CD (p < 0.001) and UC (p < 0.05). We found statistically significant differences in L2–L4 spine T-scores (SD) between the three groups (p < 0.001, η2 = 0.070). Multiple comparison analysis showed statistically significant differences between CD patients and the control group (p < 0.001), and between UC patients and the control group (p < 0.05). There were also significant differences in the L2–L4 spine Z-scores (SD) between the groups (p < 0.05, η2 = 0.024). Detailed comparisons showed that Z-scores for CD patients were significantly different from those of persons in the control group (p < 0.05). Significant differences in femoral neck (FN) bone mineral density were also found between the three groups (p < 0.001, η2 = 0.060). Multiple comparison analysis revealed that this parameter was lower in CD and UC patients than in the control group (p < 0.001 and < 0.05, respectively). Femoral neck T-scores (SD) were also significantly different between the three groups (p < 0.001, η2 = 0.085). Detailed comparisons revealed that patients with CD and UC differed significantly from persons in the control group (p < 0.001 and p < 0.01, respectively). Furthermore, we found statistically significant differences in FN Z-scores (SD) between the three groups (p < 0.01, η2 = 0.0.41). Multiple comparison analysis showed a significant difference in this parameter between CD patients and the control group (p < 0.01). We did not find statistically significant differences in vitamin D or IL-17 concentrations between the three groups. Patients with CD and UC did not differ with regard to disease duration. Crohn’s disease patients had a higher number of disease exacerbations than patients with UC (p < 0.01).
In the group of patients with CD 53.01% had normal bone mineral density in the lumbar region of the spine, 37.35% had osteopenia, and 9.64% had osteoporosis. Analogously, in the group of patients with UC 63.95% had normal bone mineral density in the lumbar region of the spine, 33.72% had osteopenia and 2.33% had osteoporosis. In the group of patients with CD 59.04% had normal bone mineral density in the femoral neck region, 34.94% had osteopenia, and 6.02% had osteoporosis. Analogously, in the group of patients with UC 70.93% had normal bone mineral density in the femoral neck region, 27.91% had osteopenia, and 1.16% had osteoporosis.
In the studied groups the vitamin D supply was characterized as follows: patients with CD: deficit – 50.60%, suboptimal concentration – 31.33%, optimal concentration – 15.66%, high concentration – 2.41%; patients with UC: deficit – 46.51%, suboptimal concentration – 33.72%, optimal concentration – 18.60%, high concentration – 1.16%; control group: deficit – 48.72%, suboptimal concentration – 35.90%, optimal concentration – 12.82%, high concentration – 2.56%.
We noted a statistically significant correlation between IL-17 and body mass (r = 0.21; p < 0.01). In the other cases, correlations did not achieve the level of statistical significance, namely 0.05. In the control group (CG), statistically significant correlations were noted between IL-17 and L2-L4 Z-score (SD) (r = –0.34; p < 0.05), and FN BMD (r = 0.36; p < 0.05). In the group of patients with UC, statistically significant correlations were found between IL-17 and body mass (r = 0.27; p < 0.05), and between IL-17 and vitamin D levels (r = –0.22; p < 0.05). In the group of patients with CD, no statistically significant correlations were found between IL-17 and the other variables. Aside from the above-mentioned correlations with IL-17, no statistically significant correlations were noted between vitamin D levels and the variables in the subgroups (CD, UC, CG).
In Table V, the characteristics and clinical parameters of patients with UC are presented according to the Montreal classification, based on the stage of the disease.
Table V
Characteristics and clinical parameters of patients with ulcerative colitis presented according to the Montreal classification, based on the extent of the disease
| Parameter | E1 (n = 33) | E2 (n = 31) | E3 (n = 22) | P-value |
|---|---|---|---|---|
| Age [years] | 38.79 ±15.421 | 41.13 ±13.60 | 38.59 ±15.72 | NS |
| Weight [kg] | 69.30 ±12.69 | 68.19 ±15.96 | 66.59 ±16.91 | NS |
| Height [cm] | 170.12 ±9.65 | 170.68 ±9.78 | 171.77 ±10.12 | NS |
| BMI [kg/m2] | 23.92 ±3.84 | 23.32 ±4.72 | 22.40 ±4.69 | NS |
| L2–L4 BMD [g/cm2] | 1.20 ±0.13 | 1.13 ±0.15 | 1.14 ±0.15 | NS |
| L2–L4 T-score | –0.11 ±1.13 | –0.62 ±1.20 | –0.81 ±1.02 | NS |
| L2–L4 Z-score | 0.19 ±1.14 | –0,34 ±1.22 | –0.48 ±1.07 | NS |
| FN BMD [g/cm2] | 1.03 ±0.17 | 0.95 ±0.13 | 0.96 ±0.12 | NS |
| FN T-score | 0.08 ±1.33 | –0.62 ±1.04 | –0.37 ±0.98 | NS |
| FN Z-score | 0.43 ±1.27 | –0.20 ±0.92 | –0.01 ±0.72 | NS |
| 25-OHD [ng/ml] | 22.52 ±10.94 | 21.42 ±7.54 | 22.19 ±10.29 | NS |
| IL-17 [pg/ml] | 8.83 ±8.10 | 9.51 ±10.18 | 18.96 ±18.91 | NS |
In the patients with UC and different intestinal localizations of inflammatory changes, no statistically significant changes among the variables were noted.
In the group with ulcerative proctitis (E1), a statistically significant negative correlation was seen between IL-17 and vitamin D level (r = –0.44; p < 0.05). In the group with distal involvement of the colon (E2), a statistically significant correlation was noted between IL-17 and body mass (r = 0.46; p < 0.01). In the group with extensive UC (E3), no statistically significant correlations were found between IL-17 and other variables. The rest of the correlations were not statistically significant.
In Table VI, the characteristics and clinical parameters of patients with UC are presented according to the Montreal classification, based on the severity of exacerbation.
Table VI
Characteristics and clinical parameters of patients with ulcerative colitis presented according to the Montreal classification, based on the severity of exacerbation
| Parameter | S0 (n = 13) | S1 (n = 10) | S2 (n = 33) | S3 (n = 30) | P-value |
|---|---|---|---|---|---|
| Age [years] | 45.69 ±12.681 | 42.60 ±14.92 | 37.33 ±15.09 | 38.40 ±14.93 | NS |
| Weight [kg] | 80.15 ±11.37 | 65.38 ±18.51 | 66.61 ±14.97 | 65.73 ±12.98 | *< 0.05 **< 0.05 |
| Height [cm] | 175.31 ±9.33 | 168.20 ±11.19 | 169.61 ±9.74 | 170.87 ±9.20 | NS |
| BMI [kg/m2] | 26.02 ±2.57 | 22.75 ±4.02 | 23.19 ±5.09 | 22.47 ±3.98 | **< 0.05 |
| L2–L4 BMD [g/cm2] | 1.21 ±0.16 | 1.18 ±0.14 | 1.13 ±0.14 | 1.17 ±0.14 | NS |
| L2–L4 T-score | –0.07 ±1.33 | –0.31 ±1.24 | –0.81 ±1.05 | –0.32 ±1.11 | NS |
| L2–L4 Z-score | 0.00 ±1.35 | 0.16 ±1.38 | –0.52 ±1.14 | 0.03 ±1.01 | NS |
| FN BMD [g/cm2] | 1.09 ±0.17 | 0.97 ±0.13 | 0.94 ±0.13 | 0.99 ±0.15 | *< 0.05 |
| FN T-score | 0.38 ±1.25 | –0.35 ±0.96 | –0.56 ±1.00 | –0.26 ±1.31 | NS |
| FN Z-score | 0.74 ±1.16 | 0.24 ±0.93 | –0.23 ±0.91 | 0.12 ±1.09 | *< 0.05 |
| 25-OHD [ng/ml] | 23.03 ±11.44 | 22.77 ±12.37 | 20.23 ±8.41 | 23.35 ±9.07 | NS |
| IL-17 [pg/ml] | 10.40 ±8.58 | 8.71 ±7.57 | 10.84 ±11.71 | 14.12 ±16.82 | NS |
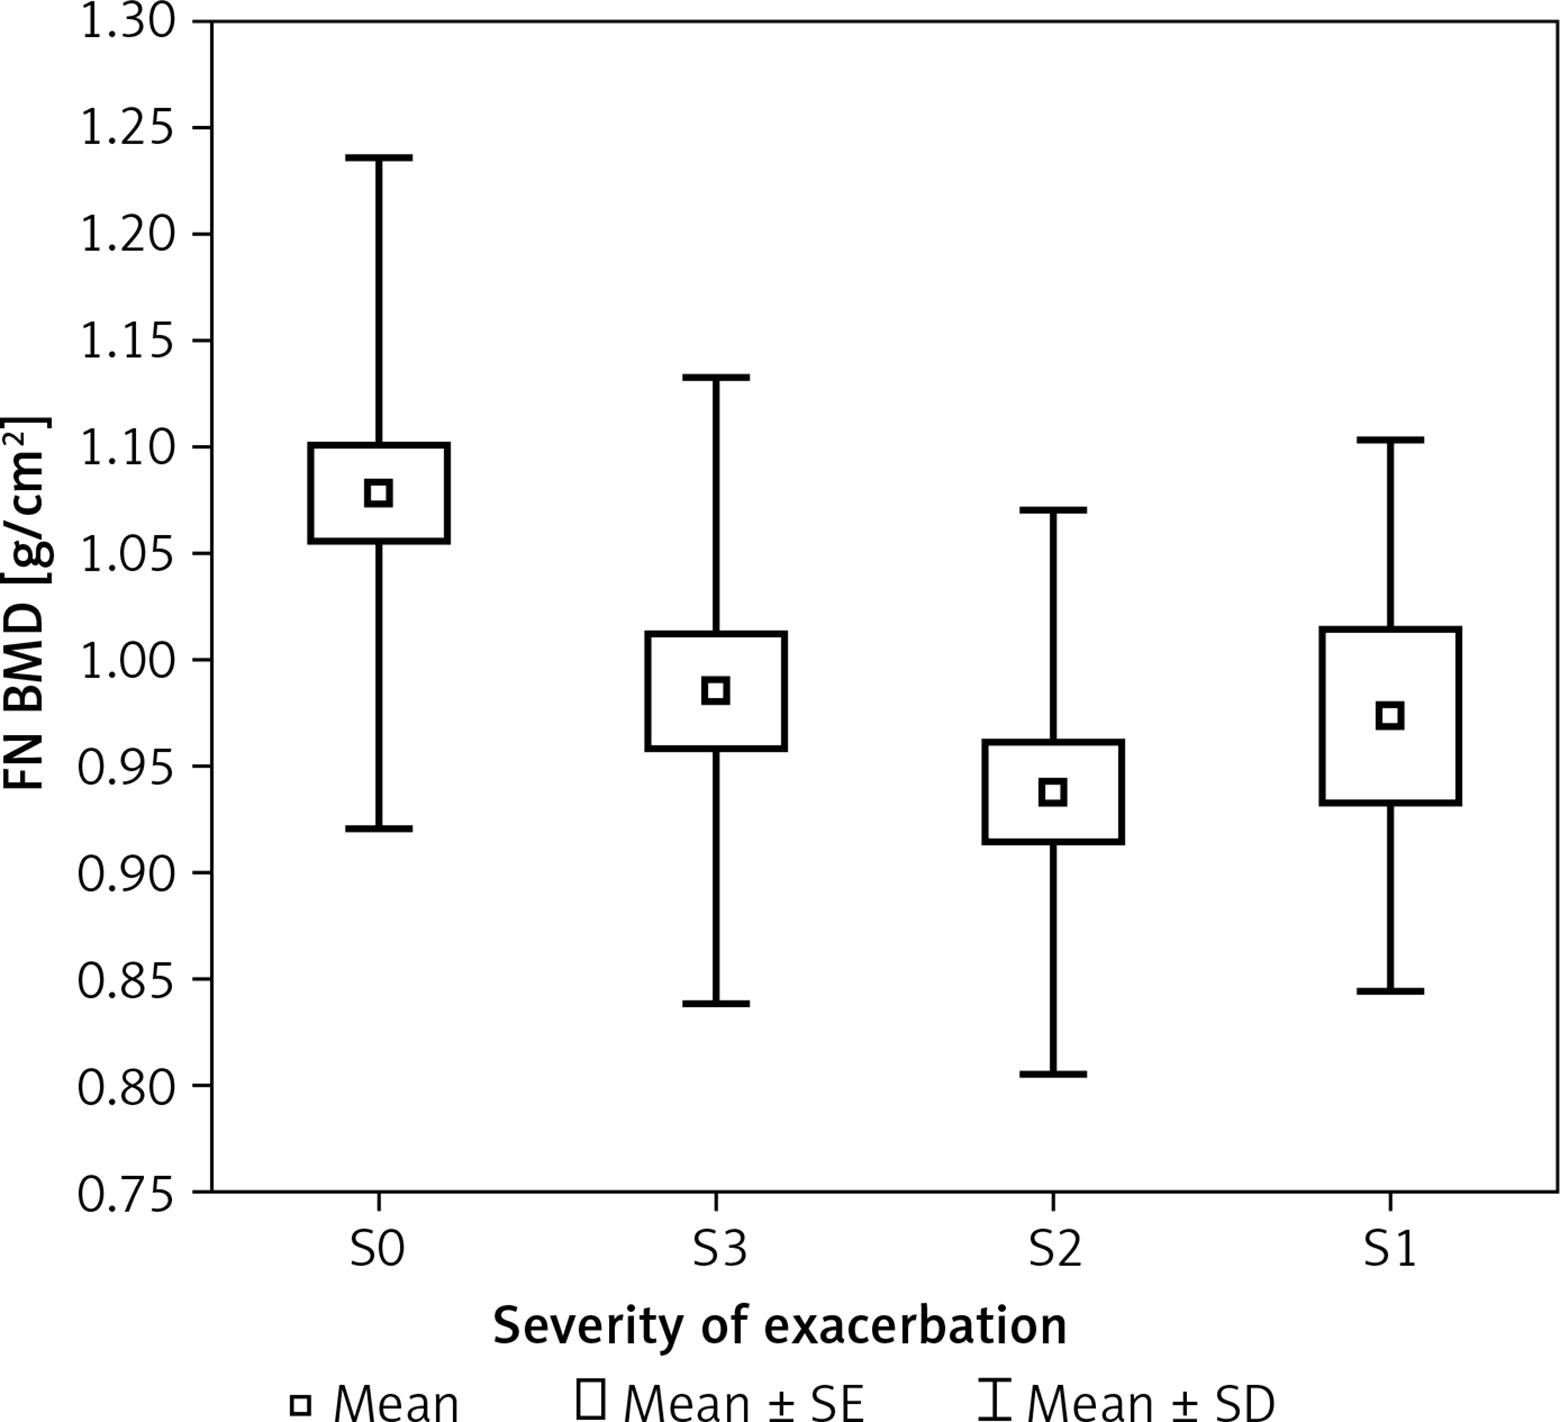
Among groups experiencing various severities of exacerbation, a statistically significant difference was found in body mass (p < 0.05, η2 = 0.090). Detailed comparisons revealed that the patients in clinical remission (S0) had a statistically significantly higher body mass than the patients with severe (S3) (p < 0.05) and moderate exacerbation of the disease (S2) (p < 0.05).
Patients with different severities of clinical symptoms statistically significantly differed in average BMI (p < 0.05, η2 = 0.066). It was found that the patients who were in remission (S0) had a statistically significantly higher BMI than the patients with severe exacerbation of the disease (S3) (p < 0.05). Patients with varying severity of symptoms exhibited statistically significant differences in FN BMD (p < 0.05, η2 = 0.067). Detailed analysis showed that the patients in remission (S0) had a statistically significantly higher BMD than those with moderate exacerbation of disease (S2) (p < 0.05) (Figure 1). Patients with varying severity of symptoms also exhibited a borderline statistically significant difference in FN Z-score (SD) (p = 0.0548, η2 = 0.056). In close comparisons, it was found that the group of patients in remission (S0) had a significantly higher FN Z-score (SD) than those with moderate disease exacerbation (S2) (p < 0.05).
Figure 1
Bone mineral density of femoral neckFN BMD in group of patients with colitis ulcerosaaccording to the severity of exacerbation (S)
In the patients with mild exacerbation (S1), moderate exacerbation (S2), and severe exacerbation (S3) of the disease, no statistically significant correlations were found among the clinically important variables (between vitamin D concentration and age, body mass, BMI, and bone mineral density in the lumbar spine region and the femoral neck, as well as between IL-17 concentration and the above-mentioned variables). In the patients with clinical remission (S0), a statistically significant correlation was found between vitamin D levels and age (r = 0.59; p < 0.05). In the rest of the cases, no statistically significant correlation was found.
In Table VII, the characteristics and clinical parameters of patients with CD are presented according to the Montreal classification, based on the age of the patients at diagnosis.
Table VII
Characteristics and clinical parameters of patients with Crohn’s disease presented according to the Montreal classification, based on the age of the patients at diagnosis
| Parameter | A1 (n = 11) | A2 (n = 62) | A3 (n = 10) | P-value |
|---|---|---|---|---|
| Age [years] | 24.45 ±5.051 | 33.58 ±9.63 | 55.60 ± 0.60 | *< 0.05 **< 0.001 ***< 0.001 |
| Weight [kg] | 62.18 ±13.05 | 65.35 ±14.05 | 56.20 ±14.58 | NS |
| Height [cm] | 174.09 ±8.83 | 172.95 ±9.81 | 160.80 ±8.08 | **< 0.05 ***< 0.01 |
| BMI [kg/m2] | 20.43 ±3.58 | 21.69 ±3.64 | 21.53 ±4.20 | NS |
| L2–L4 BMD [g/cm2] | 1.04 ±0.21 | 1.14 ±0.17 | 1.05 ±0.16 | NS |
| L2–L4 T-score | –1.53 ±1.71 | –0.63 ±1.40 | –1.32 ±1.25 | NS |
| L2–L4 Z-score | –1.20 ±1.52 | –0.38 ±1.29 | –0.05 ±0.68 | NS |
| FN BMD [g/cm2] | 0.96 ±0.15 | 0.97 ±0.17 | 0.81 ±0.18 | ***< 0.01 |
| FN T-score | –0.58 ±1.01 | –0.48 ±1.26 | –1.53 ±1.25 | ***< 0.05 |
| FN Z-score | –0.33 ±0.92 | –0.24 ±1.15 | –0.33 ±0.96 | NS |
| 25-OHD [ng/ml] | 19.10 ±11.74 | 21.90 ±12.57 | 20.23 ±13.76 | NS |
| IL-17 [pg/ml] | 11.49 ±9.25 | 8.19 ±11.72 | 7.57 ±6.62 | NS |
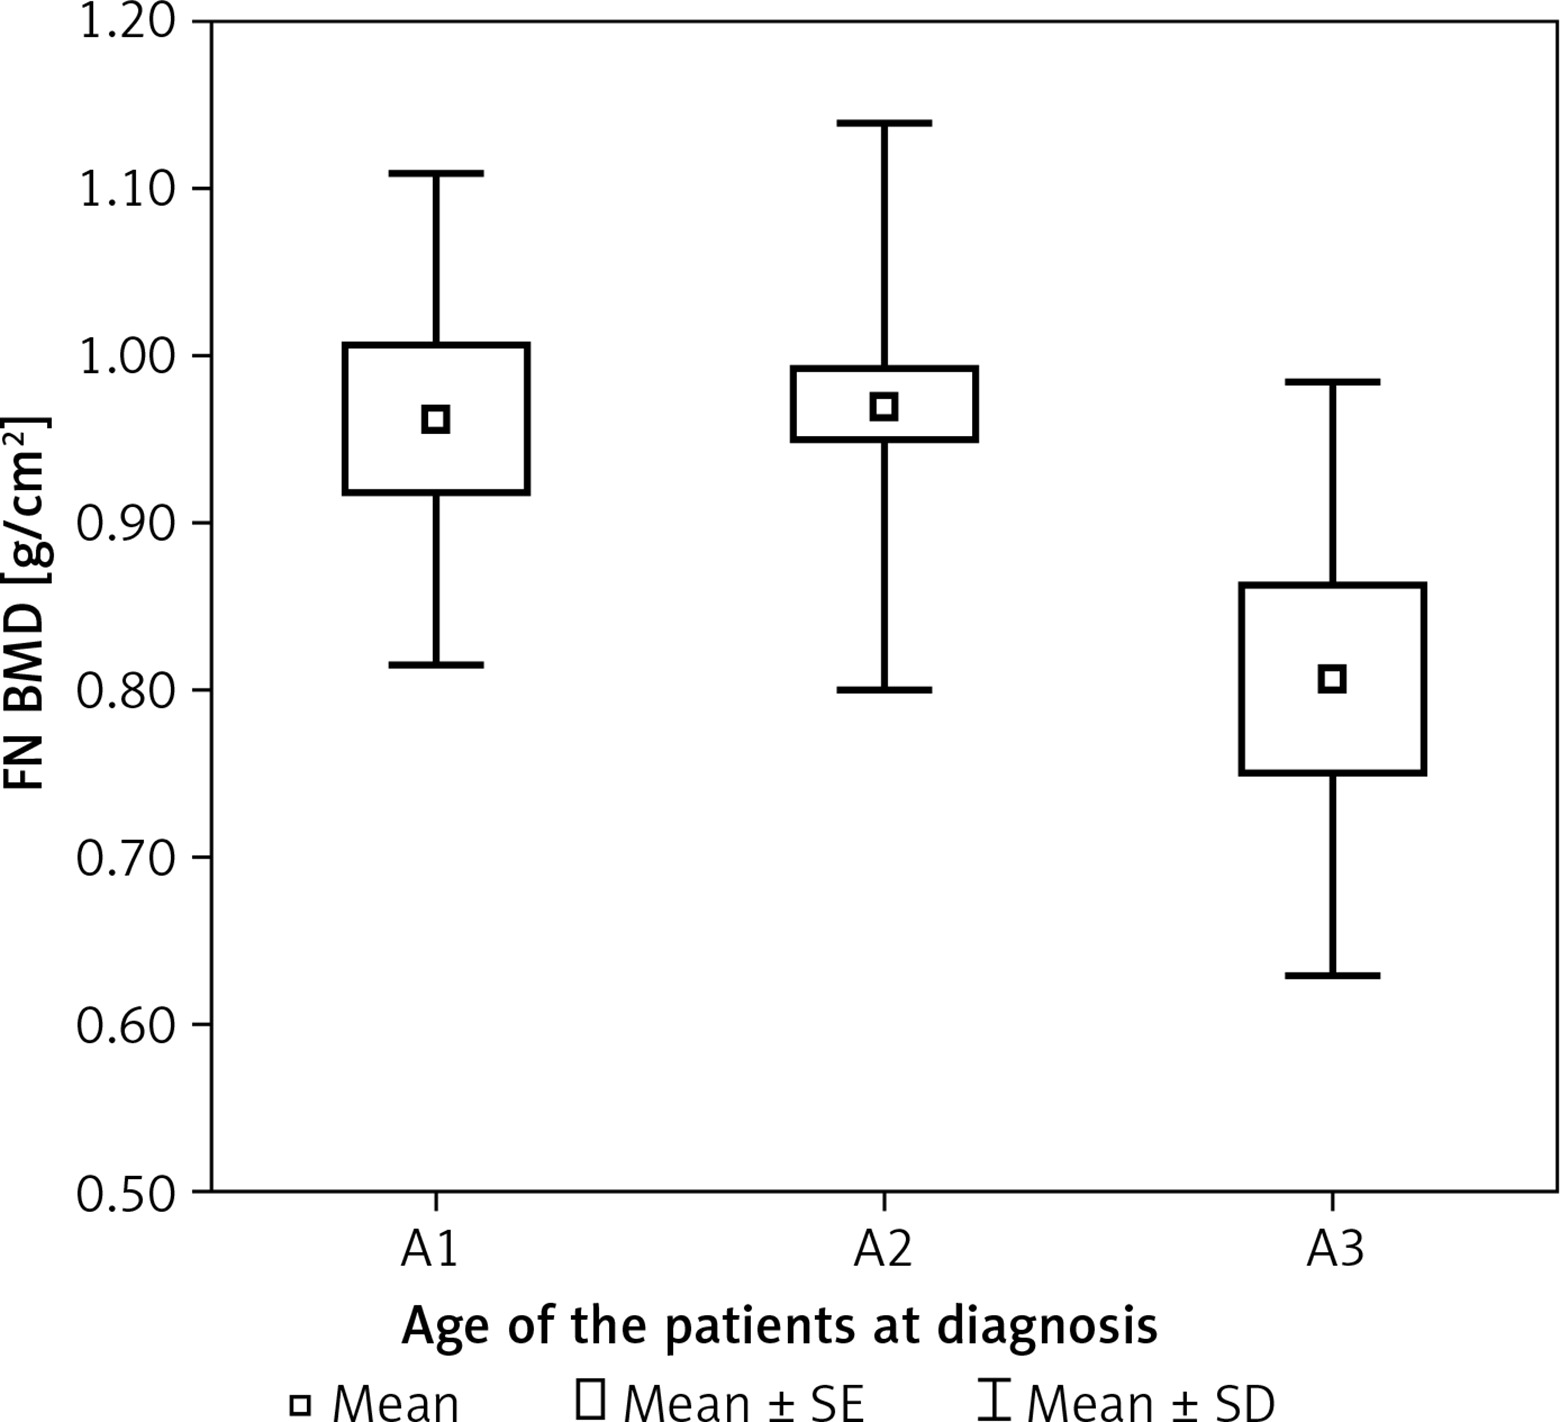
In patients who had a different age at the time of diagnosis, a statistically significant difference was found in age (p < 0.001, η2 = 0.355). Patients in whom the disease was diagnosed at a different age statistically significantly differed in terms of average height (p < 0.01, η2 = 0.119). It was found that patients diagnosed before the age of 16 (A1) were statistically significantly taller than those diagnosed after the age of 40 (A3) (p < 0.05). The patients diagnosed between the ages of 17 and 40 (A2) were also taller than those diagnosed after the age of 40 (A3) (p < 0.01). Patients diagnosed at a different age statistically significantly differed in terms of FN BMD (p < 0.01, η2 = 0.091). Detailed analysis showed that the patients diagnosed between the ages of 17 and 40 (A2) had a statistically significantly higher FN BMD than those diagnosed after the age of 40 (A3) (p < 0.01) (Figure 2). In the patients diagnosed at different ages, a difference in FN T-score (SD) was noted (p < 0.05, η2 = 0.061). Detailed comparisons revealed that the patients diagnosed between the ages 17 and 40 years old (A2) had a statistically significantly higher FN T-score (SD) than those diagnosed after the age of 40 (A3) (p < 0.05).
Figure 2
Bone mineral density of femoral FN BMD in patients with Crohn disease according to the age at the time of diagnosis (A)
Correlations between vitamin D and IL-17 in the patients diagnosed before age 16 (A1) did not achieve statistical significance. In patients diagnosed between the ages of 17 and 40 (A2), a statistically significant correlation was found between IL-17 and body mass (r = 0.25, p < 0.05). In patients diagnosed after the age of 40 (A3), no correlation achieved statistical significance.
In Table VIII, the characteristics and clinical parameters of patients with CD are presented according to the Montreal classification, based on the localization of intestinal mucosal changes.
Table VIII
Characteristics and clinical parameters of patients with Crohn’s disease presented according to the Montreal classification, based on the localization of intestinal mucosal changes
| Parameter | L1 (n = 28) | L2 (n = 20) | L3 (n = 35) | P-value |
|---|---|---|---|---|
| Age [years] | 35.75 ±12.01 | 34.20 ±11.74 | 34.91 ±12.42 | NS |
| Weight [kg] | 68.29 ±12.15 | 69.75 ±11.25 | 56.89 ±14.43 | **< 0.01 ***< 0.01 |
| Height [cm] | 173.39 ±8.75 | 174.20 ±7.72 | 168.77 ±11.99 | NS |
| BMI [kg/m2] | 22.70 ±3.64 | 22.94 ±3.24 | 19.74 ±3.27 | **< 0.01 ***< 0.01 |
| L2–L4 BMD [g/cm2] | 1.12 ±0.13 | 1.19 ±0.17 | 1.07 ±0.21 | NS |
| L2–L4 T-score | –0.76 ±1.01 | –0.28 ±1.42 | –1.20 ±1.69 | NS |
| L2–L4 Z-score | –0.54 ±0.96 | –0.04 ±1.25 | –0.60 ±1.51 | NS |
| FN BMD [g/cm2] | 0.97 ±0.15 | 1.04 ±0.18 | 0.88 ±0.16 | ***< 0.01 |
| FN T-score | –0.54 ±1.06 | 0.02 ±1.44 | –1.05 ±1.17 | ***< 0.05 |
| FN Z-score | –0.31 ±0.85 | 0.26 ±1.27 | –0.52 ±1.07 | NS |
| 25-OHD [ng/ml] | 23.27 ±14.02 | 23.69 ±12.86 | 18.42 ±10.63 | NS |
| IL-17 [pg/ml] | 8.62 ±13.56 | 8.29 ±7.40 | 8.65 ±10.49 | NS |
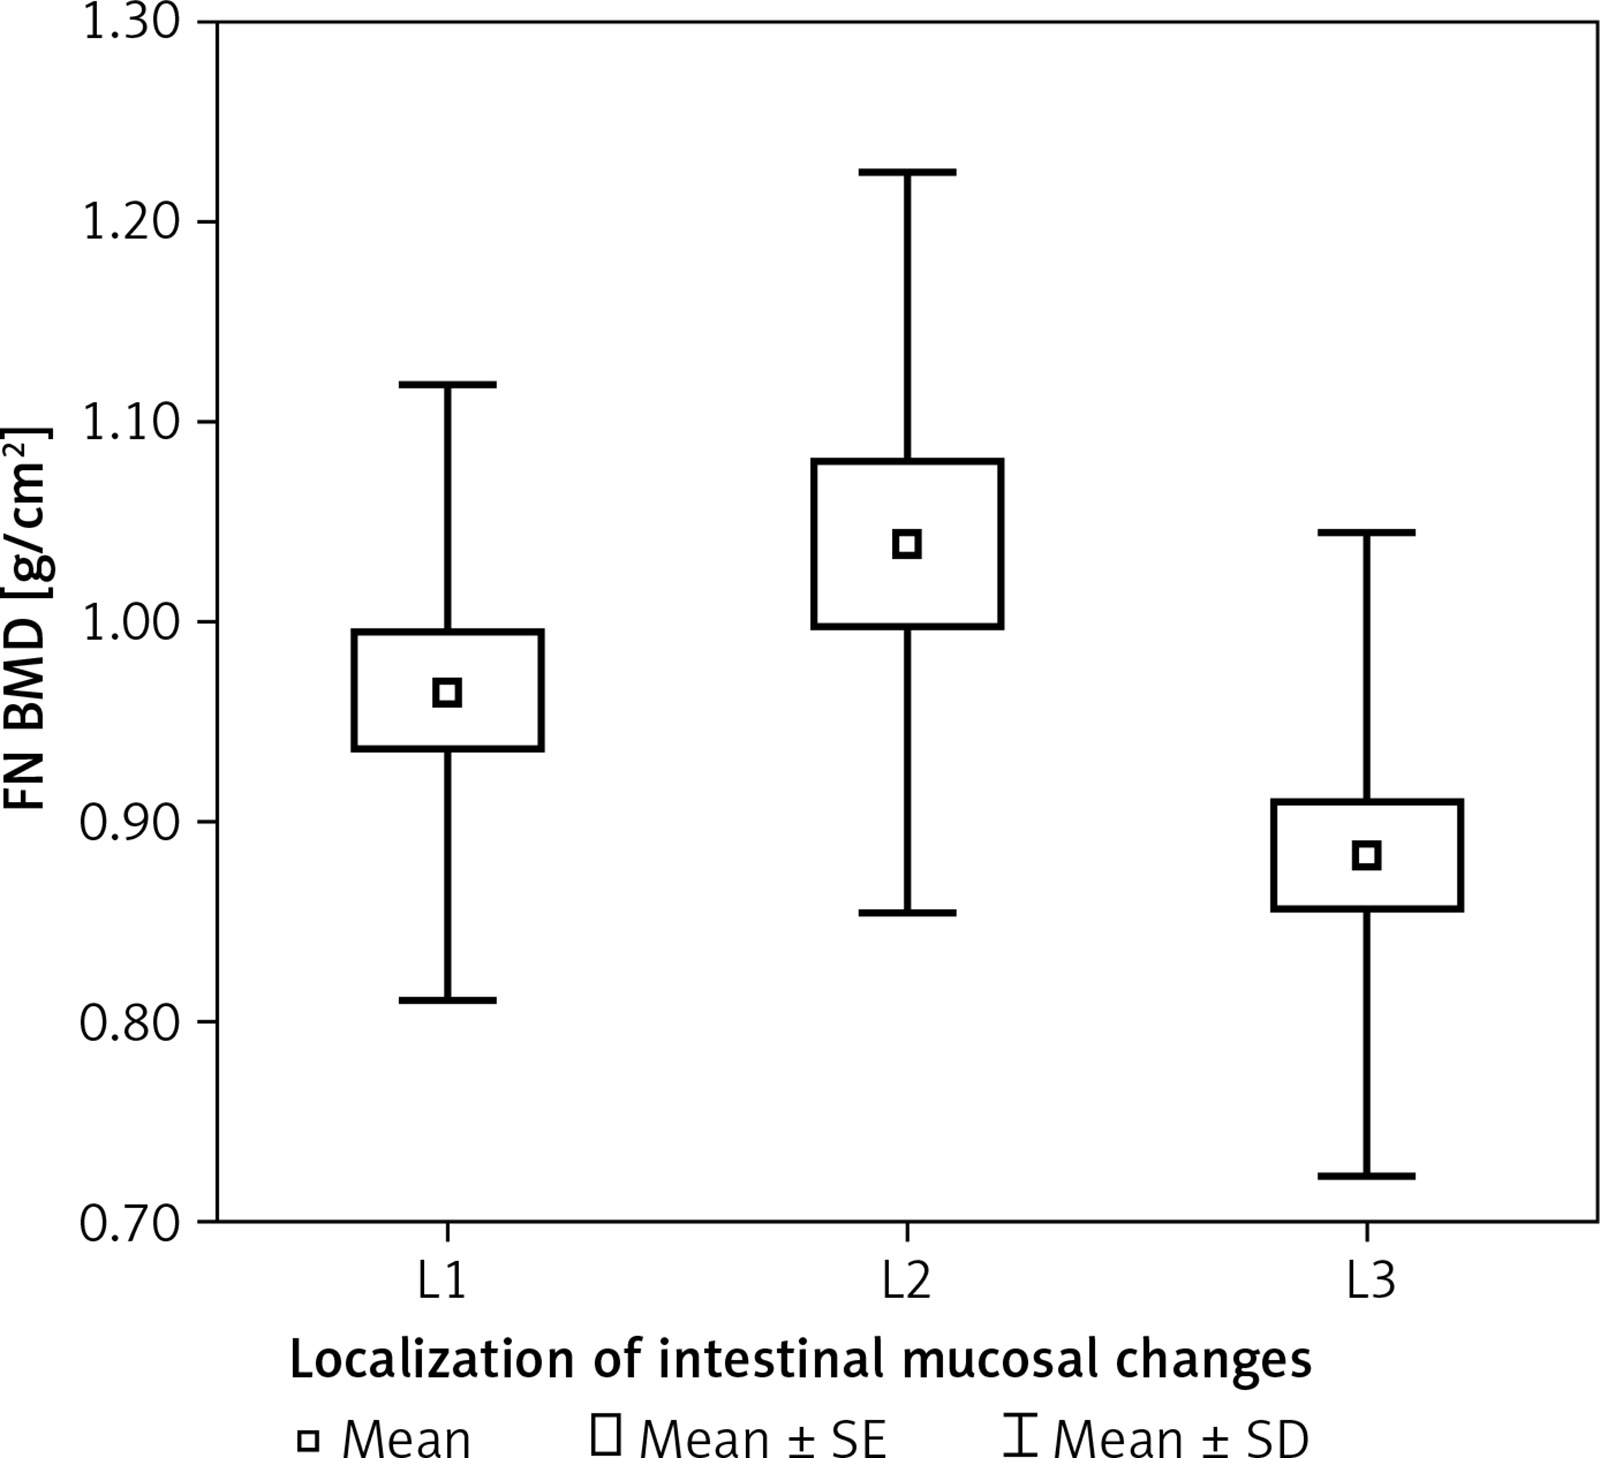
In patients with different localizations of mucosal changes, a statistically significant difference was found in body mass (p < 0.001, η2 = 0.171). Detailed analysis showed that patients with changes in the small intestine (L1) and patients with changes in the colon (L2) had statistically significantly higher body mass than those with changes in the small intestine and colon (L3) (p < 0.01, p < 0.01 respectively). In the patients with different intestinal localizations of mucosal changes, a statistically significantly higher BMI was noted (p < 0.001, η2 = 0.171). Detailed analysis also showed that patients with inflammatory changes in the small intestine (L1) and patients with inflammatory changes in the colon (L2) had a statistically significantly higher BMI than those with inflammatory changes in the small intestine and colon (L3) (p < 0.01, p < 0.01 respectively). In patients with different localizations of intestinal mucosal changes, a statistically significant difference was found in FN BMD (p < 0.01, η2 = 0.092). Detailed analysis revealed that patients with changes in the colon (L2) were characterized by a statistically significantly higher BMD than those with changes in the small intestine and colon (L3) (p < 0.01) (Figure 3). In patients with different localizations of intestinal mucosal changes, differences were noted in FN T-score (SD) (p < 0.05, η2 = 0.057). Detailed comparisons showed that patients with mucosal changes in the colon (L2) had a statistically significantly higher FN T-scores (SD) than those with changes in small intestine and colon (L3) (p < 0.05).
Figure 3
Bone mineral density of femoral neck FN BMD in patients with Crohn disease according to localization of intestinal mucosal changes (L)
In the patients with small intestinal involvement (L1), a statistically significant correlation was found between vitamin D levels and IL-17 (r = 0.45, p < 0.05), as well as age (r = –0.39; p < 0.05). In the patients with changes in the colon (L2), no statistically significant correlations were found among the clinically important variables. In the patients with changes in the small intestine and colon (L3), no correlations were found to be statistically significant.
In Table IX, the characteristics and clinical parameters of patients with CD are presented according to the Montreal classification, based on the course of the disease.
Table IX
Characteristics and clinical parameters of patients with Crohn’s disease presented according to the Montreal classification, based on the disease course
| Parameter | B1 (n = 31) | B2 (n = 25) | B3 (n = 27) | P-value |
|---|---|---|---|---|
| Age [years] | 31.58 ±11.581 | 38.32 ±13.00 | 35.93 ±10.82 | NS |
| Weight [kg] | 65.19 ±11.13 | 62.60 ±15.50 | 63.41 ±16.21 | NS |
| Height [cm] | 172.48 ±9.88 | 169.08 ±9.61 | 173.04 ±11.11 | NS |
| BMI [kg/m2] | 21.82 ±2.81 | 21.77 ±4.51 | 20.90 ±3.77 | NS |
| L2–L4 BMD [g/cm2 | 1.11 ±0.15 | 1.08 ±0.19 | 1.15 ±0.20 | NS |
| L2–L4 T-score | –0.96 ±1.19 | –1.00 ±1.50 | –0.52 ±1.67 | NS |
| L2–L4 Z-score | –0.56 ±1.08 | –0.58 ±1.35 | –0.20 ±1.46 | NS |
| FN BMD [g/cm2] | 0.98 ±0.18 | 0.90 ±0.16 | 0.96 ±0.17 | NS |
| FN T-score | –0.53 ±1.32 | –0.90 ±1.12 | –0.47 ±1.33 | NS |
| FN Z-score | –0.24 ±1.22 | –0.51 ±0.84 | –0.05 ±1.12 | NS |
| 25-OHD [ng/ml] | 25.66 ±11.76 | 18.89 ±11.45 | 18.61 ±13.27 | *< 0.05 |
| IL-17 [pg/ml] | 10.66 ±10.95 | 9.16 ±14.77 | 5.58 ±4.51 | NS |
In patients with different courses of the disease, a statistically significant difference was observed in vitamin D levels (p < 0.05, η2 = 0.074). Patients without strictures or fistulas (B1) had statistically significantly higher vitamin D levels than those with fistulas (B3) (p < 0.05) (Figure 4).
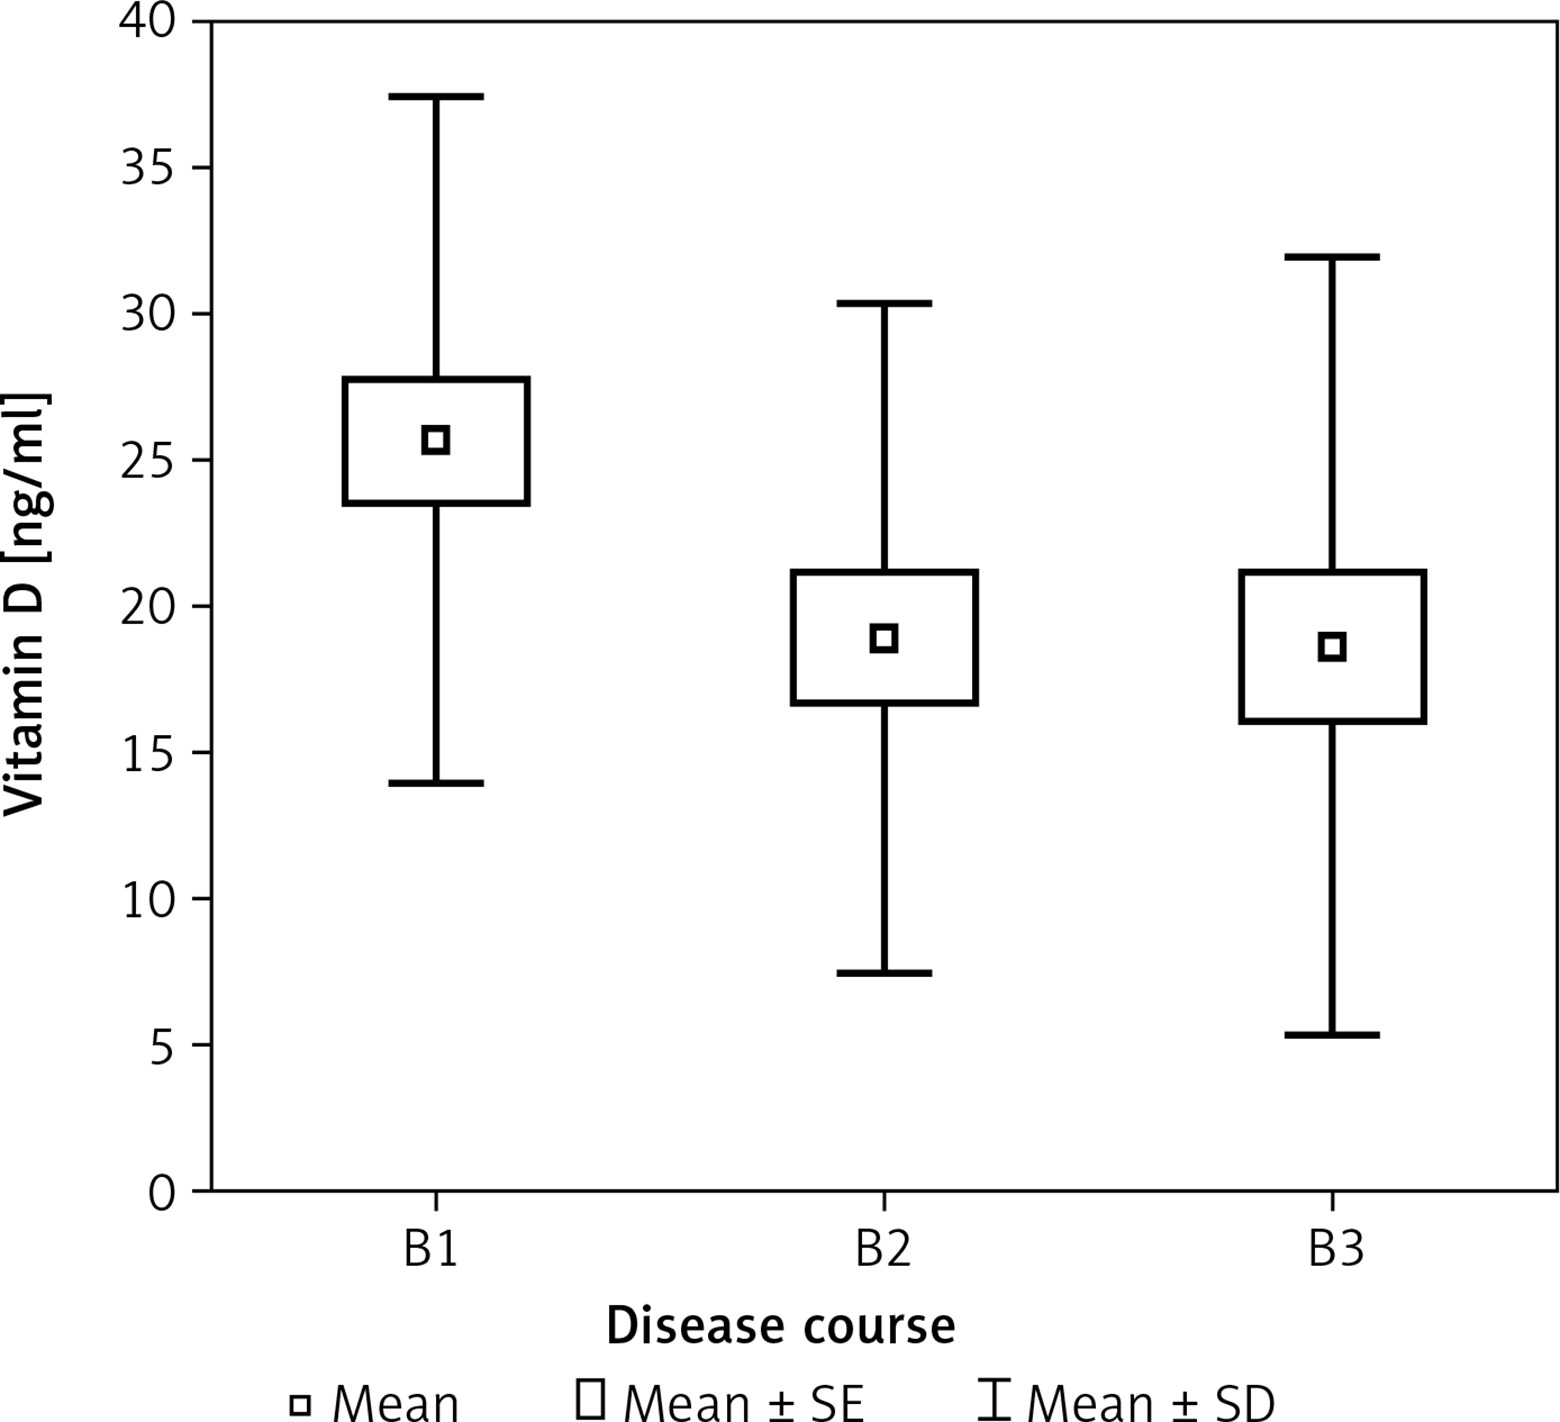
Patients without strictures or fistulas (B1) had a statistically significant correlation between vitamin D levels and BMI (r = 0.36; p < 0.05). Patients with intestinal strictures (B2) showed no statistically significant correlations between vitamin D and IL-17. In patients with fistulas (B3), no statistically significant correlations were found among the clinically important variables.
Discussion
According to many studies, vitamin D deficiency constitutes a significant problem among patients with inflammatory bowel diseases [26, 27]. Low vitamin D concentration occurs much more frequently in patients with CD. Deficiencies were found in close to 70% of patients [28]. Similar observations were made by Fu et al.: 43% of the patients with CD had a vitamin D level of < 50 nmol/l. The same was true for 37% of the patients with UC [17]. According to Hassan et al. the concentration of vitamin D below 30 ng/ml occurs in 95% of the studied patients with IBD, whereas according to the data published by Ananthakrishnan et al. 32% of patients had a vitamin D concentration below 20 ng/ml [15, 29].
In a meta-analysis by Lu et al. concerning 13 clinical studies, in which the level of 25(OH)D was assessed in patients with CD, in 8 of the studies the level of vitamin D in patients with UC was also analyzed. It was found that patients with IBD had a lower concentration of 25(OH)D than people from the control group. Patients with CD had close to twice, and patients with UC more than twice as high risk of vitamin D deficiency as compared to the control group [30].
Another meta-analysis was conducted under the supervision of Del Pinto et al. and concerned 14 clinical studies which analyzed 1891 people, comprising 938 patients with IBD and 953 controls. The analysis showed that in patients with IBD there was a higher percentage (64%) of vitamin D deficiency as compared to the control group, whereas in patients with UC, more than twice as high risk of vitamin D deficiency was found as compared to the people in the control group [31]. In our study, the average level of vitamin D in patients with CD did not differ significantly from that in patients with UC, or persons from the control group. Similar observations were made by Gokhale et al., who observed lower vitamin D levels in patients with CD, but the difference was not statistically significant [32].
Similar observations in Japanese patients with CD were made by Tajika et al. – patients did not statistically significantly differ from the control group with regard to the vitamin D concentration [33]. Analogously, in the study by Suibhane et al. they also did not find differences in the average vitamin D concentration between the patients with CD and healthy people [34]. It is worth mentioning that vitamin D deficiency was a big problem among healthy people, which could have influenced the results of the study [11]. Decreased exposure to sunlight, malnutrition, and physical states after gastrointestinal resections are all causes of vitamin D deficiency. In the case of CD, the terminal part of the ileum – a part of the intestine that is responsible for absorption of vitamin D from dietary intake – was in an inflammatory state in close to 80% of the patients. Among the patients with ulcerative colitis, and depending on the intestinal extent of the disease, no significant differences were noted in vitamin D levels. Higher vitamin D levels were observed in CD without strictures or fistulas (B1 according to the Montreal classification) than in those who had fistulas. Increased loss of protein through the fistulas, including protein necessary for binding and absorption of vitamin D, may be the reason for such a result. It is also worth mentioning that significantly lower vitamin D levels were not seen in UC patients with severe exacerbations (S3 according to the Montreal classification) with few or several defecations. Such patients are more predisposed to a decrease in absorption and loss of protein than the patients in clinical remission. Data on the relationship between vitamin D levels and the frequency of its deficiency are contradictory. Some authors associate lower vitamin D levels with a higher index of disease activity [35], while others, such as El Matary et al., do not [36]. In this study, significantly lower vitamin D levels were not found in patients with severe exacerbation of the disease, extensive involvement of the gastrointestinal tract, or an earlier age of diagnosis.
The risk of nutritional disturbances among patients with inflammatory bowel diseases is estimated to be 20–70% [37, 38]. Malnutrition in patients with IBD may be the result of inadequate diet, malabsorption, increased loss of nutrients with stool, and increased energy demand on the body. In this study, healthy volunteer subjects from the control group had a higher body mass and BMI than patients with CD. Ulcerative colitis patients with moderate (S2) and severe (S3) exacerbation had a lower body mass than patients in remission (greater loss with stool, decreased appetite). Among the patients with CD, those with inflammatory changes only in the small intestine (L1) had a higher body mass than those with involvement of the small intestine and colon (L3). In the latter, there was a substantial decrease in the surface area for absorption due to inflammation.
Interleukin-17 plays a significant role in the pathogenesis of inflammatory bowel diseases [7, 39]. Higher concentrations thereof were found in the serum and intestinal mucosa of patients with CD and ulcerative colitis [40]. Increase in local production of IL-17 in the intestinal mucosa leads to higher concentrations in the stool. Higher concentrations of IL-17 were found during the active phase of the disease, which is proof that mucosal damage in patients with CD is the result of increased IL-17 production in intestinal mucosa [41]. Other researchers have found that mRNA IL-17 is expressed in the mucosa of patients with UC, but not in healthy intestinal mucosa [40]. The expression of IL-17 in the colon was higher in patients with CD than in those with ulcerative colitis; and the number of Th17 cells, which are responsible for IL-17 production, increased during periods of disease activity, and decreased during periods of disease remission [42]. It is postulated that increased expression of IL-17 in the serum and mucosa in patients with IBD may be linked to a response towards a local inflammatory process [43]. However, there are not many studies concerning IL17 in the serum of patients with IBD. In the study by Mohammadi et al. it was observed that the levels of IL-17 in the serum of patients with UC are higher than in healthy people [44]. In the study by Sahin et al. no difference was noted in the IL-17 concentration between patients with CD and healthy people. Furthermore, no difference was noted between the patients with active CD and patients with inactive CD [45]. Schwarzmaier et al., in a study assessing the peripheral functions of monocytes, found that the expression and IL-17 release, as compared to other proinflammatory expression and cytokines released, did not differ between non-active CD patients and healthy people from the control group [46]. In our study, no significant differences in IL-17 levels between the IBD patients and the control group were observed. In UC patients with the involvement of the rectum (E1), a significant negative correlation between IL-17 and vitamin D level was observed – the higher the level of proinflammatory IL-17, the lower the level of vitamin D. In patients with IBD, low levels of vitamin D seemed to be associated with a more advanced clinical stage of the disease, worse nutritional state, changes in the small intestine, and longer duration of the disease. Ulcerative colitis patients with an affected distal part of the colon had limited inflammation [33, 47]. It was shown that vitamin D plays an immunomodulatory role [48, 49]. In a study conducted by Chang et al., stimulation of Th17 cells with the help of 1,25D3 (depending on the concentration) induced expression of the C/EBP homologous protein (CHOP) – a particle involved in endoplasmic reticulum and translation inhibition. Furthermore, overexpression of CHOP in the developing Th17 cells suppressed cytokine production [50]. Vitamin D regulates the development, function, and balance of T suppressors, T-helper (Th-) 1 cells, and benchmark cytokines (IL-2 and IFN-γ) through the reinforcement of the Th2 dependent response (IL-4, IL-5 and IL-10). Moreover, 1,25(OH)2D3 promotes suppression of Th17 cells and their associated cytokines, as well as induction of regulatory T (Treg) cells, which protect against autoimmunization through the induction of IL-10, and stimulation of cytotoxic T-bound protein 4 (CTLA-4) and forkhead box P3 (Foxp3) [51].
An interesting result of our study was that patients with IBD did not differ from the control group in terms of IL-17 concentration. The reason for this is may be that IL-17-producing cells can be effectively controlled by immunosuppressive medications. The concentration of IL-17 is not likely to be a good activity indicator, and thus not a good marker for the monitoring of disease activity. Further studies are needed with serial IL-17 measurements for evaluation of serum IL-17 as a disease-monitoring marker. Moreover, studies should be conducted on larger groups to evaluate serum IL-17 levels in patients with severely active IBD as compared to those in healthy subjects [45].
The etiology of bone mass loss in patients with inflammatory bowel disease is multifactorial. The main risk factors include malnutrition, malabsorption, and inflammation. In patients with inflammatory bowel disease, bone mass loss constitutes a significant problem. According to researchers, low bone mass more frequently occurs in patients with CD [52]. Based on current data, a decrease in BMD correlates with the activity of the disease and the state of patients’ nutrition. Similar results were obtained in this study. Among the patients with ulcerative colitis, the patients in remission (S0) had a higher FN BMD than those with severe exacerbation (S3), which was probably due to worsening nutritional states, malabsorption, a substantial increase in inflammatory response, and side effects of medications used for severe exacerbation. Among the patients with CD, those with isolated small bowel disease had a higher BMD than those with small intestinal and colon involvement (i.e. those with a severe course and increased malabsorption).
Vitamin D, the role of the immune system in pathogenesis, the course of inflammatory bowel diseases, and bone metabolism constitute important subjects of interest for researchers around the world. In this study, no differences were found in vitamin D and IL-17 concentrations between the patients with IBD and the control group. It was observed that patients with a mild course of the disease had higher vitamin D concentrations and bone mass. Furthermore, patients with a severe course of the disease had lower body mass than the healthy subjects and the patients with a mild course. In patients with ulcerative proctitis, higher vitamin D concentrations were linked to lower IL-17 concentrations. In large measure, available research indicates that vitamin D is a regulator of bone metabolism, and that it contributes to immune system homeostasis. Through the regulation of cytokine release by lymphocytes, it may also play a role in the pathogenesis of autoimmunological diseases. However, further studies to evaluate the relationship between vitamin D, the immune system, bone metabolism, and the pathogenesis of inflammatory bowel diseases are greatly needed.
The present study has several limitations, including younger age of the people from the control group as compared to the patients with IBD, a smaller number of people in the control group, as well as the lack of the inflammatory parameters.
In conclusion, patients with inflammatory bowel disease and persons from the control group did not differ in terms of vitamin D and IL-17 levels. Patients with a mild course of the disease had a higher vitamin D concentration and bone mineral density than those with a severe course. Furthermore, patients with a severe course had a lower body mass than the control group and patients with a mild course. In patients with ulcerative proctitis, higher vitamin D concentrations were associated with lower IL-17 concentrations.