Introduction
Community-acquired pneumonia (CAP) is a leading cause of death worldwide [1–4]. Its annual incidence is 0.3–0.6% in adults [4, 5], and it accounts for 5–15% of deaths among hospitalised patients and nearly 2 million deaths annually [5, 6]. Accordingly, early risk assessment and prognostic prediction are necessary to reduce healthcare-related costs and disease-related mortality [7–9]. Many studies have assessed means of predicting disease severity and outcomes to enable adequate allocation of healthcare resources and optimal treatment. Several efforts have been made to identify potential predictors of prognosis in CAP [3, 5, 6, 9–15]. Currently, pneumonia severity scales such as CURB-65 (confusion, urea, respiration, blood pressure, and age > 65 years) and the pneumonia severity index (PSI) are widely used to predict prognosis. In addition, the prognostic values of procalcitonin and C-reactive protein (CRP), both biomarkers of infectious diseases, have also been studied in this respect [1, 2, 10–14, 16, 17]. Others have compared the utility of white blood cell (WBC) counts versus procalcitonin or CRP [18, 19] or studied the prognostic values of neutrophil and lymphocyte counts in CAP [8, 20, 21].
As well as these haematological parameters, platelet indices have been studied with respect to the prediction of prognosis, disease severity, and mortality in many diseases. In one study, thrombocytopaenia and thrombocytosis were found to be strongly associated with short-term mortality in CAP patients [22]. In another multicentre observational study, it was demonstrated that thrombocytopaenia independently predicted mortality in CAP patients admitted to an intensive care unit (ICU) [23]. In a recent study, a relationship was observed between mean platelet volume (MPV) and short-term mortality in severe sepsis and/or septic shock patients [24]. Also, one study suggested that MPV might be a useful predictor for CAP diagnosis in paediatric patients [25].
Higher values of MPV and lower platelet counts (PCs) have been investigated in previous studies, and the MPV to PC ratio (MPR) has also been studied in many diseases. However, there has been no study on the relationship between MPR and mortality in CAP patients.
We undertook this study to determine the predictive value of MPR in CAP; (1) by evaluating the ability of MPR to predict short-term mortality, and (2) by comparing MPR values with pneumonia severity scales (CURB-65 and PSI).
Material and methods
Study design and data collection
We retrospectively reviewed the electronic medical records of all patients with a diagnosis of CAP admitted to Wonju Severance Christian Hospital (a tertiary university-affiliated hospital located in Wonju, South Korea) during the 10-year period from February 2008 to January 2018. Patients were diagnosed as CAP if they presented one of the following signs or symptoms; fever > 38.0°C, cough, sputum, dyspnoea, pleuritic chest pain, or auscultatory findings of abnormal breath sounds plus new infiltrate by chest radiography within 48 hours of hospitalisation [9, 17, 26, 27]. Patients with a history of hospitalisation within the two weeks prior to current admission were excluded. During the study period, 3665 patients received a diagnosis of pneumonia, and 150 patients had sufficient data to allow us to calculate CURB-65 and PSI scores according to the Infectious Diseases Society of America/American Thoracic Society (IDSA/ATS) guidelines [28].
The following demographic and clinical data were extracted: age, gender, systolic/diastolic blood pressure, respiratory rate, pulse rate, body temperature, mental status, bacteraemia, ICU admission, date of admission and death, presence of risk factors (history of hypertension, diabetes mellitus, cerebrovascular accident, heart failure, coronary artery occlusive disease, hepatic disease, renal disease, and malignancy), and accompanying respiratory diseases (asthma, bronchitis, chronic obstructive pulmonary disease, and tuberculosis). The following laboratory data were collected: white blood cell (WBC) count, haemoglobin, platelet count, mean corpuscular volume (MCV), mean platelet volume (MPV), delta neutrophil index (DNI), erythrocyte sedimentation rate (ESR), serum C-reactive protein (CRP), and procalcitonin.
For all patients enrolled in this study throughout the experiment, both MPV (reference range: 6.4–9.7 femtoliters) and PC (reference range: 165–360 × 103/microliter) values were routinely measured using an ADVIA 2120i automated haematology analyser (Siemens Healthineers, Erlangen, Germany). The relationship between MPV to PC ratio (femtoliters/number of thousand platelets per microlitre) and short-term (60-day) mortality was examined. All study subjects were followed up for more than 60 days.
This study was performed after obtaining approval from the institutional review board (IRB) of Wonju Severance Christian Hospital (IRB no. CR318070), which waived the requirement for informed consent.
Statistical analysis
For categorical data, data distributions are presented as frequencies and percentages and compared using the χ2 test. The Kolmogorov-Smirnov test was used to confirm normality for numerical data, and a p value greater than 0.05 indicates normal distribution of data (parametric data). For parametric data, results are presented as means ± standard deviations (SDs), and comparisons were performed using Student’s t-test, and for non-parametric data, results are presented as medians and interquartile ranges (IQRs), and comparisons were made using the Mann-Whitney U test.
Receiver operating characteristic (ROC) curve analysis was used to compare the abilities of various parameters, such as WBC, DNI, ESR, CRP, procalcitonin, neutrophil to lymphocyte ratio, and MPR, to predict 60-day mortality. Predictive values were determined by area under the curve (AUC) analysis. Patients were classified into MPR quartiles and compared. Results for numeric data were compared using analysis of variance (ANOVA) or the Kruskal-Wallis test (for parametric or non-parametric data, respectively), and when significant differences were found, Tukey’s adjustment was used for pairwise comparisons. Univariate and multivariate logistic regression analyses were performed before and after adjusting for confounders. Survival analysis was performed using the Kaplan-Meier estimation, and statistical significance was confirmed using the log-rank test. In addition, the abilities of CURB-65, PSI, and MPR to predict disease mortality, bacteraemia rates and ICU admission rates were compared, and sensitivities, specificities, and AUC values were determined.
The analysis was performed using SPSS version 23.0 (IBM Corp., Armonk, NY, USA) and Analyse-it version 5.01 (Analyse-it Software, Ltd., Leeds, UK) in Microsoft Excel 2010 (Microsoft Corp, Redmond, Washington, USA). Statistical significance was accepted for p values < 0.05.
Results
Baseline characteristics
Baseline characteristics of the 3665 study subjects are provided in Table I. Among them 2351 (64.1%) were men and 1314 (35.9%) were women, and the overall median subject age was 74.0 years (interquartile range [IQR], 65.0–80.0). Short-term survival (60-days) was evaluated for all patients, and 591 (16.1%) patients died within the 60-day follow-up period. In terms of medical histories, hypertension, asthma, and chronic obstructive pulmonary disease (COPD) were more frequent (p < 0.001, 0.002, and 0.023, respectively) and both systolic and diastolic blood pressure were higher (p < 0.001 and 0.025, respectively) in survivors. However, malignancy was more frequent (p = 0.009) in non-survivors. In addition, altered mental status rate, bacteraemia rate, and ICU admission rate were higher for non-survivors (p = 0.024, < 0.001, and < 0.001, respectively).
Table I
Baseline characteristics of community-acquired pneumonia patients
| Baseline variables | Patients | Survival | Non-survival | P value |
|---|---|---|---|---|
| n (%) | 3665 (100) | 3074 (83.9) | 591 (16.1) | – |
| Age [years; median (IQR)] | 74.0 (65.0–80.0) | 74.0 (64.0–80.0) | 75.0 (69.0–81.0) | – |
| Male, n (%) | 2351 (64.1) | 1960 (63.8) | 391 (66.2) | 0.281 |
| Female, n (%) | 1,314 (35.9) | 1114 (36.2) | 200 (33.8) | |
| Underlying disease, n (%) | ||||
| Hypertension | 1036 (28.3) | 911 (29.6) | 125 (21.2) | < 0.001* |
| Diabetes mellitus | 288 (7.9) | 253 (8.2) | 35 (5.9) | 0.055 |
| Cerebrovascular accident | 163 (4.4) | 145 (4.7) | 18 (3.0) | 0.081 |
| Cardiovascular disease | 121 (3.3) | 94 (3.1) | 27 (4.6) | 0.077 |
| Hepatic disease | 130 (5.5) | 111 (3.6) | 19 (3.2) | 0.710 |
| Renal disease | 248 (6.8) | 203 (6.6) | 45 (7.6) | 0.371 |
| Malignancy | 246 (6.7) | 191 (6.2) | 55 (9.3) | 0.009* |
| Other respiratory disease, n (%) | ||||
| Asthma | 142 (3.9) | 132 (4.3) | 10 (1.7) | 0.002* |
| Bronchitis | 167 (4.6) | 148 (4.8) | 19 (3.2) | 0.105 |
| COPD | 416 (11.4) | 365 (11.9) | 51 (8.6) | 0.023* |
| Tuberculosis | 119 (3.2) | 101 (3.3) | 18 (3.0) | 0.899 |
| Clinical findings, mean ± SD | ||||
| Systolic blood pressure [mm Hg] | 121 ±26.5 | 122.2 ±25.5 | 114.6 ±30.8 | < 0.001* |
| Diastolic blood pressure [mm Hg] | 70.2 ±15.6 | 71.0 ±15.2 | 65.9 ±17.0 | 0.025* |
| Respiration rate [min] | 20.9 ±4.0 | 20.7 ±3.7 | 22.0 ±5.0 | < 0.001* |
| Pulse rate [min] | 96.1 ±21.1 | 94.7 ±20.2 | 103.7 ±24.4 | < 0.001* |
| Body temperature [oC] | 37.1 ±0.8 | 37.2 ±0.8 | 37.0 ±0.9 | 0.611 |
| Mental status, n (%) | ||||
| Alert | 1081 (29.4) | 979 (31.8) | 102 (17.3) | 0.024* |
| Altered | 2584 (70.6) | 2095 (68.2) | 489 (83.7) | |
| Bacteraemia, n (%) | ||||
| Yes | 2491 (68.0) | 2032 (66.1) | 459 (77.7) | < 0.001* |
| No | 1174 (32.0) | 1042 (33.9) | 132 (22.3) | |
| ICU stay, n (%) | ||||
| Yes | 1379 (37.6) | 963 (31.3) | 416 (70.4) | < 0.001* |
| No | 2286 (62.4) | 2111 (68.7) | 175 (29.6) | |
| Laboratory findings | ||||
| White blood cell, median (IQR) [× 109/l] | 10.9 (7.3–15.3) | 10.9 (7.6–15.1) | 11.1 (6.0–16.3) | 0.177 |
| Haemoglobin, mean ± SD [g/dl] | 11.6 ±2.2 | 11.7 ±2.2 | 11.3 ±2.3 | 0.088 |
| Platelet, median (IQR) [× 109/l] | 222.0 (159.0–308.0) | 228.0 (167.0–312.8) | 191.5 (112.0–265.3) | < 0.001* |
| MPV, median (IQR) [fl] | 7.9 (7.3–8.6) | 7.8 (7.2–8.5) | 8.2 (7.5–9.1) | < 0.001* |
| DNI, median (IQR) (%) | 1.4 (0.0–3.7) | 1.3 (0.0–3.3) | 2.3 (0.2–7.0) | < 0.001* |
| CRP, median (IQR) [mg/dl] | 76.0 (10.8–145.0) | 74.2 (10.8–142.0) | 85.2 (10.6–156.9) | 0.102 |
| ESR, median (IQR) [mm/h] | 45.5 (23.0–68.0) | 46.0 (25.0–68.0) | 40.0 (12.0–64.0) | 0.001* |
| Procalcitonin, median (IQR) [ng/ml] | 0.6 (0.2–3.5) | 0.5 (0.2–2.7) | 1.7 (0.4–9.3) | < 0.001* |
* P value < 0.05 represents statistical significance. CAP – community-acquired pneumonia, IQR – interquartile range, COPD – chronic obstructive pulmonary disease, SD – standard deviation, ICU – intensive care unit, MPV – mean platelet volume, DNI – delta neutrophil index, CRP – C-reactive protein, ESR – erythrocyte sedimentation rate.
Regarding laboratory findings, DNI and procalcitonin levels were significantly higher in non-survivors (p < 0.001 for all). And we found that MPV was significantly higher (p < 0.001) and PC was significantly lower (p < 0.001) in non-survivors.
Predictive ability of mean platelet volume to platelet count ratio
ROC curve analysis showed MPR had an AUC for 60-day mortality of 0.63 (95% confidence interval (CI), 0.60–0.65), which was higher than that of any other variable except for the procalcitonin level (AUC of 0.65 [95% CI: 0.63–0.67]) examined in the present study. The AUCs of WBC, DNI, CRP, ESR, and neutrophil to lymphocyte ratio were 0.54 (95% CI: 0.51–57), 0.61 (95% CI: 0.59–0.64), 0.52 (95% CI: 0.49–0.55), and 0.54 (95% CI: 0.52–0.57), respectively (Table II).
Patient characteristics according to mean platelet volume to platelet count ratio quartiles
MPV to PC ratio was calculated as MPV (femtolitres) divided by PC (number of thousand platelets/microlitre). We stratified the 3665 study subjects into MPR quartiles as follows: first quartile 0.00–2.45, second quartile 2.46–3.50, third quartile 3.51–5.18, and fourth quartile ≥ 5.19. A summary of patient characteristics by MPR quartile is provided in Table III. The ICU admission rate was significantly increased according to MPR quartile (p < 0.001), whereas altered mental status and bacteraemia rate showed no significant tendency to increase (p = 0.217 and 0.716, respectively). Regarding laboratory findings, WBC count, PC, and ESR showed a significant tendency to decrease (p < 0.001 for all), and MPV showed a significant tendency to increase (p = 0.044).
Table III
Patient characteristics according to quartiles of mean platelet volume to platelet count ratio
| Baseline variables | Q1 | Q2 | Q3 | Q4 | P value |
|---|---|---|---|---|---|
| n (%) | 916 (25.0) | 916 (25.0) | 916 (25.0) | 917 (25.0) | - |
| Age [years; median (IQR)] | 74.0 (66.3–79.0) | 75.0 (66.0–81.0) | 74.0 (65.3–81.0) | 73.0 (61.0–81.0) | - |
| Male, n (%) | 566 (61.8) | 577 (63.0) | 595 (65.0) | 613 (66.8) | 0.116 |
| Female, n (%) | 350 (38.2) | 339 (37.0) | 321 (35.0) | 304 (33.2) | |
| Underlying disease, n (%) | |||||
| Hypertension | 273 (29.8) | 292 (31.9) | 255 (27.8) | 216 (23.6) | 0.757 |
| Diabetes mellitus | 69 (7.5) | 78 (8.5) | 71 (7.8) | 70 (7.6) | 0.863 |
| Cerebrovascular accident | 33 (3.6) | 55 (6.0) | 42 (4.6) | 33 (3.6) | 0.453 |
| Cardiovascular disease | 21 (2.3) | 32 (3.5) | 46 (5.0) | 22 (2.4) | 0.474 |
| Hepatic disease | 28 (3.1) | 23 (2.5) | 22 (2.4) | 57 (6.2) | 0.872 |
| Renal disease | 35 (3.8) | 53 (5.8) | 70 (7.6) | 90 (9.8) | < 0.001* |
| Malignancy | 81 (8.8) | 52 (5.7) | 60 (6.6) | 53 (5.8) | 0.203 |
| Other respiratory disease, n (%) | |||||
| Asthma | 40 (4.4) | 48 (5.2) | 34 (3.7) | 20 (2.2) | 0.325 |
| Bronchitis | 63 (6.9) | 49 (5.3) | 34 (3.7) | 21 (2.3) | 0.332 |
| COPD | 118 (12.9) | 129 (14.1) | 110 (12.0) | 59 (6.4) | 0.496 |
| Tuberculosis | 42 (4.6) | 32 (3.5) | 28 (3.1) | 17 (1.9) | 0.466 |
| Clinical findings, mean ± SD | |||||
| Systolic blood pressure [mm Hg] | 122.9 ±26.4 | 123.0 ±25.5 | 120.8 ±25.8 | 117.4 ±28.1 | 0.490 |
| Diastolic blood pressure [mm Hg] | 71.2 ±14.8 | 71.5 ±14.6 | 70.3 ±16.3 | 67.7 ±16.2 | 0.536 |
| Respiration rate [/min] | 20.9 ±4.1 | 21.0 ±3.9 | 20.7 ±3.7 | 20.9 ±4.1 | 0.438 |
| Pulse rate [/min] | 98.1 ±20.9 | 94.8 ±20.2 | 94.1 ±21.3 | 97.1 ±21.9 | 0.862 |
| Body temperature [oC] | 37.1 ±0.8 | 37.1 ±0.8 | 37.2 ±0.8 | 37.1 ±0.9 | 0.848 |
| Mental status, n (%) | |||||
| Alert | 200 (21.8) | 267 (29.1) | 285 (31.1) | 329 (35.9) | 0.217 |
| Altered | 716 (78.2) | 649 (70.9) | 631 (68.9) | 588 (64.1) | |
| Bacteraemia, n (%) | |||||
| Yes | 645 (70.4) | 591 (64.5) | 607 (66.3) | 648 (70.7) | 0.716 |
| No | 271 (29.6) | 325 (35.5) | 309 (33.7) | 269 (29.3) | |
| ICU stay, n (%) | |||||
| Yes | 300 (32.8) | 286 (31.2) | 326 (35.6) | 467 (50.9) | < 0.001* |
| No | 616 (67.2) | 630 (68.8) | 590 (64.4) | 450 (49.1) | |
| Laboratory findings | |||||
| White blood cell, median (IQR) [× 109/l] | 13.4 (9.5–17.9) | 11.7 (8.6–16.2) | 10.0 (7.0–13.8) | 7.9 (4.9–12.0) | < 0.001* |
| Haemoglobin, mean ± SD [g/dl] | 11.5 ±2.0 | 12.0 ±2.1 | 11.9 ±2.1 | 11.2 ±2.4 | 0.994 |
| Platelet, median (IQR) [× 109/l] | 383.0 (331.0–453.5) | 258.0 (235.0–281.0) | 190.0 (173.0–208.0) | 116.0 (78.0–140.8) | < 0.001* |
| MPV, median (IQR) [fl] | 7.3 (6.8–7.8) | 7.6 (7.2–8.1) | 8.0 (7.5–8.5) | 8.9 (8.2–9.8) | 0.044* |
| DNI, median (IQR) (%) | 1.3 (0.0–2.9) | 1.3 (0.0–3.1) | 1.4 (0.0–3.9) | 2.0 (0.0–5.8) | 0.420 |
| CRP, median (IQR) [mg/dl] | 76.5 (11.1–143.0) | 77.8 (11.5–140.0) | 74.0 (10.8–136.5) | 74.8 (9.1–157.0) | 0.993 |
| ESR, median (IQR) [mm/h] | 61.0 (42.0–81.8) | 49.0 (27.5–70.0) | 39.0 (21.0–59.0) | 31.0 (12.0–54.0) | < 0.001* |
| Procalcitonin, median (IQR) [ng/ml] | 0.3 (0.1–1.4) | 0.5 (0.2–2.1) | 0.7 (0.2–4.2) | 1.7 (0.4–8.8) | 0.610 |
* P value < 0.05 represents statistical significance. MPR – mean platelet volume to platelet count ratio, IQR – interquartile range, COPD – chronic obstructive pulmonary disease, SD – standard deviation, ICU – intensive care unit, MPV – mean platelet volume, DNI – delta neutrophil index, CRP – C-reactive protein, ESR – erythrocyte sedimentation rate.
Survival analysis according to mean platelet volume to platelet count ratio
For all study subjects, 60-day all-cause mortality was 16.1% (591/3665). A summary of univariate and multivariate logistic regression results obtained before and after adjusting for possible confounders is provided in Table IV. Univariate logistic regression analysis for the prediction of 60-day mortality revealed that patients in the the third and fourth MPR quartiles had higher mortality rates than patients in the first quartile. Odds ratios (ORs) with respect to the first quartile were as follows: 1.16 (95% CI: 0.87–1.55) for the second quartile (p = 0.307), 1.48 (95% CI: 1.12–1.95) for the third (p = 0.006), and 2.93 (95% CI: 2.27–3.78) for the fourth (p < 0.001). Multivariate logistic regression adjusted for age and medical history produced similar findings: OR of 1.49 (95% CI: 1.13–1.97) for the third quartile (p = 0.005) and 3.06 (95% CI: 2.36–3.96) for the fourth (p < 0.001). After additional adjustment for laboratory findings, such as WBC, ESR, DNI, and procalcitonin, the ORs for 60-day mortality were 1.37 (95% CI: 1.03–1.81) for the third quartile (p = 0.030) and 2.66 (95% CI: 2.04–3.46) for the fourth (p < 0.001).
Table IV
Univariate and multivariate logistic regression of association between mean platelet volume to platelet count ratio and 60-day mortality
| MPR quintiles | Unadjusted OR | Adjusted OR1 † | Adjusted OR2 § | |||
|---|---|---|---|---|---|---|
| OR (95% CI) | P value | OR (95% CI) | P value | OR (95% CI) | P value | |
| First quartile | 1 | – | 1 | – | 1 | - |
| Second quartile | 1.16 (0.87–1.55) | 0.307 | 1.20 (0.90–1.60) | 0.224 | 1.16 (0.87-1.55) | 0.320 |
| Third quartile | 1.48 (1.12–1.95) | 0.006* | 1.49 (1.13–1.97) | 0.005* | 1.37 (1.03-1.81) | 0.030* |
| Fourth quartile | 2.93 (2.27–3.78) | < 0.001* | 3.06 (2.36–3.96) | < 0.001* | 2.66 (2.04-3.46) | < 0.001* |
† Adjusted for age, history of hypertension, diabetes mellitus, cerebrovascular accident, cardiovascular disease, hepatic disease, renal disease, and malignancy.
§ Adjusted for age, sex, history of hypertension, diabetes mellitus, atrial fibrillation, heart failure, coronary artery occlusive disease, and malignancy plus white blood cell, erythrocyte sedimentation rate, delta neutrophil index, and procalcitonin. MPR – mean platelet volume to platelet count ratio, OR – odds ratio, CI – confidence interval.
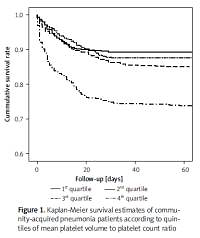
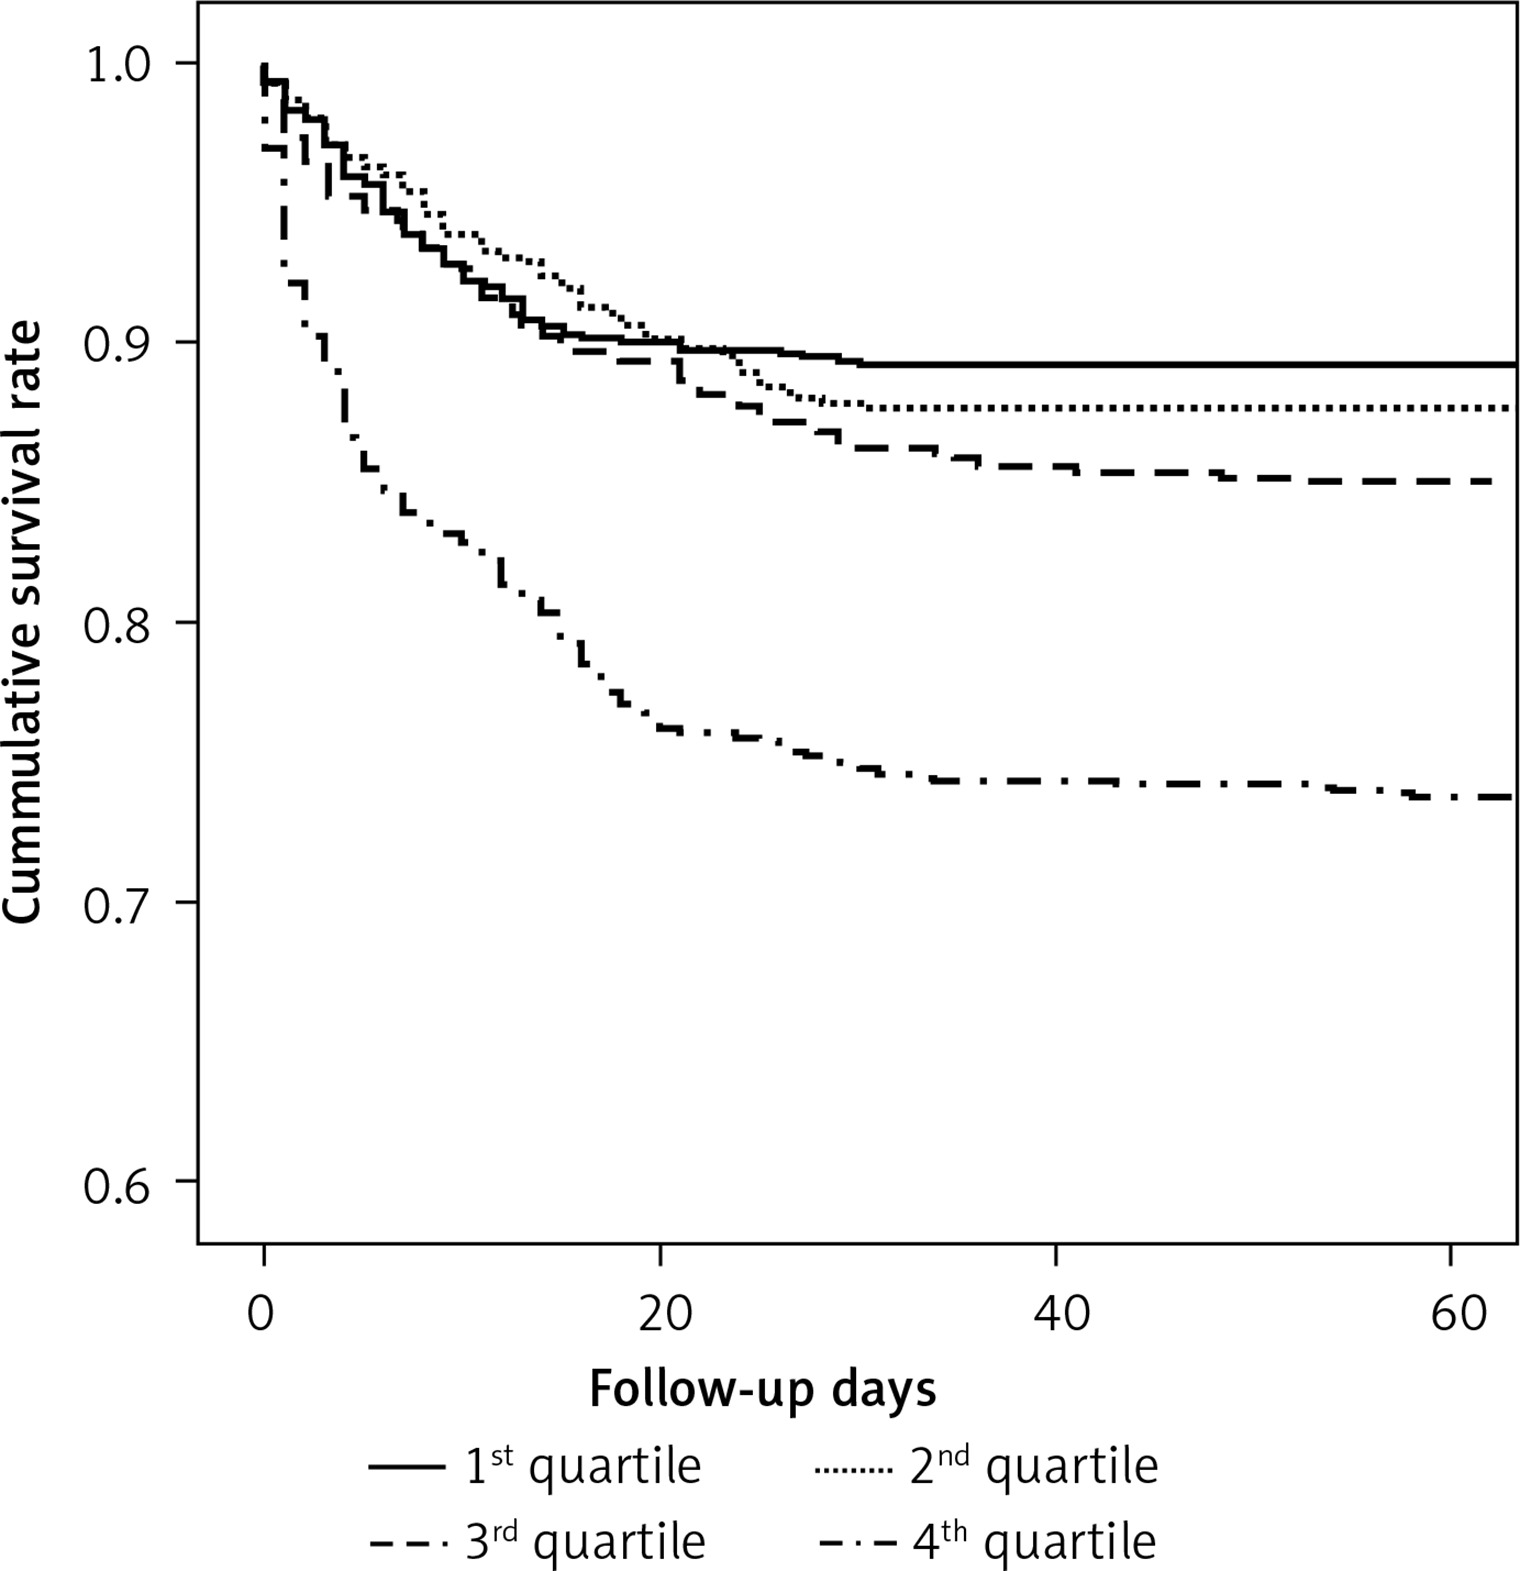
Kaplan-Meier survival estimates by MPR quartile are shown in Figure 1. Cumulative survival rates were 0.89 (95% CI: 0.80–0.99) for the first quartile, 0.87 (95% CI: 0.78–0.97) for the second, 0.84 (95% CI: 0.73–0.95) for the third, and 0.76 (95% CI: 0.63–0.89) for the fourth. Overall, the survival estimates tended to decrease with increasing MPR, which was confirmed by the log-rank test (p < 0.001).
Comparisons between mean platelet volume to platelet count ratio values and CURB-65 and pneumonia severity index scores
Additionally, among the 3665 study patients, we further made a comparison between MPR and other potential predictors of CAP, such as CURB-65 and PSI score. As mentioned above, only 150 patients had sufficient data to allow us to calculate CURB-65 and PSI scores, so we compared the MPR and these predictors (Table V).
Table V
Comparison of prognostic performance among CURB-65, PSI class, and mean platelet volume to platelet count ratio
The fourth quartile of MPR was found to be associated with higher 60-day mortality than an MPR quartile of ≤ 3 (37.5% vs. 14.9%, p = 0.002). A PSI class of ≥ 4 and a CURB-65 score of ≥ 3 were both associated with a greater risk of mortality (42.0%, p < 0.001 and 30.5%, p = 0.006, respectively). In terms of predicting 60-day mortality, the fourth quartile of MPR showed a sensitivity of 60.0% and a specificity of 69.6%, CURB-65 a sensitivity of 60% and a specificity of 74.8%, and PSI a sensitivity of 82.9% and a specificity of 42.6%.
In addition, ICU admission rates and bacteraemia rates were evaluated. For ICU admission rates, MPR showed a sensitivity of 55.4% and a specificity of 76.3%, CURB-65 a sensitivity of 51.4% and a specificity of 84.2%, and PSI a sensitivity of 77% and a specificity of 50%. For bacteraemia, MPR showed a sensitivity of 35.2% and a specificity of 57.1%, CURB-65 a sensitivity of 37% and a specificity of 76.2%, and PSI class a sensitivity of 64.8% and a specificity of 40.5%.
Discussion
The results of this study suggest that MPR is positively correlated with short-term mortality in CAP patients. This finding is consistent with those of previous studies, in which it was suggested that thrombocytopaenia and/or an elevated MPV had predictive value in patients with sepsis or CAP [22, 23, 25, 29].
In this study, the existence of medical histories seems to be an independent factor with regard to 60-day mortality. This is contrary to the results from other previous studies [30–32]. However, malignancy was more frequent, and altered mental status rate, bacteraemia rate, and ICU admission rate were higher for non-survivors. To minimise statistical errors caused by medical histories or laboratory results, we carried out logistic regression analyses after adjusting for these confounders.
Platelets play an important role in haemostasis, and their production is regulated by thrombopoietin via a feedback mechanism [33]. The primary role of platelets is thought to be related to the repair of injured blood vessels, aggregation and blood clot formation, and chemotaxis [34].
Furthermore, several studies have shown activated platelets release cytokines and immunomodulators and are thus associated with innate and adaptive immunity [34–36]. One study showed that some platelet surface receptors react with exogenic bacteria and activate internal signalling resulting in platelet activation, complement fixation, and platelet aggregation [37], and another reported that activated platelets bind to circulating leukocytes in patients with sepsis and multiple organ failure [38].
The prognostic values of MPV and PC have been assessed in many diseases. MPV is a routinely measured parameter that provides a measure of average platelet size in blood samples. High MPV values have been reported to be associated with platelet activation and inflammatory processes [24], and for this reason MPV has been investigated in thromboembolic diseases, ischaemic cardiovascular diseases, steatohepatic diseases, and even in malignancies [39–41]. On the other hand, PC has been studied in CAP, sepsis, septic shock, and thrombocytopaenia, and several studies have shown that thrombocytopaenia is an independent hallmark in ICU patients with the prognosis of sepsis [23, 42, 43].
Moreover, MPR has been investigated in many studies. For example, several studies have investigated relations between MPR and disease severity and/or mortality in hepatocellular carcinoma [40], non-small cell lung cancer [39], and non-ST-elevation myocardial infarction [41]. And one study found that MPR was correlated with 30-day mortality in patients with pneumonia following ischaemic stroke [44]. Thus, associations have been reported between MPR and disease prognosis and/or mortality, but not between MPR and prognosis and mortality in CAP.
As mentioned above, it is known that a high MPV and a low PC are associated with prognosis in patients with CAP, sepsis, or septic shock, and thus we hypothesised that MPR might associated with disease prognosis in CAP. When the prognostic values of MPR quartiles were examined, we found that the fourth quartile significantly predicted short-term (60-day) mortality in CAP patients. In addition, univariate and multivariate logistic regression analysis revealed that the fourth and fifth MPR quartiles exhibited statistical significance as compared with the first quartile (p < 0.05). Kaplan-Meier survival analysis also showed that survival estimates significantly reduced with increasing MPR, and this finding was confirmed by log-rank testing (p < 0.05). Furthermore, these results are consistent with the findings of others for inflammatory diseases [39–41].
In this study, we suggest that MPR can be used as a predictor of mortality in CAP patients rather than either MPV or PC alone. MPR has a higher AUC value than that of MPV or PC (data not shown). Also in this study, we found that high MPV and low PC value were associated with 60-day mortality. PC values can be affected by other confounding factors or diseases, so more reliable results can be obtained by using MPV values. Mean platelet volume to platelet count ratio has a relatively high AUC value, which was similar to the AUC value of procalcitonin. Without the need to measure procalcitonin or other markers, we can simply predict disease-related mortality in CAP patients with only MPV and PC values that are measured on a routine CBC analysis.
Additionally, the prognostic values of MPR and other pneumonia severity scales (CURB-65 and PSI) for 60-day mortality, ICU admission, and bacteraemia MPR were comparable, and although the sensitivities of MPR and CURB-65 were lower than for PSI, their specificities were much higher. In fact, MPR and CURB-65 showed high specificity for predicting short-term mortality and ICU admission, but predictions of bacteraemia lacked significance.
Several limitations of the present study warrant a mention. First, the study is limited by its retrospective, non-randomised, single-centre design, and thus, further multi-centre studies are required to confirm our findings. Second, the confounding effects of factors such as concurrent cerebrovascular, cardiovascular, hepatic, and renal diseases, and malignancy were not fully assessed. Third, we did not include CAP-causing pathogen types in the analysis.
Nevertheless, we found that elevated initial MPR correlated with 60-day mortality in patients with CAP. We conclude that MPR may provide a significant laboratory biomarker for predicting CAP-related mortality, and we suggest further prospective studies need to be conducted to further investigate and validate the use and exact role of MPR in CAP and other diseases.