Introduction
Visual impairment (VI) is prevalent among the elderly population. Approximately 3.22 million individuals in the United States experience vision impairment, with the highest proportion (50%) being elderly persons aged 80 years and older [1]. VI has a detrimental impact on all aspects of everyday living, including physical and cognitive abilities [2–4]. It is also associated with the risk of disability, comorbidity, and death [5, 6]. In high-income countries, the main causes of VI in older individuals are uncorrected refractive errors, diabetic retinopathy, cataracts, and glaucoma, with age-related macular degeneration being the leading cause of blindness [7].
Frailty is characterized by increased vulnerability to health problems due to declining bodily reserves and physiological dysfunction, often associated with aging [8]. Likewise, elderly individuals who are weak face the possibility of experiencing negative health outcomes such as falls [9], incapacity [10], hospitalization [11], and even death [11]. A recent comprehensive investigation, which included 62 nations and regions, revealed that the overall prevalence of physical frailty among older people was 12% [12]. Furthermore, frailty exacerbates the financial burden of healthcare for elderly individuals [13].
As frailty is a major risk factor for disability and VI is associated with functional decline, studying their relationship is crucial. A cross-sectional study of 2962 people over the age of 43 found that poorer visual acuity and contrast sensitivity were associated with lower frailty scores [14]. VI has also been associated with an increased risk of frailty and its progression [15]. In addition, Gonzales-Turin et al.’s study showed that VI was positively associated with frailty in older non-frail, pre-frail, and robust adults. After correcting for propensity scores, Varadaraj et al. [16] noted a substantial relationship between near vision impairment and frailty. Swenor et al. [6] found that fragility was strongly associated with VI severity.
Nevertheless, it is important to acknowledge that the findings regarding the correlation between VI and frailty are inconclusive. The majority of research has identified an association between VI and frailty, whereas a small number of studies did not find any relationship [17, 18]. Due to the limitations of observational studies, it remains uncertain whether there is a causal association between VI and frailty. Hence, further investigation into the causal correlation between the two phenomena is required.
Recent studies have used genome-wide association studies (GWAS) to estimate trait correlations and causality. Linkage disequilibrium score regression (LDSC) leverages GWAS summary statistics to assess genetic associations [19]. Mendelian randomization (MR) infers causal relationships between variables using genetic variation [20]. Genotype precedes phenotype, and alleles are randomly allocated at conception; therefore, genetic variation may be used to evaluate causality without reverse causality interference or confounding bias [21, 22]. This study thus investigated causal relationships and the genetic correlation between genetically predicted VI and frailty using MR and LDSC.
Material and methods
Study design
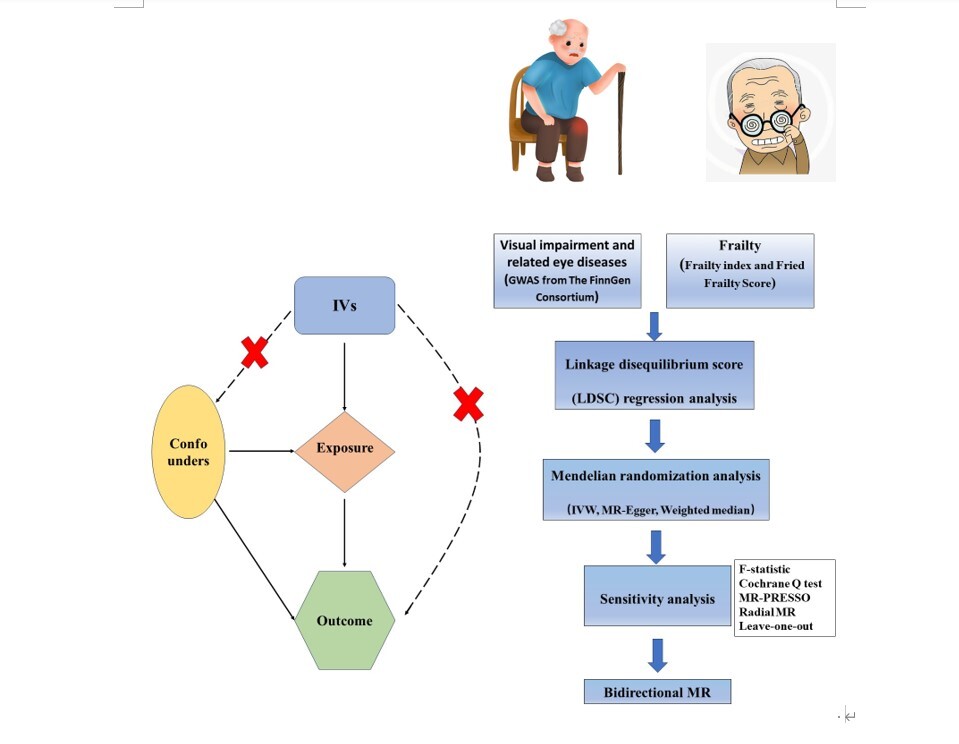
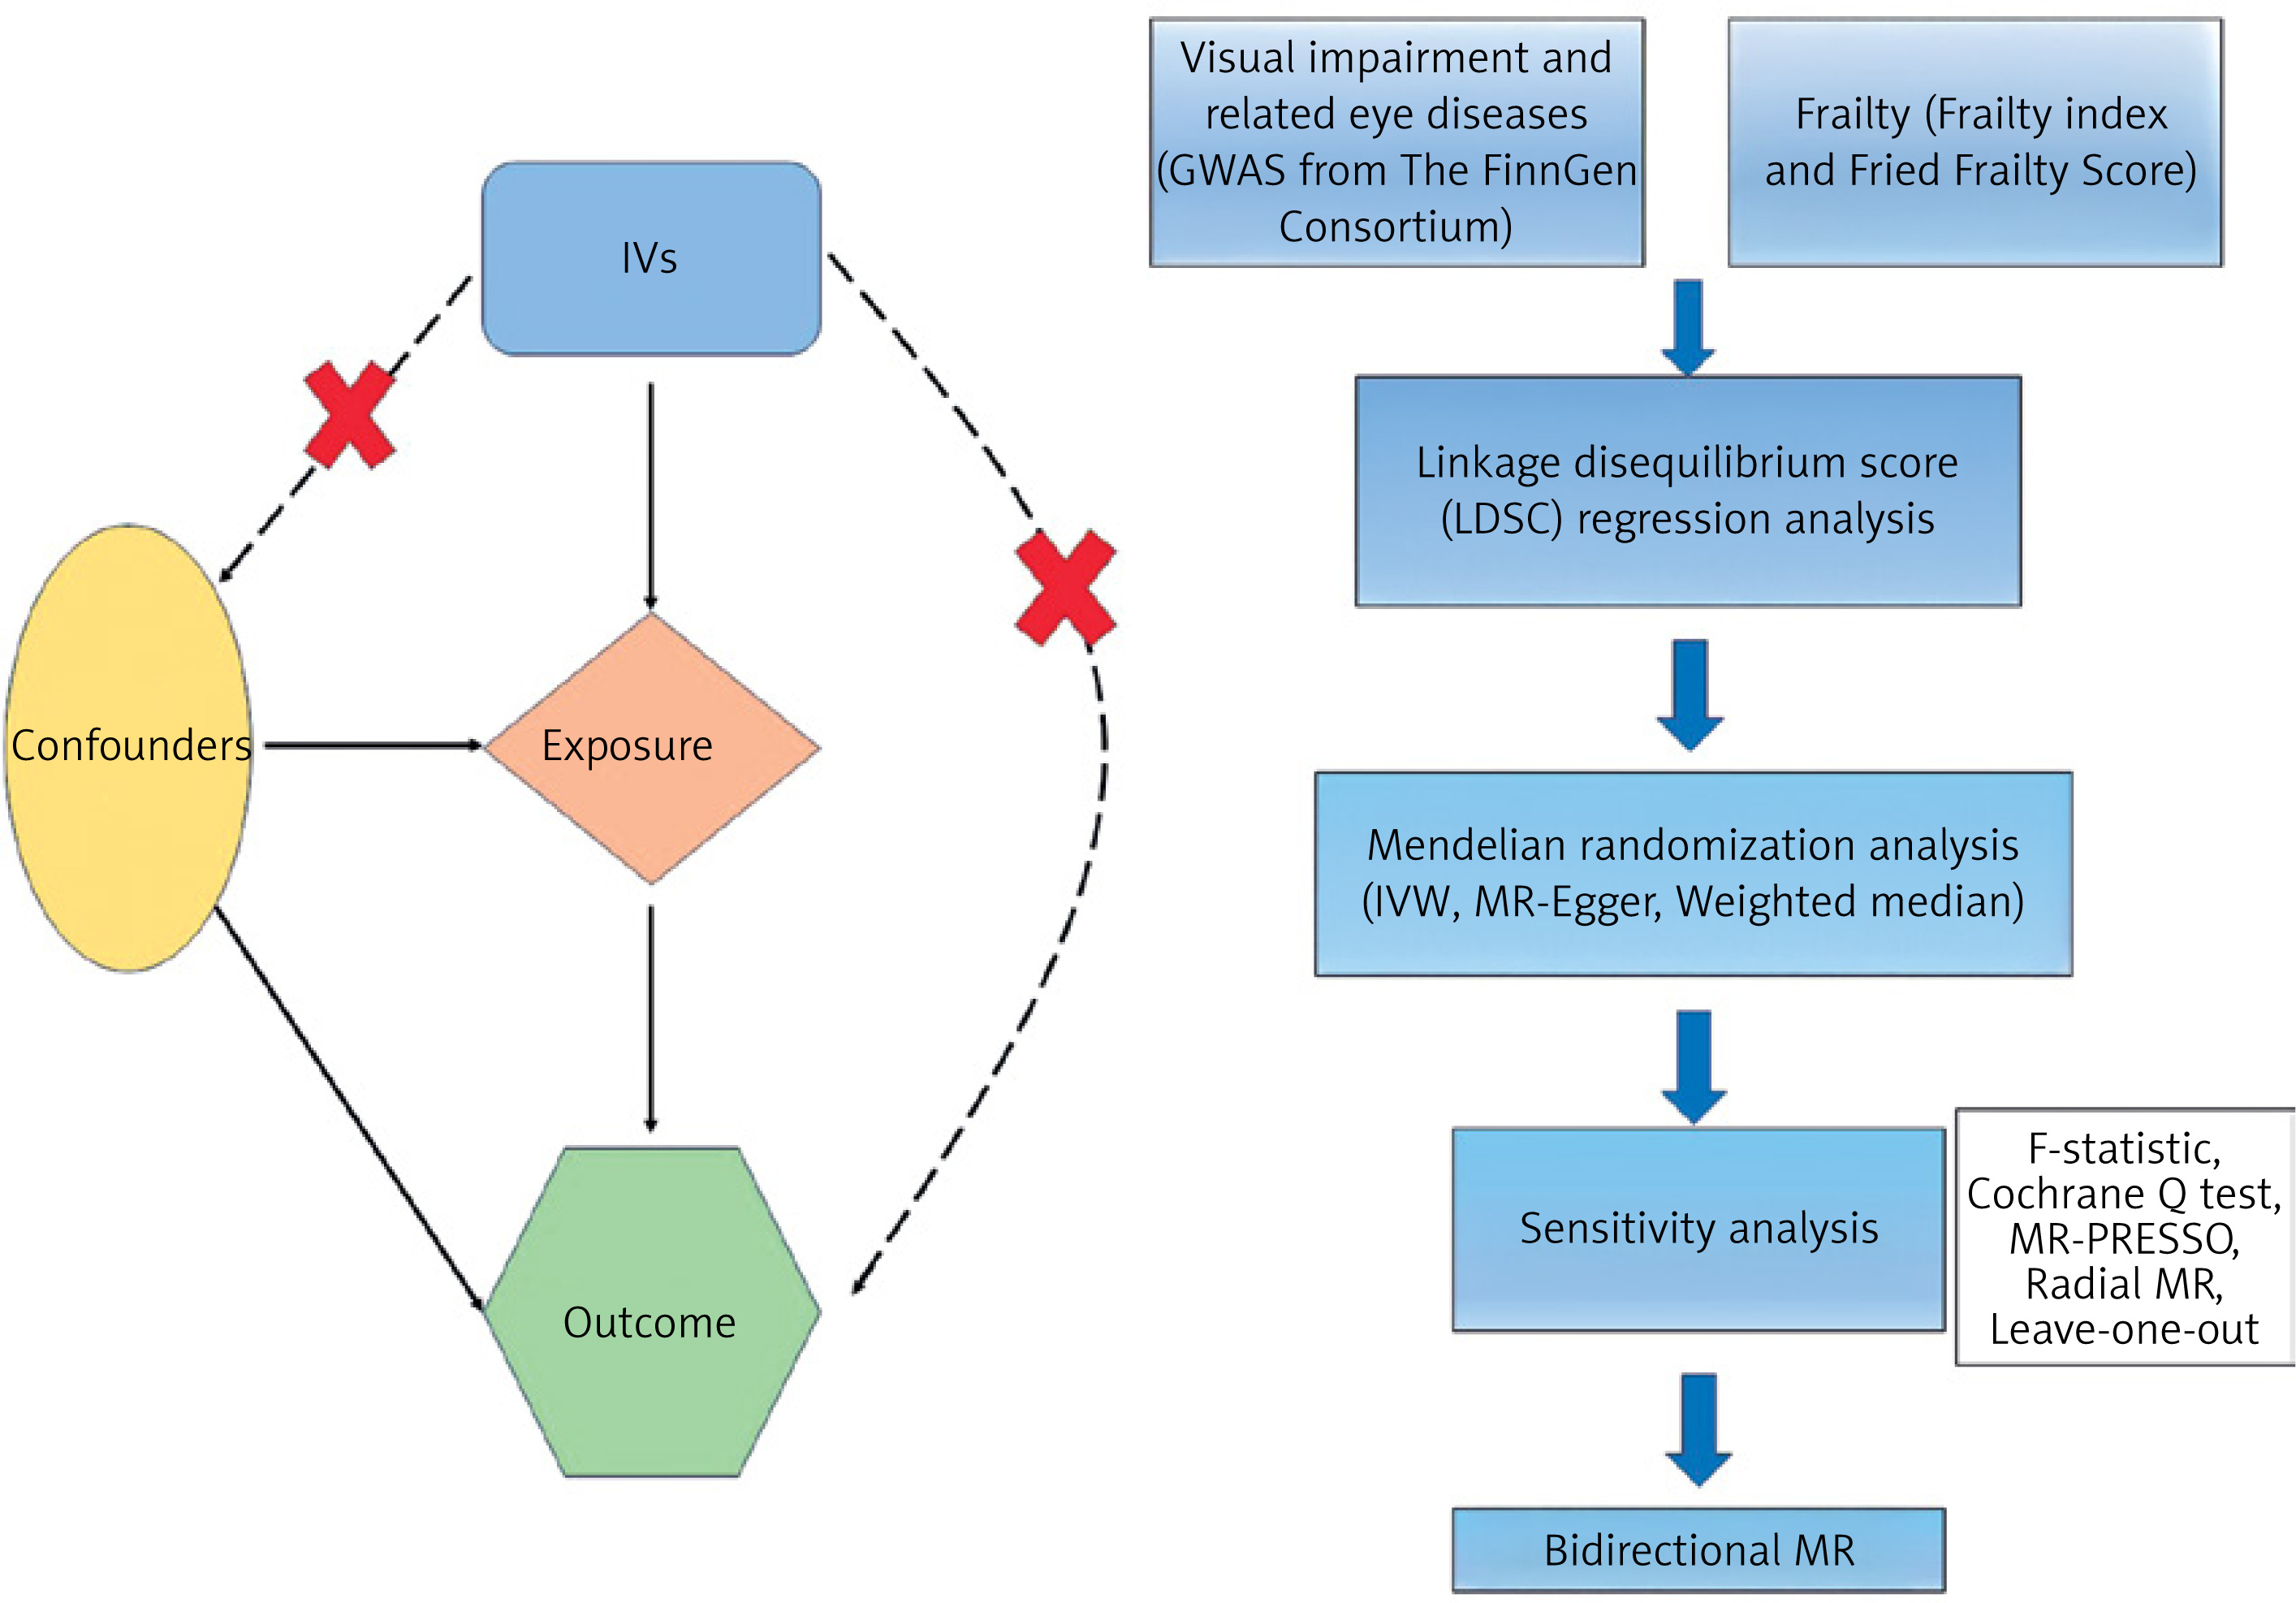
This study adheres to the STROBE Statement [23]. The study flowchart is shown in Figure 1. This study employed a bidirectional MR approach to identify potential causal relationships while avoiding false-negative causality [24]. In order to guarantee effective causal reasoning in MR research, three prerequisites must be fulfilled: (1) genetic instrumental variables (IVs) have strong associations with exposure; (2) genetic IVs are independent of potential confounding variables; and (3) specific genetic IVs are influenced by exposures while other factors are not [25].
Data sources
Exposure
The FinnGen Consortium is an ongoing genetic research project that combines genetic data from the Finnish Biobank with digital health records from the Finnish Health Registry (FinnGen, 1985). The FinnGen project used Illumina and Affymetrix arrays for genotyping, with strong quality control protocols in place. The published study [26] includes detailed participant information, genotyping processes, and quality control measures. We used GWAS data from Finland (R11) for VI and related eye diseases as exposure data (https://finngen.gitbook.io/documentation/). These data include visual disturbances, glaucoma, senile cataracts, other cataracts, diabetic retinopathy, age-related macular degeneration, hypermetropia, and myopia.
Outcome
From the GWAS catalog, we retrieved GWAS summary statistics for the frailty index (FI). The FI was used to assess frailty in a study of 175,226 people of European heritage, including 164,610 UK Biobank participants aged 60–70 and 10,616 Swedish TwinGene participants aged 41–87 years [27]. FI incorporates dozens of factors, including symptoms, indicators, disease state, and disability, to depict the accumulation of possible health losses over a lifetime. According to the UK Biobank and TwinGene defect accumulation theories, FI was estimated using 49 or 44 self-reported items, respectively [27].
The UK Biobank provided summary-level information for the fried frailty score (FFS), including 386,565 people [28]. Depending on how many of the criteria (weight loss, tiredness, poor physical activity, slow gait speed, and weak grip strength) were met, participants were given an FFS score ranging from 0 to 5.
There is debate over the definition and assessment of frailty, but the two most commonly used tools are the FI and FFS. In terms of determinants and frailty identification, the FI and FFS show convergence while having different conceptual foundations [29]. FI is predicated on the cumulative deficit concept, which quantifies the ratio of health deficiencies, encompassing symptoms, diseases, and functional impairments. It offers a thorough multidimensional assessment of frailty, appropriate for analyzing long-term effects; however, it necessitates substantial data gathering. Conversely, FFS relies on a biological framework encompassing five criteria (unintentional weight loss, diminished grip strength, weariness, reduced physical activity, and decreased walking speed) and categorizes frailty into three classifications. It is more straightforward and pragmatic for fast assessment, although less responsive to nuanced health variations. All the data are shown in Tables I and II. All research participants were of European ethnicity, and there was no sample overlap in the exposure and outcome data.
Table I
Information on the data source for VI
Selection of instrumental variables
We screened genetic IVs using the following criteria: (1) SNPs significantly associated with exposure and outcome at the genome-wide level (p < 5 × 10⁻⁸). However, due to the low number of IVs that met the threshold (p < 5 × 10⁻⁸), a broader criterion (p < 5 × 10⁻⁶) was used in partial exposures. The choice to lower the threshold in the IV screening procedure was predicated on the necessity to reconcile statistical power with validity. The standard criterion (p < 5 × 10⁻⁸) is frequently employed to discern reliable genetic instruments in Mendelian randomization research. Nonetheless, this rigorous criterion frequently leads to a restricted quantity of instrumental variables, particularly in datasets with small sample sizes or when examining traits with feeble genetic signals. By lowering the criterion to p < 5 × 10⁻⁶, we sought to incorporate supplementary genetic variants that could augment the explanatory capacity of the IVs while preserving an acceptable degree of validity [24, 30]. (2) Using a clumping approach (R2 < 0.001, window size = 10,000 kb), we were able to guarantee each SNP’s independence and eliminate variations with strong linkage disequilibrium (LD). (3) SNPs with a minor allele frequency less than 0.01, SNPs with non-concordant alleles, and SNPs with palindromic sequences were removed from the analysis. (4) We searched the GWAS Catalog (https://www.ebi.ac.uk/gwas/) for secondary phenotypes of each SNP in order to rule out the possibility of pleiotropic effects. SNPs associated with the characteristic of interest were eliminated, and the remaining SNPs were used in later studies. (5) We evaluated each SNP’s statistical efficacy using the F-statistic (F = β2/se2) [31] and removed any SNPs with low efficacy to reduce minor instrumental bias (F > 10). In addition, if the dataset for outcomes did not contain particular SNPs related to exposures, we excluded them and did not utilize proxy SNPs as replacements.
Mendelian randomization analysis
MR-Egger, inverse-variance weighted (IVW), and weighted median were among the complementary methodologies that we implemented. In our extensive samples, we employed the IVW approach to assess the causative relationship between frailty and VI. We believed that the IVW method was the most effective method for assessing causal effects due to our extensive exposure to IVs [32]. As a result, the IVW approach was the primary method of analysis for MR. The MR impact magnitude was estimated using random-effect IVW when IVs exhibited significant heterogeneity (p < 0.05). Fixed-effect IVW was implemented when it was absent [33].
Sensitivity analysis
In order to evaluate the robustness of the findings, we conducted numerous sensitivity analyses. The Cochrane Q test [34], which encompasses the MR-Egger and inverse variance weighted methodologies, was implemented to assess heterogeneity. Furthermore, horizontal pleiotropy was evaluated using the MR-Egger intercept [35]. The MR-PRESSO package [36] and Radial MR program [37] were employed to identify heterogeneous SNPs and exclude them from the final analysis. Additionally, the leave-one-out test [38] was implemented to determine the stability of these causal estimates.
RStudio (version 4.2.2) was employed in conjunction with the packages “TwoSampleMR” (version 0.6.6), “Radial MR” (version 1.0), and MRPRESSO” (version 1.0) to conduct the comprehensive analysis.
Linkage disequilibrium score (LDSC) regression analysis
Using LDSC, we calculated the genetic correlation (rg) between frailty and VI. LDSC regression analysis is an efficient and dependable method for determining the genetic frameworks underlying complex human phenotypes [39]. To estimate the inflationary effect of a real polygenic signal or bias, the LDSC assesses the relationship between test statistics and linkage disequilibrium [40]. This approach is not influenced by sample overlap and may assess genetic association using GWAS summary data 19. For our study, the researchers created an LD reference panel using 1000 genomes (source: https://github.com/bulik/ldsc) and European LD scores. It was determined that p < 0.003125 (0.05/8*2, following stringent Bonferroni correction) was statistically significant. It was determined that 0.003125 < p < 0.05 indicated a possible genetic association.
Results
Instrumental variables
During the initial IV screening process, if the number of IVs was less than 10, then we relaxed the threshold (p < 5 × 10⁻⁶). Therefore, we relaxed the thresholds for visual disturbances, hypermetropia, and myopia (p < 5 × 10⁻⁶). We identified 6 to 43 SNPs as IVs for the outcomes of VI and frailty, respectively, after conducting a thorough screening process (Figures 2 and 3). Since heterogeneity was not detected by Cochran’s Q test (p > 0.05), we used the IVW technique to create a fixed-effects model. The F-statistics, all of which are more than 10, demonstrate that there is no marginal instrumental bias. Information on IVs and F-value results are available in Supplementary Table SI.
Causal effect of VI on frailty
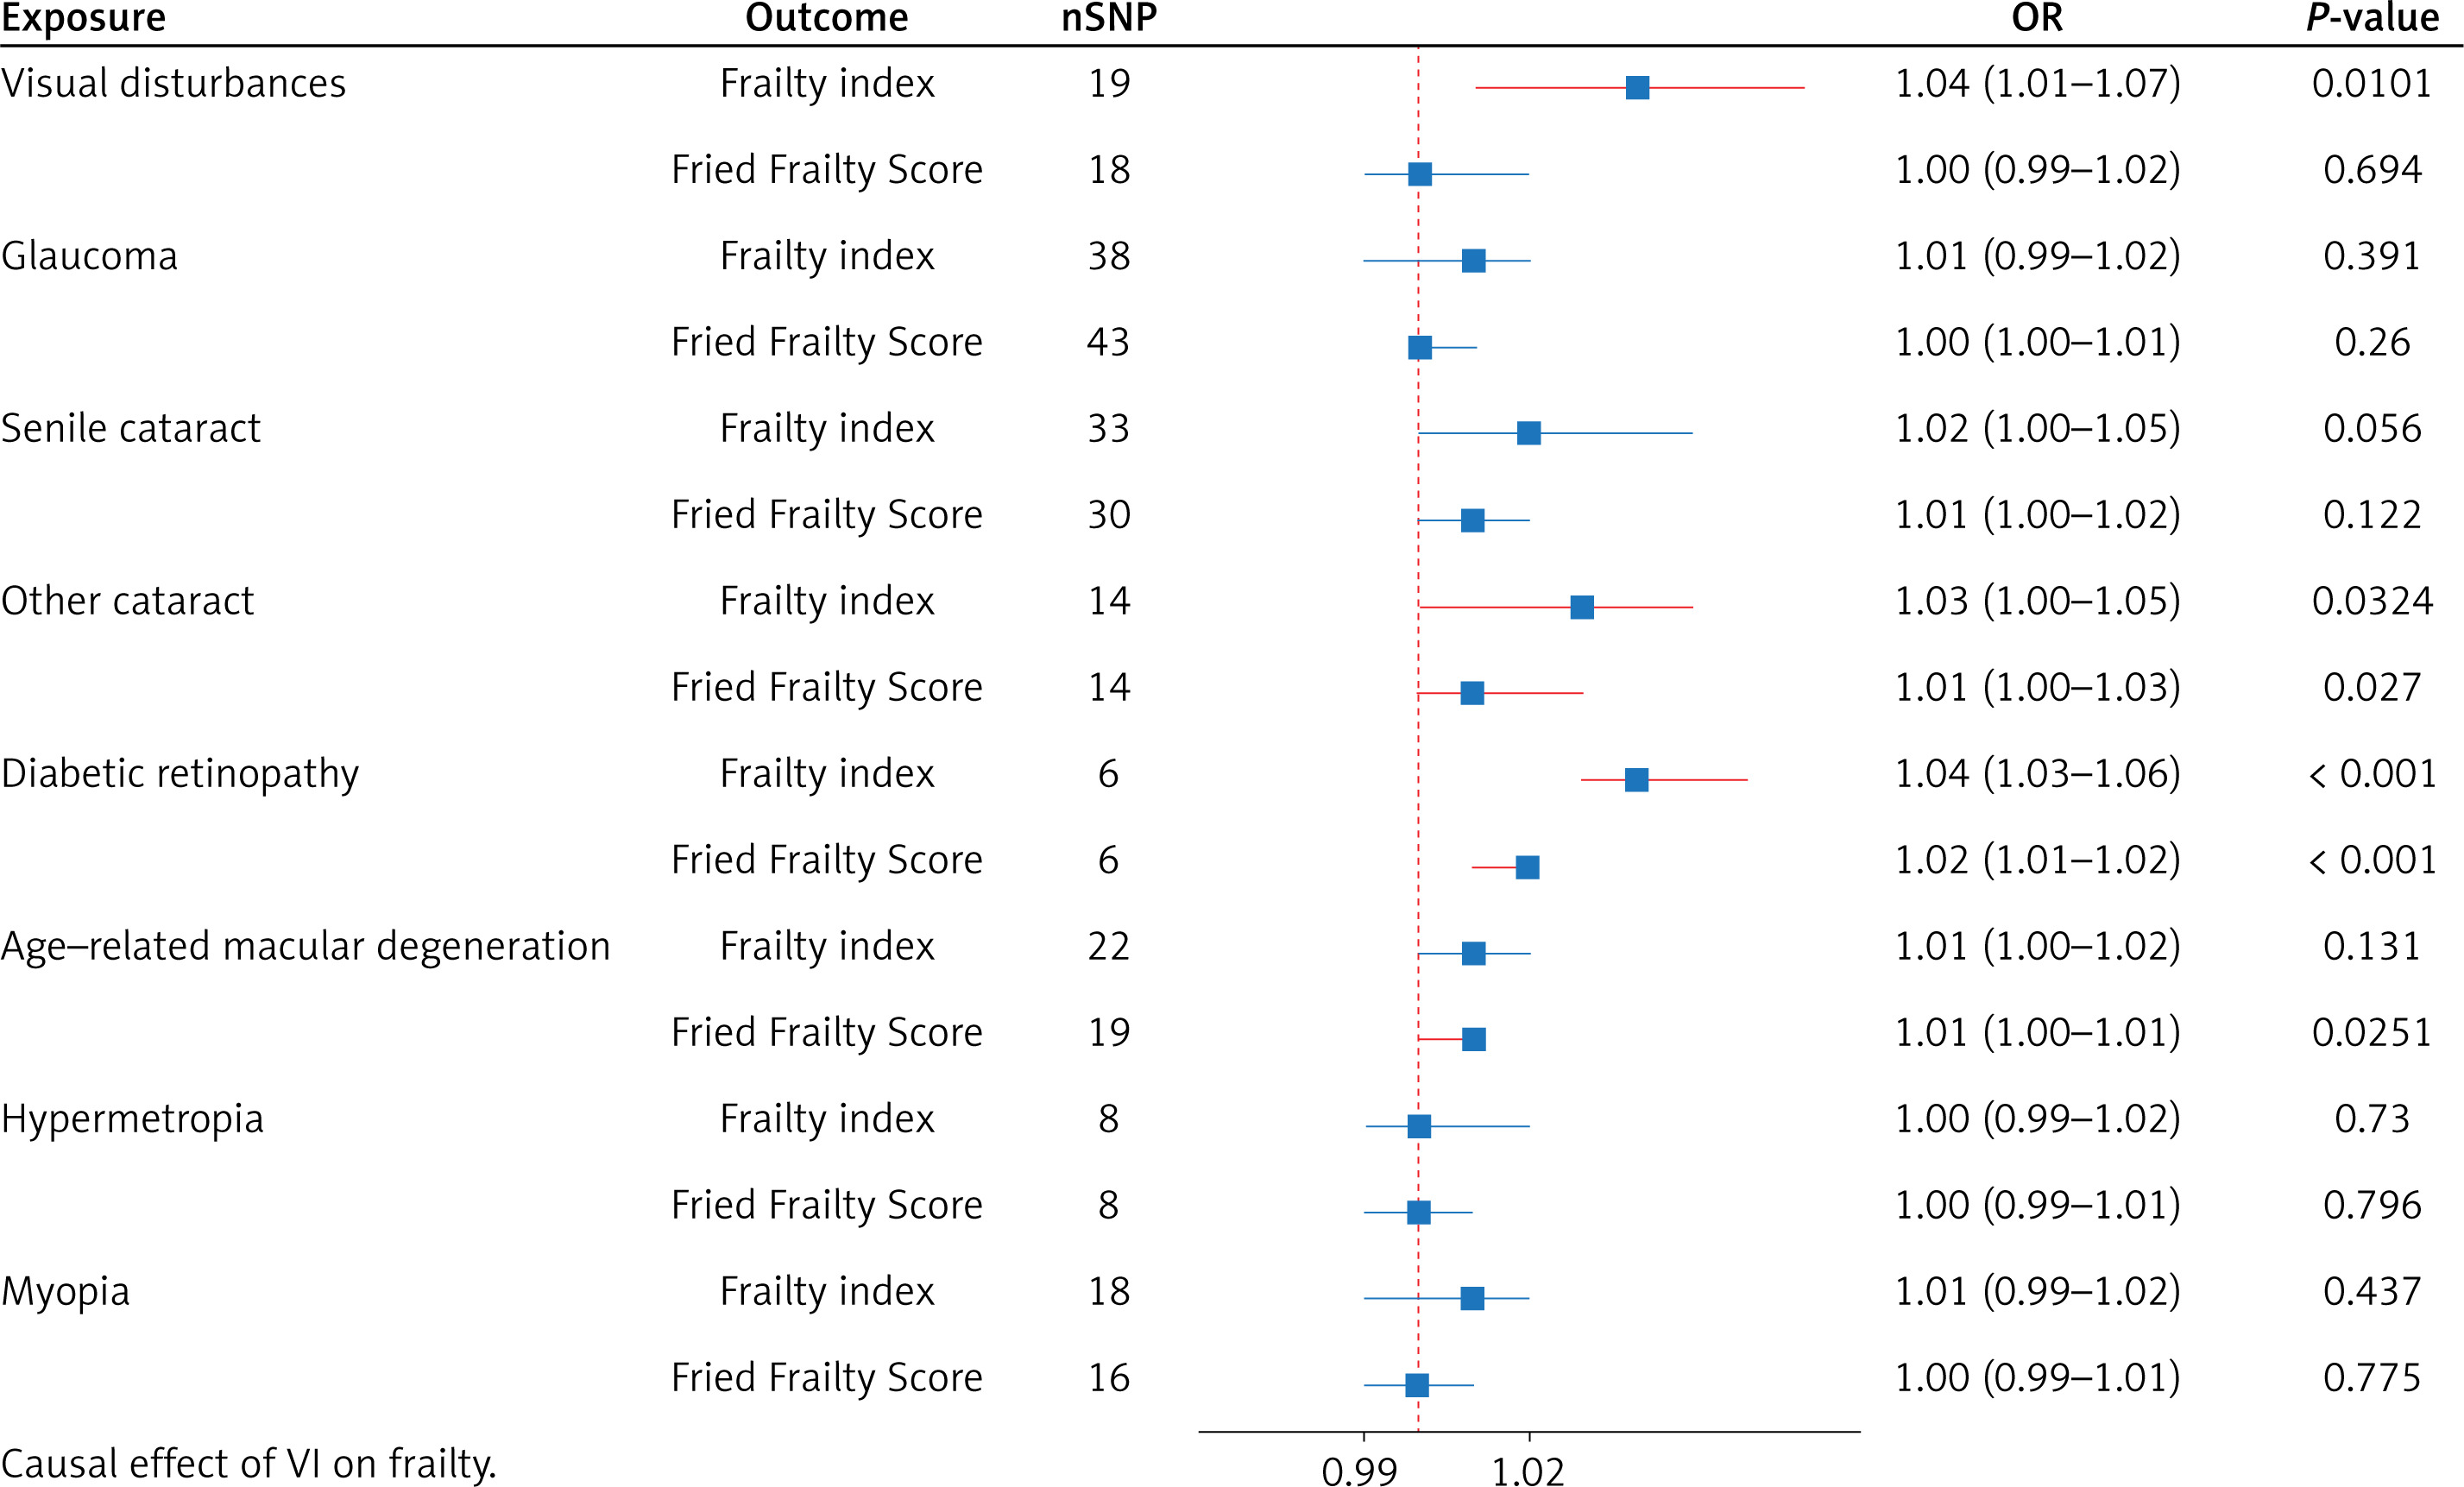
Figure 2 presents the results of the estimation of the causal relationship between VI and the two frailty characteristics. Applying the IVW approach, we found that other types of cataract (FI: p = 0.0324, OR = 1.03; 95% CI = 1.00–1.05; FFS: p = 0.027, OR = 1.01; 95% CI = 1.00–1.03) and diabetic retinopathy (FI: p < 0.001, OR = 1.04; 95% CI = 1.03–1.06; FFS: p = 0.0119, OR = 1.02; 95% CI = 1.01–1.02) were associated with an increased risk of frailty. This risk was observed in both FI and FFS. However, visual disturbances were associated with increased risk of FI (p = 0.0101, OR = 1.04; 95% CI: = 1.01–1.07), while the association appeared to be less pronounced for FFS. In addition, age-related macular degeneration was significantly associated only with increased risk of FFS (p = 0.0251, OR = 1.01; 95% CI = 1.00–1.01).
Causal effect of frailty on VI
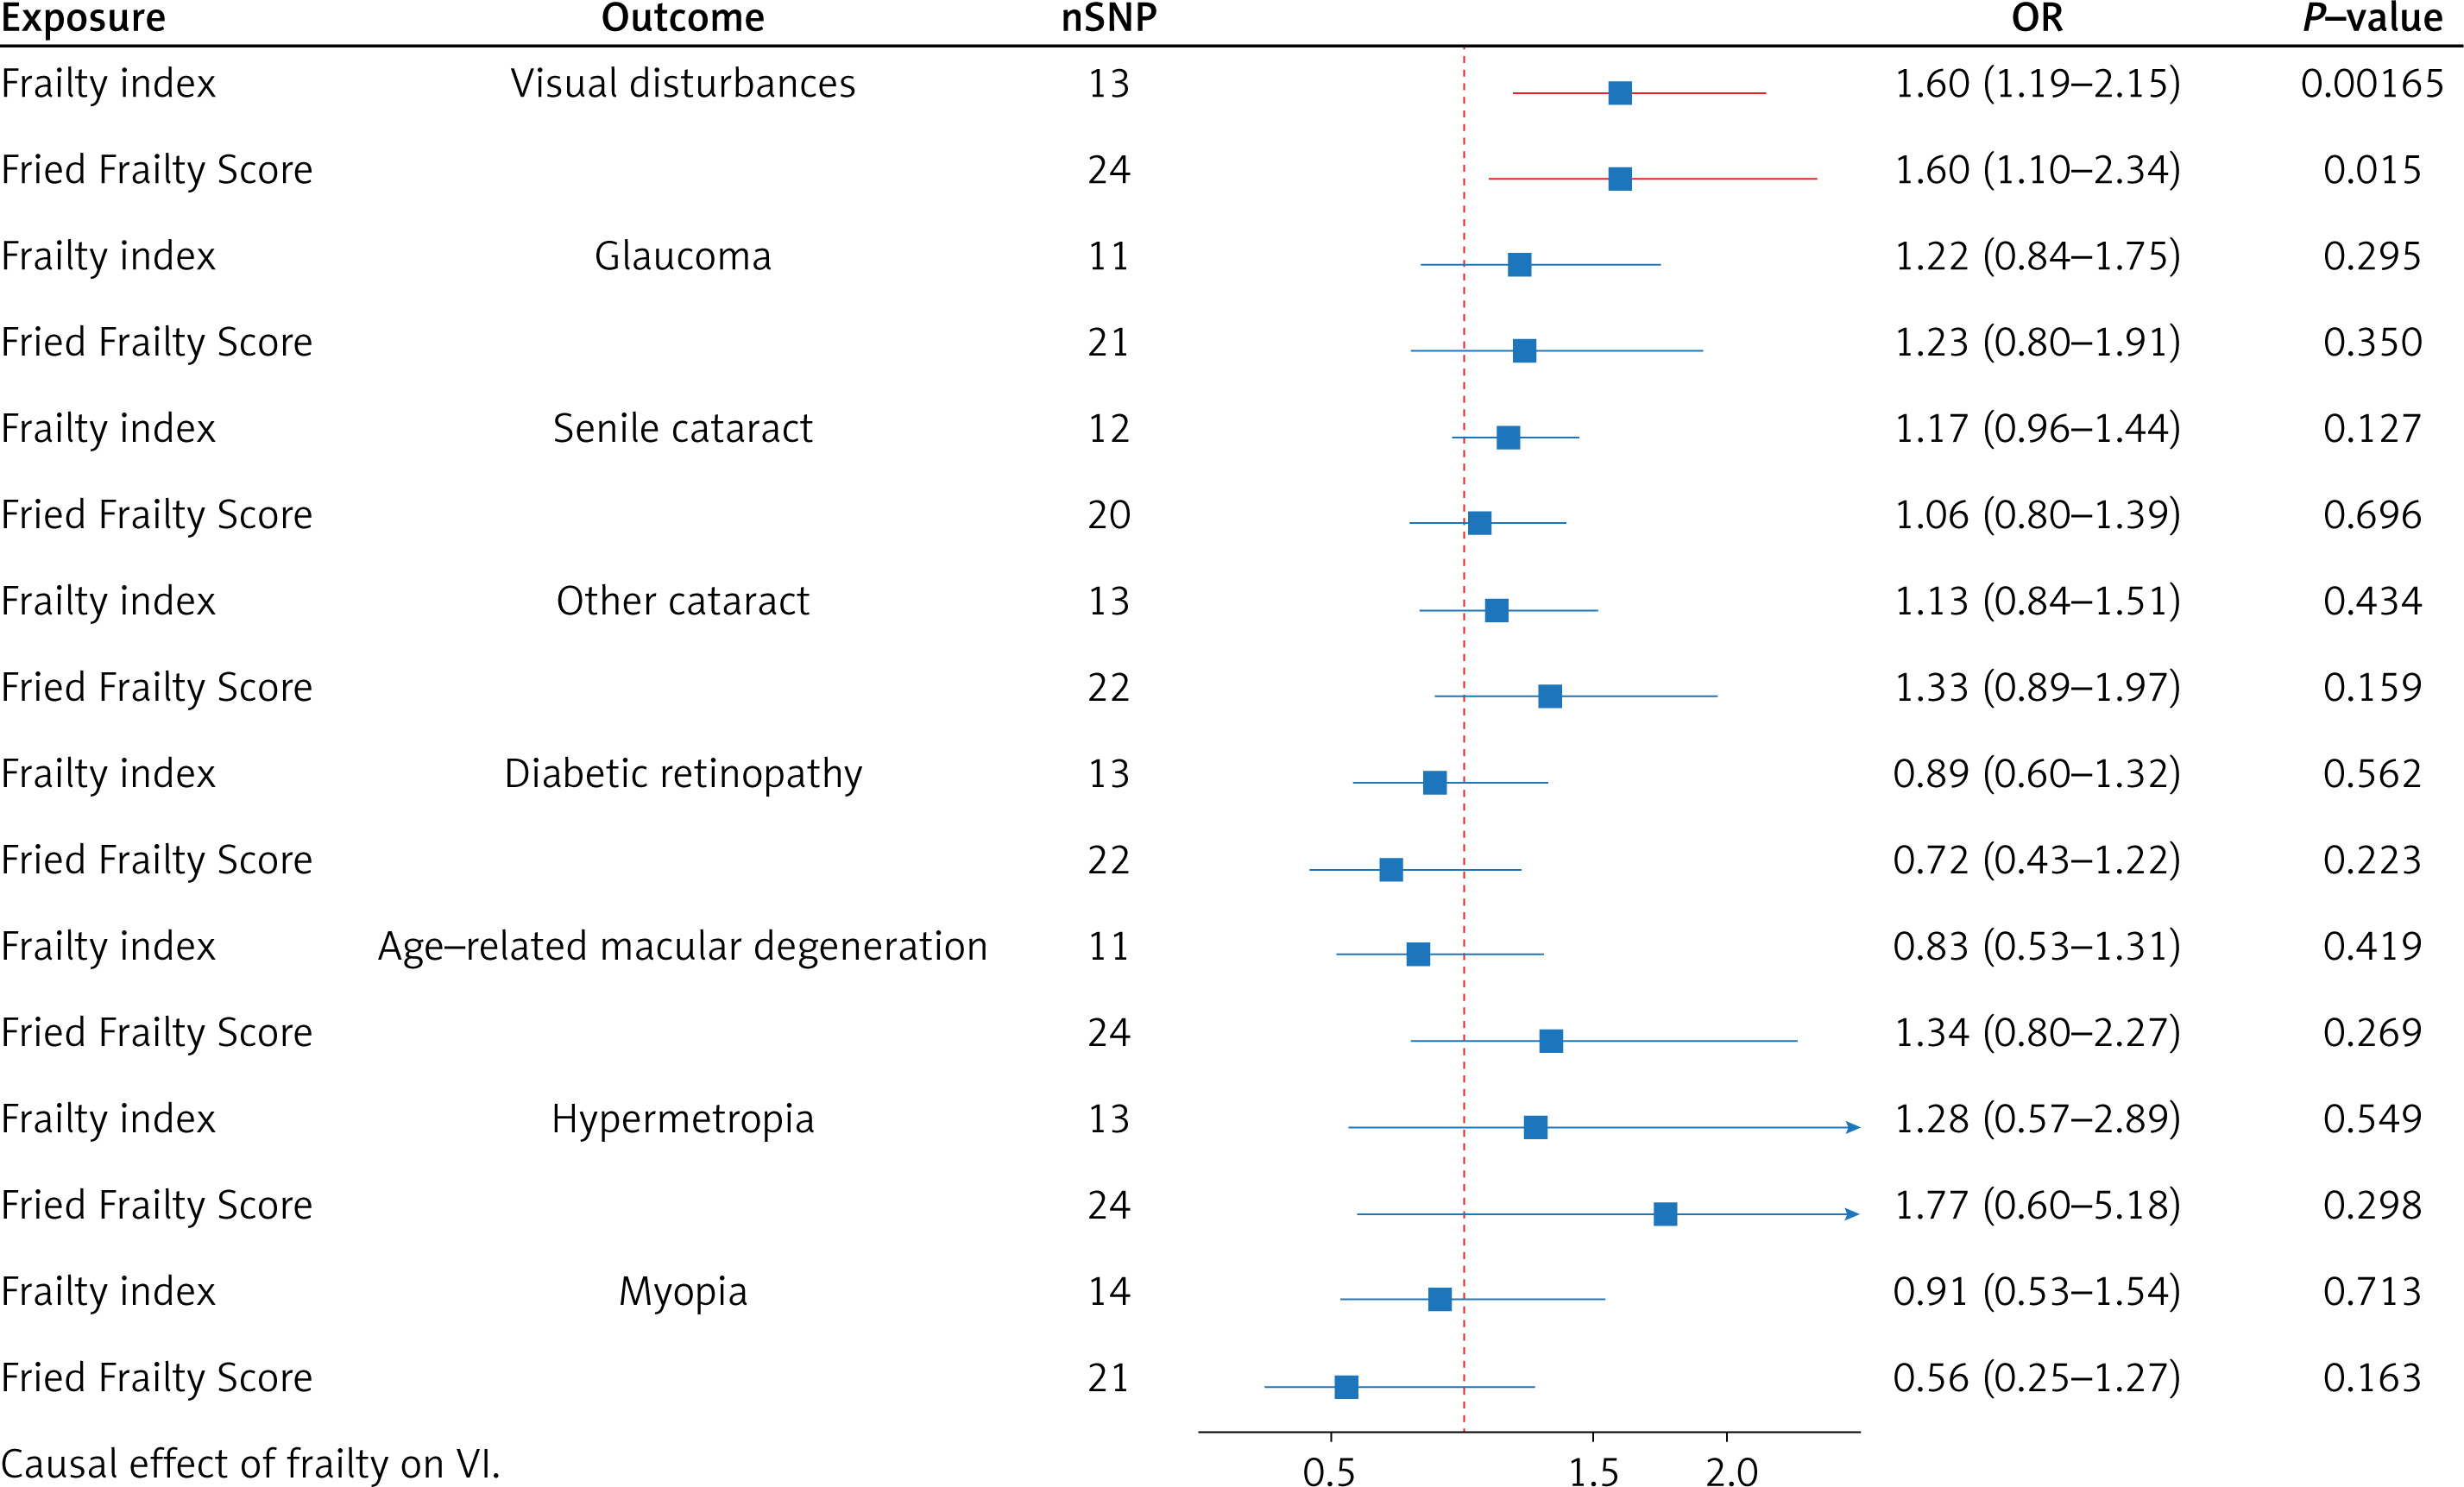
In the reverse analysis (Figure 3), we found evidence that FI (p = 0.00165, OR = 1.60; 95% CI = 1.19–2.15) and FFS (p = 0.015, OR = 1.60; 95% CI = 1.10–2.34) are associated with an increased risk of VI. Surprisingly, the susceptibility to VI in frail patients does not seem to manifest itself in the other seven VI characteristics, which suggests that frailty does not affect VI through these pathways.
Sensitivity analyses
Our research found no substantial indication of horizontal pleiotropy in these results, indicating that the IVs employed in this study were not influenced by any variables other than the exposures being examined. The durability of the results was evaluated by Cochran’s Q test, MR-PRESSO, and the MR-Egger intercept test.
LDSC
We used LDSC regression analysis to evaluate the genetic associations between eight visually impaired features and two assessments of frailty. As demonstrated in Table III, our research revealed significant genetic relationships among visual disturbances, cataracts, age-related macular degeneration, and frailty. Among these, there is no genetic association between senile cataract and FFS. Furthermore, there is a suggestive genetic association between myopia and FI.
Table III
Results of LDSC between VI and frailty
Discussion
This study is the first to investigate the genetic association and probable causative relationship between VI and frailty using GWAS summary statistics. The results of our study indicate strong genetic associations between visual disturbances, cataract, age-related macular degeneration, and frailty. There was also evidence of a genetic association between myopia and FI. In addition, our MR analysis revealed evidence of a causal relationship between several VI traits and frailty. These findings will facilitate our continued investigation into the correlation between VI and the aging process. Furthermore, it offers novel insights into the potential processes behind the initiation and progression of frailty. These methods are commonly used in genetic epidemiology to examine causal relationships and genetic correlations. Other tools, such as polygenic risk scores (PRS) and gene-environment interaction models, could further enhance the understanding of the complex genetic architecture of frailty and visual impairments.
Our results align with most existing literature, which shows that VI is associated with higher frailty. A long-term study of older adults found that those with VI were more prone to frailty than those without it, demonstrating a temporal relationship [8]. Other studies also suggest that VI in the elderly can lead to severe health problems [15]. Participants with VI but no frailty had twice the risk of developing frailty later, compared to those without either VI or frailty, even after adjusting for other factors [15].
Several mechanisms may explain the link between VI and frailty. In age-related muscle atrophy, sarcopenia, oxidative stress, chronic inflammation, and mitochondrial dysfunction play significant roles in frailty [41]. Chronic inflammation is a known cause of visual abnormalities, and older individuals with VI often experience higher oxidative stress levels [42, 43]. Additionally, mitochondrial dysfunction and disorders are associated with VI [44]. Severe VI is also associated with a higher prevalence of sarcopenia and frailty [45].
A vicious cycle may exist between VI and frailty. Frailty-related comorbidities such as diabetes and cardiovascular disease are associated with VI [46]. Moreover, both VI and frailty are associated with similar pathological processes, including inflammation [47]. Additionally, frail elderly individuals are at risk of social isolation due to reduced activity, which has been associated with VI [8, 48]. These factors may interact to create a harmful cycle.
This study found genetic correlations between some visual impairments and frailty but no significant causal relationships for others, such as hypermetropia or glaucoma. There are several possible explanations for these findings. Specific visual impairments such as glaucoma might influence frailty indirectly through processes like neurodegeneration, rather than directly affecting frailty-associated features. Also, our study primarily includes data from European populations, which may limit the ability to identify associations for certain illnesses due to a lack of genetic diversity. Ultimately, variations in frailty definitions and instruments (FI vs. FFS) may affect sensitivity to correlations [49]. FI and FFS are two widely used tools for assessing frailty, but they differ significantly in their approach. FI is based on the cumulative deficit model, which quantifies the ratio of health deficiencies, encompassing a wide range of symptoms, diseases, and functional impairments. This makes it a comprehensive and multidimensional assessment tool, ideal for evaluating long-term frailty progression. However, it requires substantial data gathering and is sensitive to subtle health variations. In contrast, FFS is based on a biological framework that assesses five physical criteria: unintentional weight loss, diminished grip strength, fatigue, reduced physical activity, and slow gait speed [50]. FFS is typically used for quick assessments of frailty, categorizing individuals into three groups based on the number of criteria met. The differences in the scope and sensitivity of these tools may influence the observed relationship between frailty and visual impairment, with FI offering a broader and potentially more nuanced assessment.
This research identified genetic associations and causal relationships between specific visual impairments (such as cataracts and diabetic retinopathy) and frailty, which have clinical significance. Early identification and intervention for treatable visual impairments, such as cataracts or diabetic retinopathy, may help reduce the risk of frailty in older individuals, improving their quality of life and autonomy. Ophthalmologists may consider frailty screening for visually impaired individuals. Secondly, multidisciplinary treatments aimed at at-risk persons (e.g., coordinated care between ophthalmologists and geriatricians) may assist in delaying or preventing the progression of frailty. Healthcare professionals may send elderly patients who are frail or have vision impairments to ophthalmologists. By using medication or surgery to address treatable VI, frailty may be reduced. Both vulnerable individuals and future screening standards will benefit from this. Furthermore, these findings underscore the necessity of regular visual function evaluations in frail individuals, as visual impairment may constitute an overlooked risk factor for frailty. Interventions targeting visual impairments may indirectly enhance frailty status and reduce associated negative outcomes, including falls, hospitalizations, and early mortality.
In spite of this, our investigation has some limitations. The GWAS data that we initially employed were primarily sourced from individuals of European descent. This focus on a homogeneous population limits the generalizability of our findings to other ethnic groups. Future studies should include more diverse populations to evaluate the consistency of the association between visual impairment and frailty across different racial and ethnic subgroups. Second, we only incorporated the eight most prevalent VI features due to the constraints of the non-overlapping samples and available IVs. Comprehensive data analysis is required to conduct a thorough examination of the relationship between frailty and VI. Third, we note that there are differences in the results obtained for different definitions of frailty. We believe that this is due to the VI influence pathway, which helps us explore the mechanisms involved. A more thorough structural analysis of frailty is therefore required to reveal the critical mechanisms that link frailty and VI. Finally, due to technical and data limitations, we could not conduct subgroup analyses by age, sex, or severity. Future research should include more diverse populations to assess how the relationship between visual impairment and frailty holds across different racial and ethnic subgroups.
In conclusion, in this study, we explored the genetic correlations and causal relationships between VI and frailty using MR and LDSC. Our findings revealed significant genetic correlations between specific VI subtypes and frailty and provided evidence of bidirectional causal relationships. Specifically, visual disturbances, other types of cataracts, diabetic retinopathy, and age-related macular degeneration increased the risk of frailty, while frailty also increased susceptibility to VI.
To summarize, this research provides evidence of genetic associations and causal effects between frailty and VI. Considering the fact that frailty and VI are often curable and interconnected illnesses, timely screening of elderly persons for VI and frailty can enhance their quality of life and minimize the course of disease and disability. Moreover, it is important to consider visual function as a potential risk factor for frailty and to regularly assess it in the context of geriatric care. Future research should stratify analyses by incorporating multiethnic cohorts, leveraging larger datasets with enhanced statistical power, and employing advanced methodological techniques. A more thorough investigation of the mechanisms of infirmity is crucial to discern the key pathways between visual impairment and infirmity.