Introduction
A prevalent inflammatory disease of the exocrine pancreas is known as acute pancreatitis (AP), which can lead to severe abdominal pain and multiple organ failure, which may cause pancreatic necrosis and persistent organ dysfunction [1, 2]. Overall, there are 34 cases per 100,000 people worldwide annually [1]. Although studies show that the incidence rate in Asia is now more stable, the incidence rate is rising globally [3, 4]. The course of AP is typically self-limited; approximately 20% of patients progress to develop severe AP (SAP), accompanied by failures of the kidney, liver, lung, and other vital organs, with a 30% death rate [5]. In addition to affecting patients’ prognoses, the incidence of SAP increases nursing costs [3, 6].
AP mortality and long-term sequelae are still severe even though the overall mortality rate has declined due to improved care for critically ill patients and precise and timely diagnosis, [3, 7]. It holds immense significance for clinicians to promptly and accurately assess the condition and prognosis of patients with AP. This enables them to provide more effective care and support.
The prognosis of AP has been assessed in the past few years using scoring systems, comprising acute physiology and chronic health evaluation scoring system II (APACHE II) and BISAP scores, as well as laboratory indicators, comprising glucose/lymphocyte ratios [8]. Nevertheless, a single laboratory index’s ability to predict performance may be affected by its accuracy fluctuations. In addition, although approximately 10 variables are involved, APACHE-II and BISAP scores need to be dynamically recorded, and their application in early forecasts is restricted. Thus, it is necessary to develop a high-accuracy predictive model when evaluating AP prognosis [9, 10].
Given the limitations of the current prediction models, a simple and accurate prediction tool is urgently required for predicting in-hospital mortality (IHM) in AP patients. Therefore, we collected demographic information, clinical factors, and laboratory data from the MIMIC-IV database, screened out the risk factors using LASSO regression for IHM, and developed a nomogram model for predicting the IHM of AP patients to better guide the clinic.
Material and methods
Data sources
Massachusetts Institute of Technology (MIT) Computational Physiology Laboratory developed the Medical Information Mart for Intensive Care-IV (MIMIC-IV version 1.0) database, an upgraded version of MIMIC-III with prior institutional review board approval. This public and freely accessible database was searched for the extraction of all information. The National Institutes of Health (NIH) provided us with access for retrieving the MIMIC-IV database when we completed a web course (certification number 33919478). Utilizing structure query language (SQL) with pgAdmin4 PostgreSQL 9.6, data extraction from the MIMIC-IV database was performed.
Study population
From the MIMIC-IV database, SQL with PostgreSQL (version 9.6 University of California, Berkeley) was utilized for the extraction of data linked to the unique HADM_ID of each patient. We obtained 1344 AP patients using the International Classification of Diseases 9th Edition (ICD-9) code 5770. We only kept data on the patients’ initial ICU admission for those patients who had multiple admissions. The exclusion criteria for the patients were age < 18 years and lack of clinical records. Finally, 1030 patients were enrolled in this research.
Data collection and outcomes
The MIMIC IV was searched to extract ICU patients’ baseline characteristics, comprising demographic information (sex, age, ethnicity, etc.), vital signs (temperature, heart rate (HR), respiratory rate (RR), and mean blood pressure (MBP)), laboratory test indicators (oxygen saturation (SpO2), red cell volume distribution width (RDW), international normalized ratio (INR), glucose, prothrombin time (PT), haematocrit, haemoglobin, total bilirubin (TBIL), platelets (PLT), alkaline phosphatase (ALP), aspartate aminotransferase (AST), white blood cells (WBC), alanine aminotransferase (ALT), creatinine, blood urea nitrogen (BUN), etc.), fluid balance (sodium, phosphate, calcium, anion gap, potassium, etc.), medical history (congestive heart failure (CHF), liver disease, malignant cancer, chronic pulmonary disease, etc.), and relevant scores (Bedside Index of Severity in Acute Pancreatitis (BISAP), Simplified Acute Physiology Score II (SAPS II), etc.). Furthermore, the extraction of the application of vasopressors, mechanical ventilation, and renal replacement therapy was done.
The outcome in this cohort was the IHM of AP patients. The duration of the follow-up was the full hospital stay. In the event of a patient’s death during hospitalization, follow-up was terminated. The study included 1030 patients in total for analysis. Among them, 138 died while they were hospitalized.
Statistical analysis
Statistical analysis was conducted employing R version 4.2.1 (R Foundation for Statistical Computing) and SPSS Statistics26.0 for Windows. Variables with missing values of more than 15% were eliminated, and the expectation-maximization algorithm was used to replace variables with missing values of less than 15%. The Mann-Whitney U test and the χ2 test were conducted for bivariate analysis for continuous and ordinal distributed variables, respectively. The 1030 patients with AP were randomly divided using the R caret package into two sets: a training set comprising 734 patients and a validation set comprising 296 patients for external validation. This was done in accordance with the theoretical 7 : 3 ratio. To screen predictors of IHM, the least absolute shrinkage and selection operator (LASSO) expression was utilized [11]. For the cross-validation outcomes, we chose lambda.1se to investigate the final candidate variables.
Using the area under the receiver operating characteristic (AUROC) curve, the discrimination was quantified. The unreliability U test was utilized for evaluating the calibration curve. For generating the nomogram and calibration curve, the ‘rms’ package was utilized. In the validation data set, by quantifying the net benefits at distinct threshold probabilities, decision curve analysis (DCA) was carried out to investigate the nomogram’s clinical usefulness. All statistical tests were two-sided, and p-values < 0.05 determined the significance level.
Results
Baseline characteristics of the patients
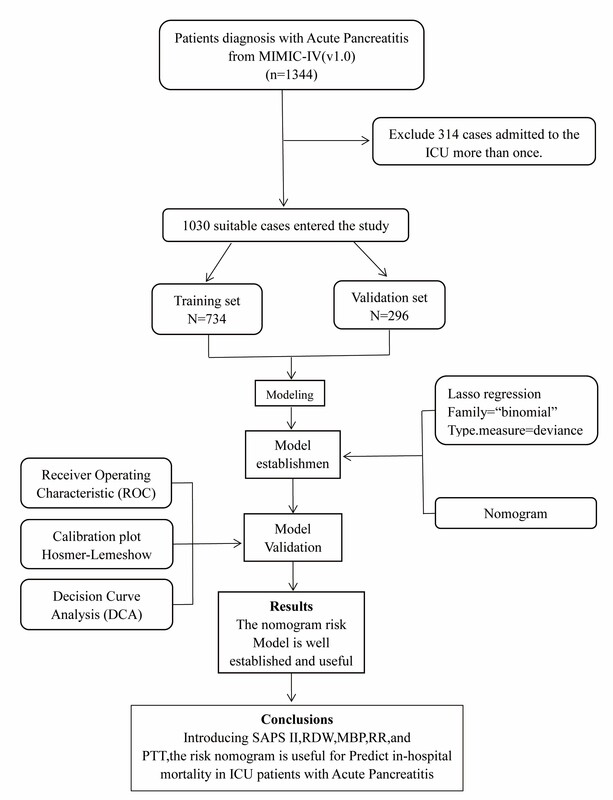
We included 1030 patients with AP in this research after applying the inclusion and exclusion criteria to the data set (Figure 1). Table I lists the participants’ clinical and demographic characteristics.
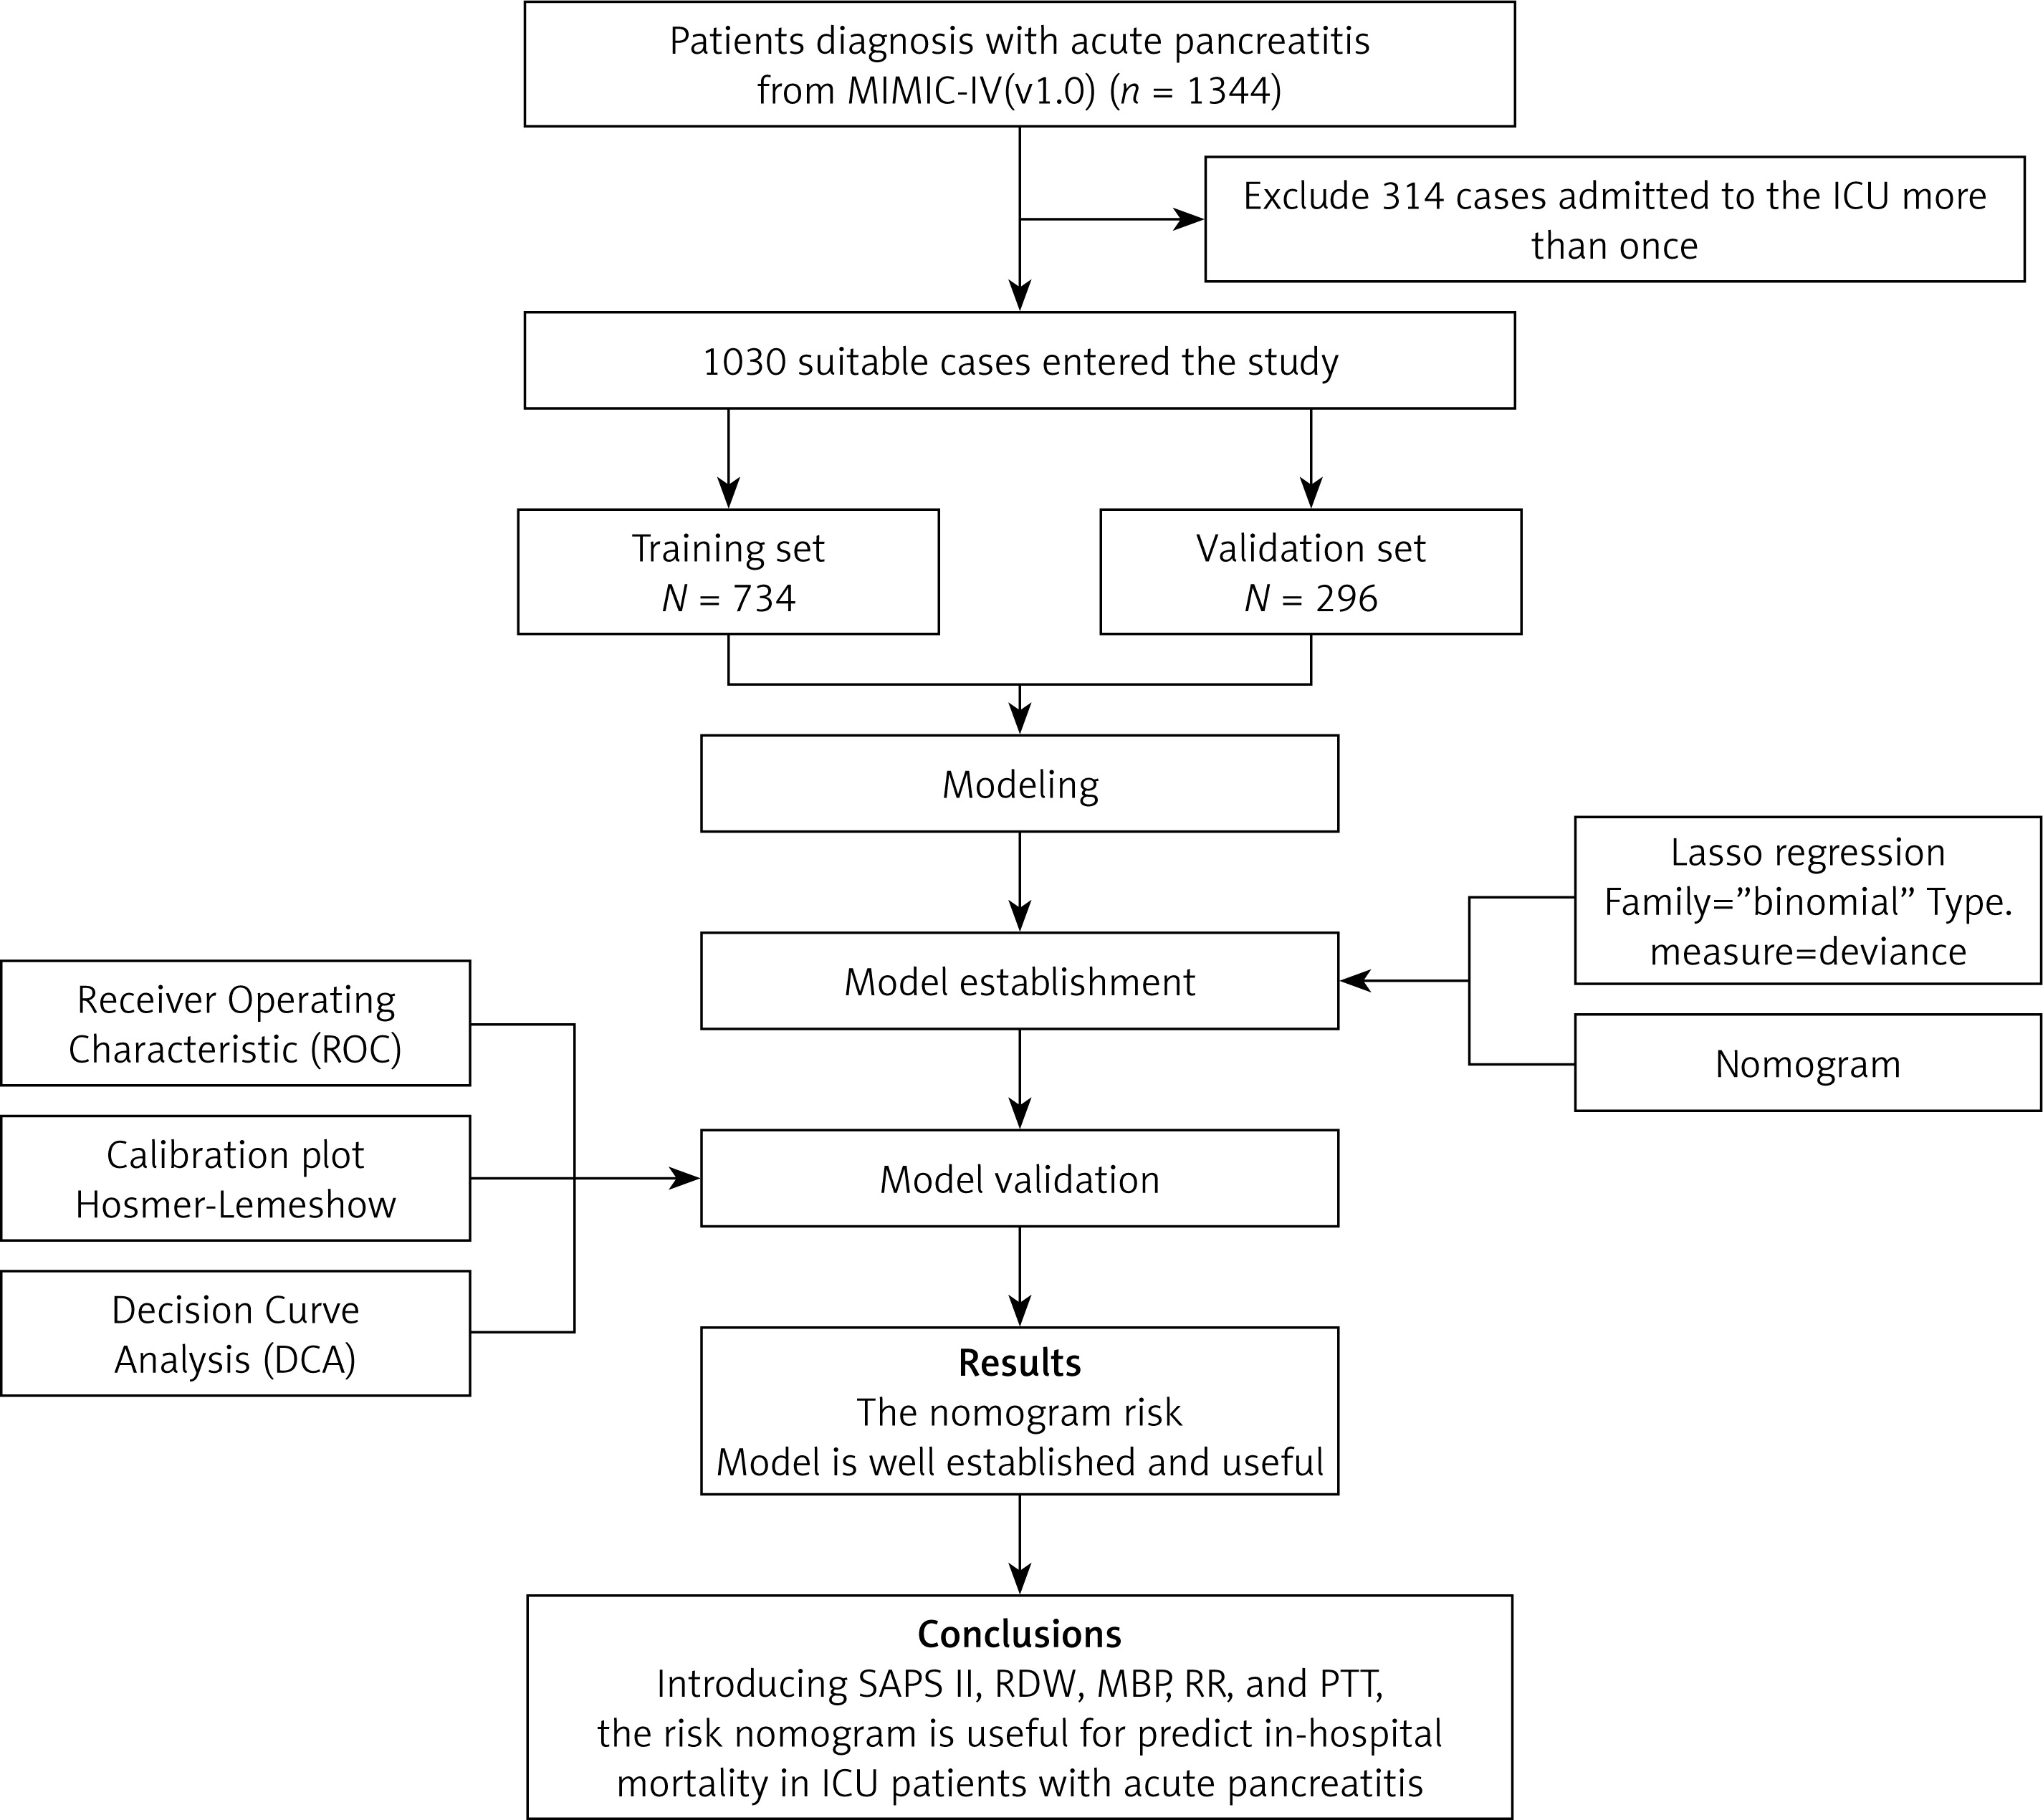
Table I
Demographic and clinical characteristics of patients
Characteristics selection and development of a nomogram
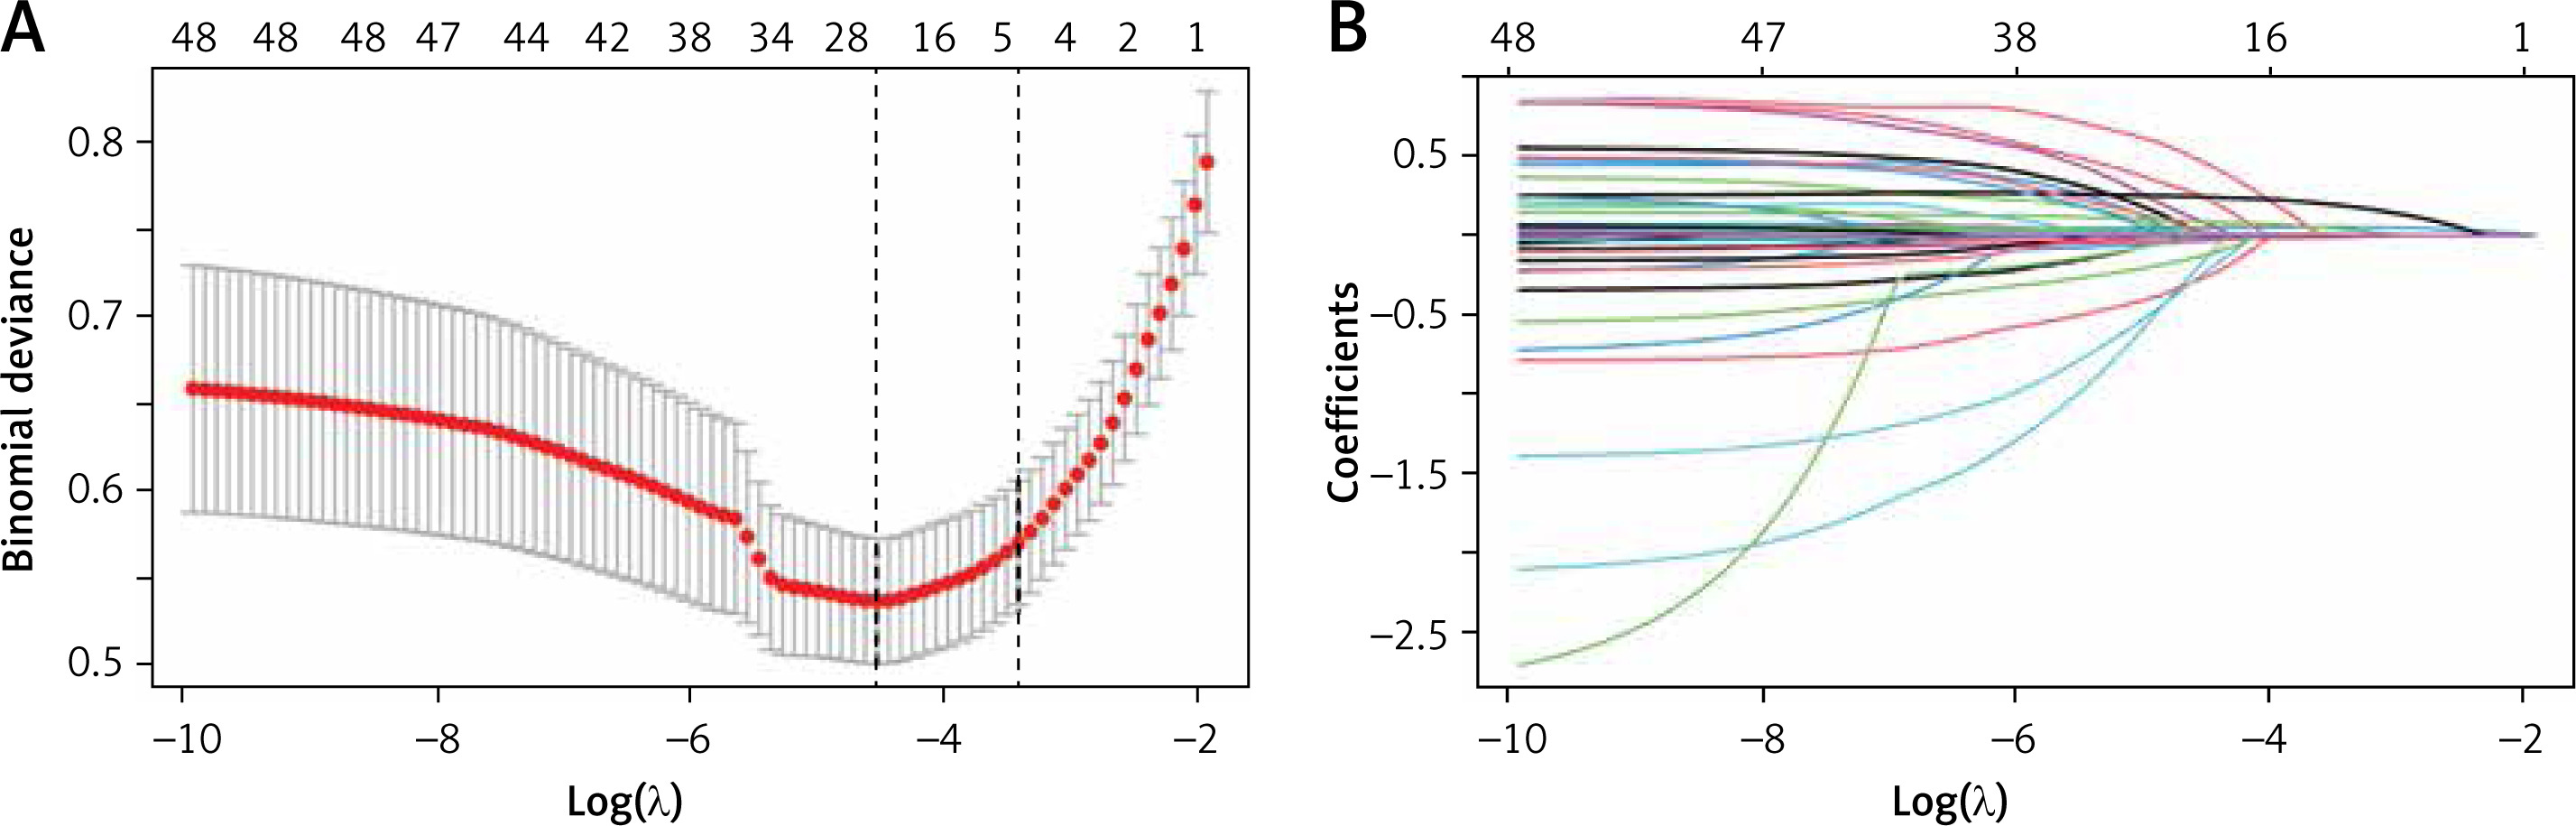
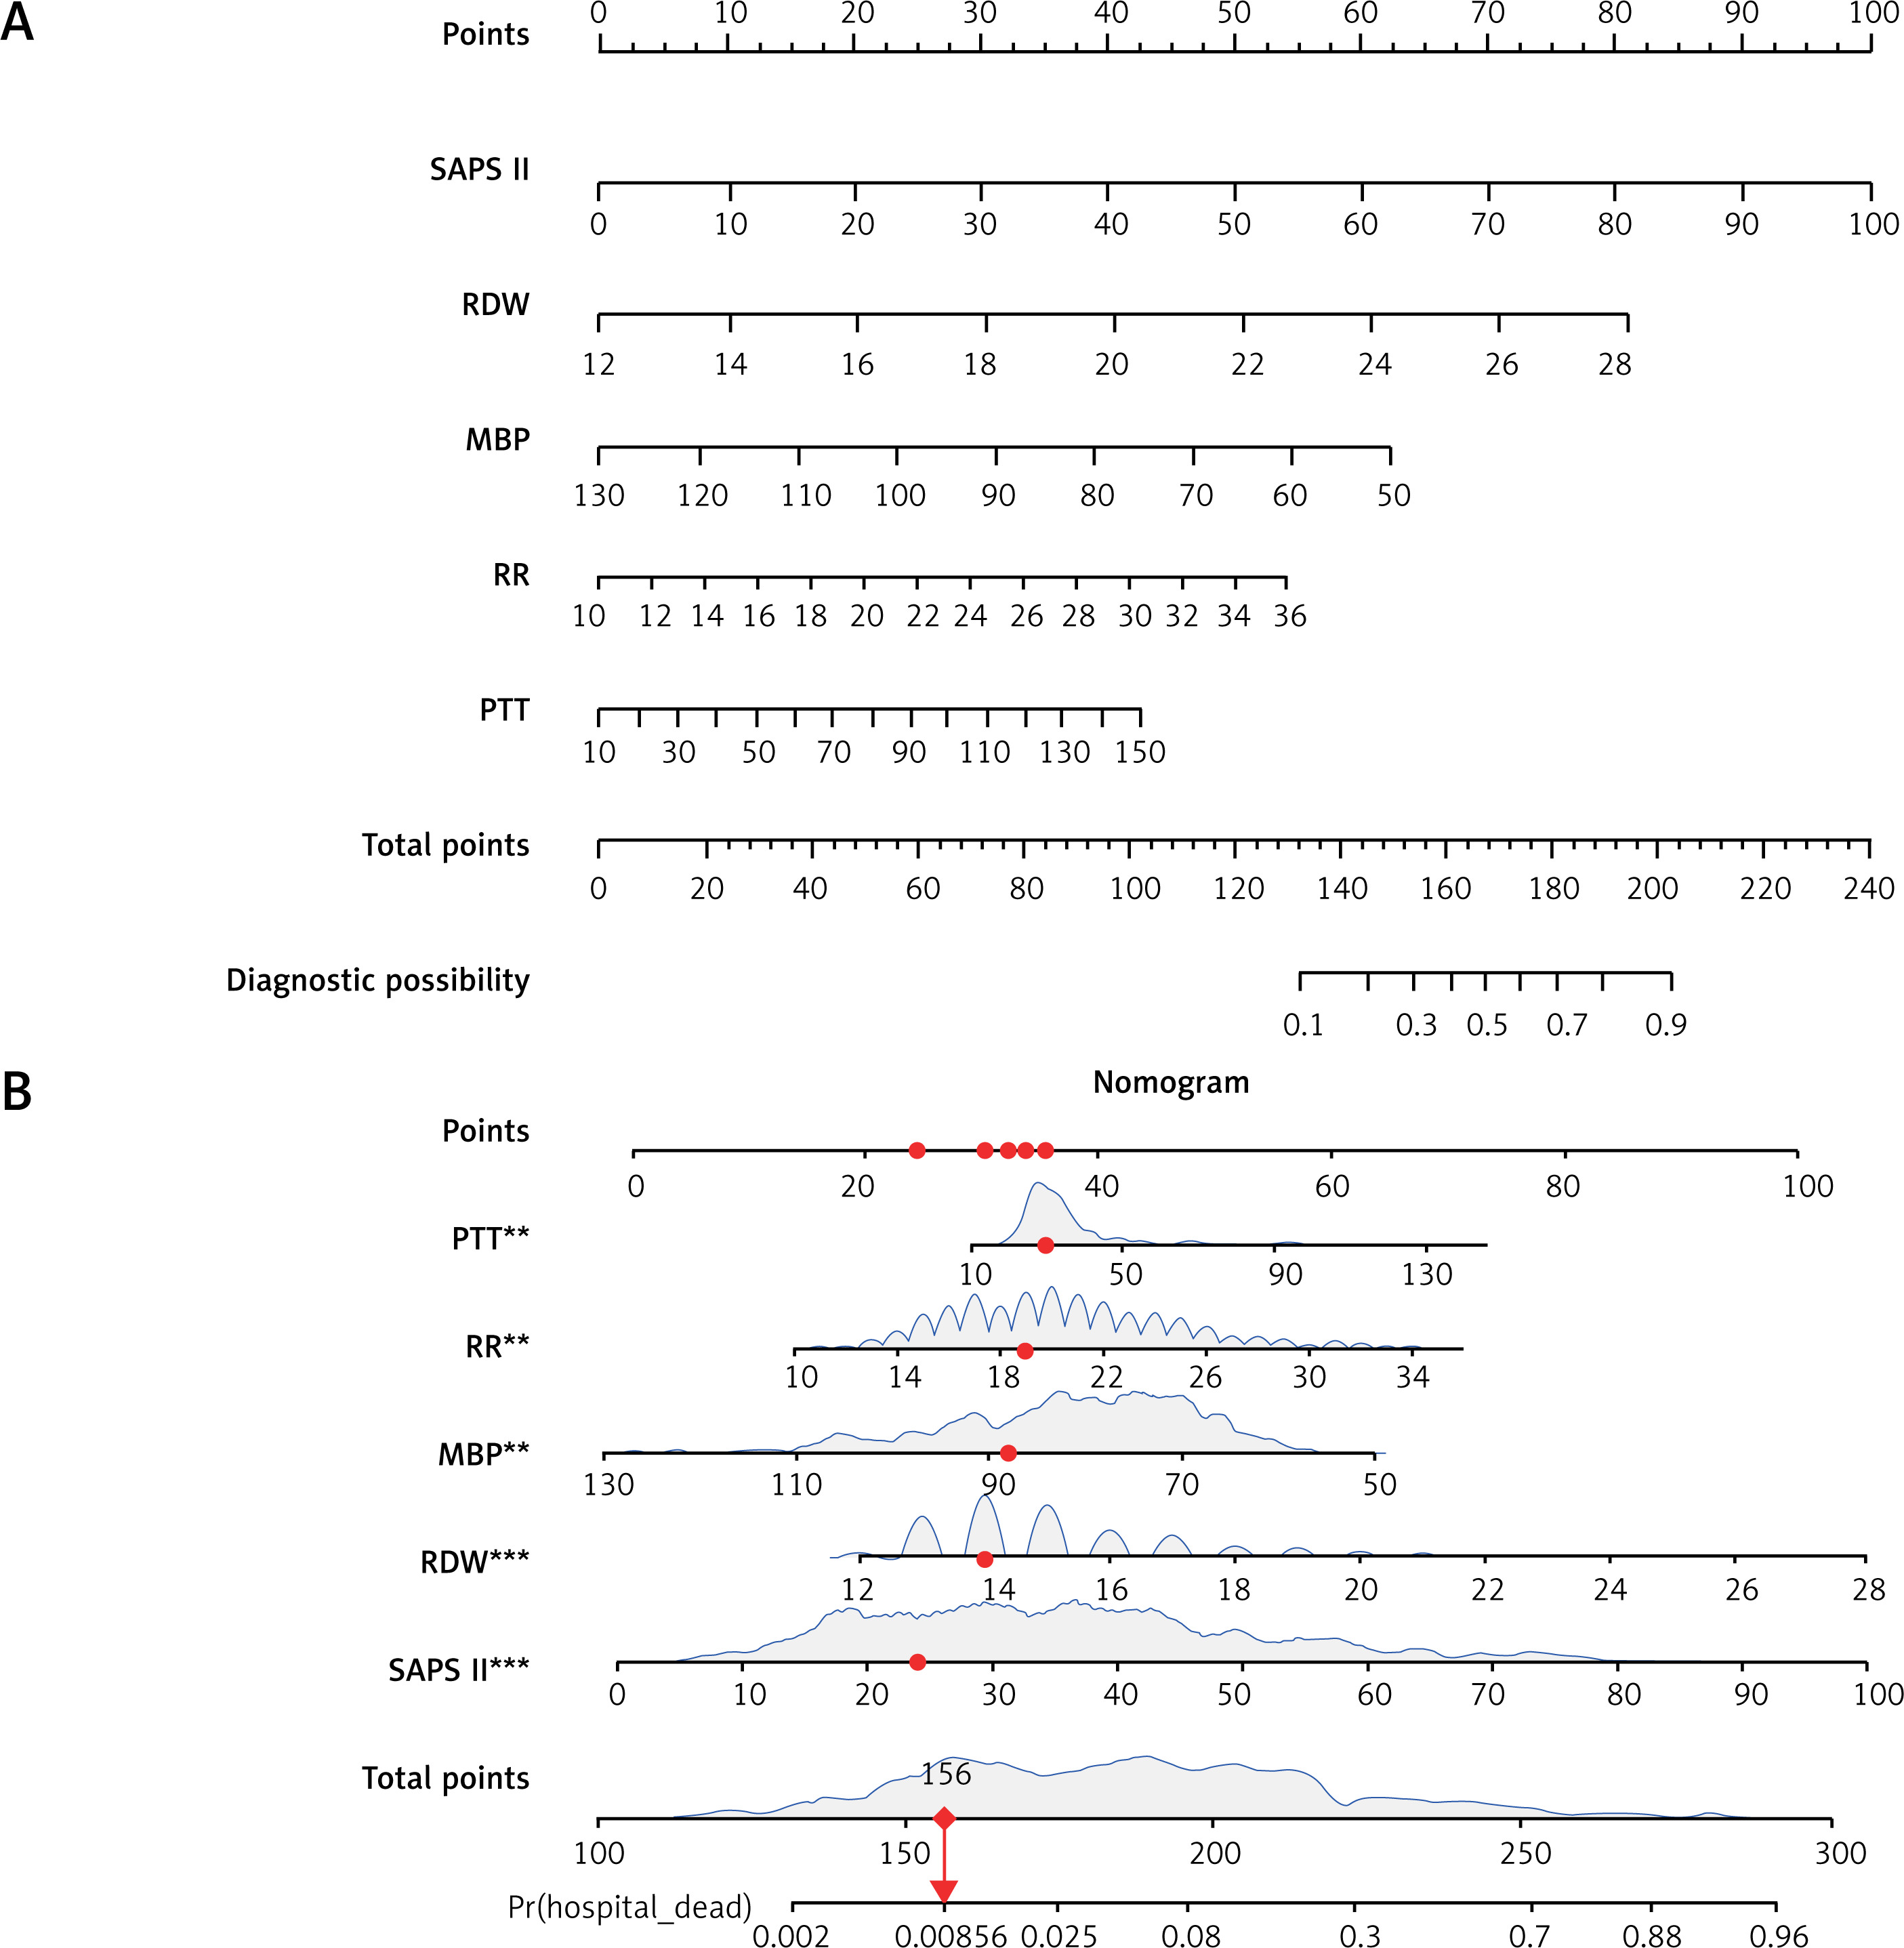
In this study, the development group was subjected to LASSO regression. The gradual reduction in the model’s variables was observed with the change in the penalty coefficient λ. The model’s optimal value was finally selected to be the 10-fold cross-validation error, which was chosen as the minimum λ+1 (lambda.1se = 0.03993078) (Figures 2 A, B). Moreover, we obtained 5 variables: SAPS II, RDW, MBP, RR, and PTT. We developed a nomogram for predicting IHM in ICU patients with AP using this model (Figure 3 A). For instance, utilizing the nomogram model, a male AP patient, with a SAPSII of 23, an RDW of 14, an MBP of 88 mm Hg, an RR of 22/min, and a PTT of 33 s, had an estimated IHM of 0.85% (Figure 3 B).
Figure 2
Clinical variables were selected using the lasso logistic regression model. A – Optimal parameter (l) selection in the LASSO model used fivefold cross-validation via minimum criteria. The partial likelihood deviance (binomial deviance) curve was plotted versus log(l). Dotted vertical lines were drawn at the optimal values by using the 1 SE of the minimum criteria (the 1-SE criteria). B – LASSO coefficient profiles of the 47 features. A coefficient profile plot was produced against the log(l) sequence. A vertical line was drawn at the value selected using tenfold cross-validation, where optimal l resulted in five features with nonzero coefficients
Performance of the nomogram model
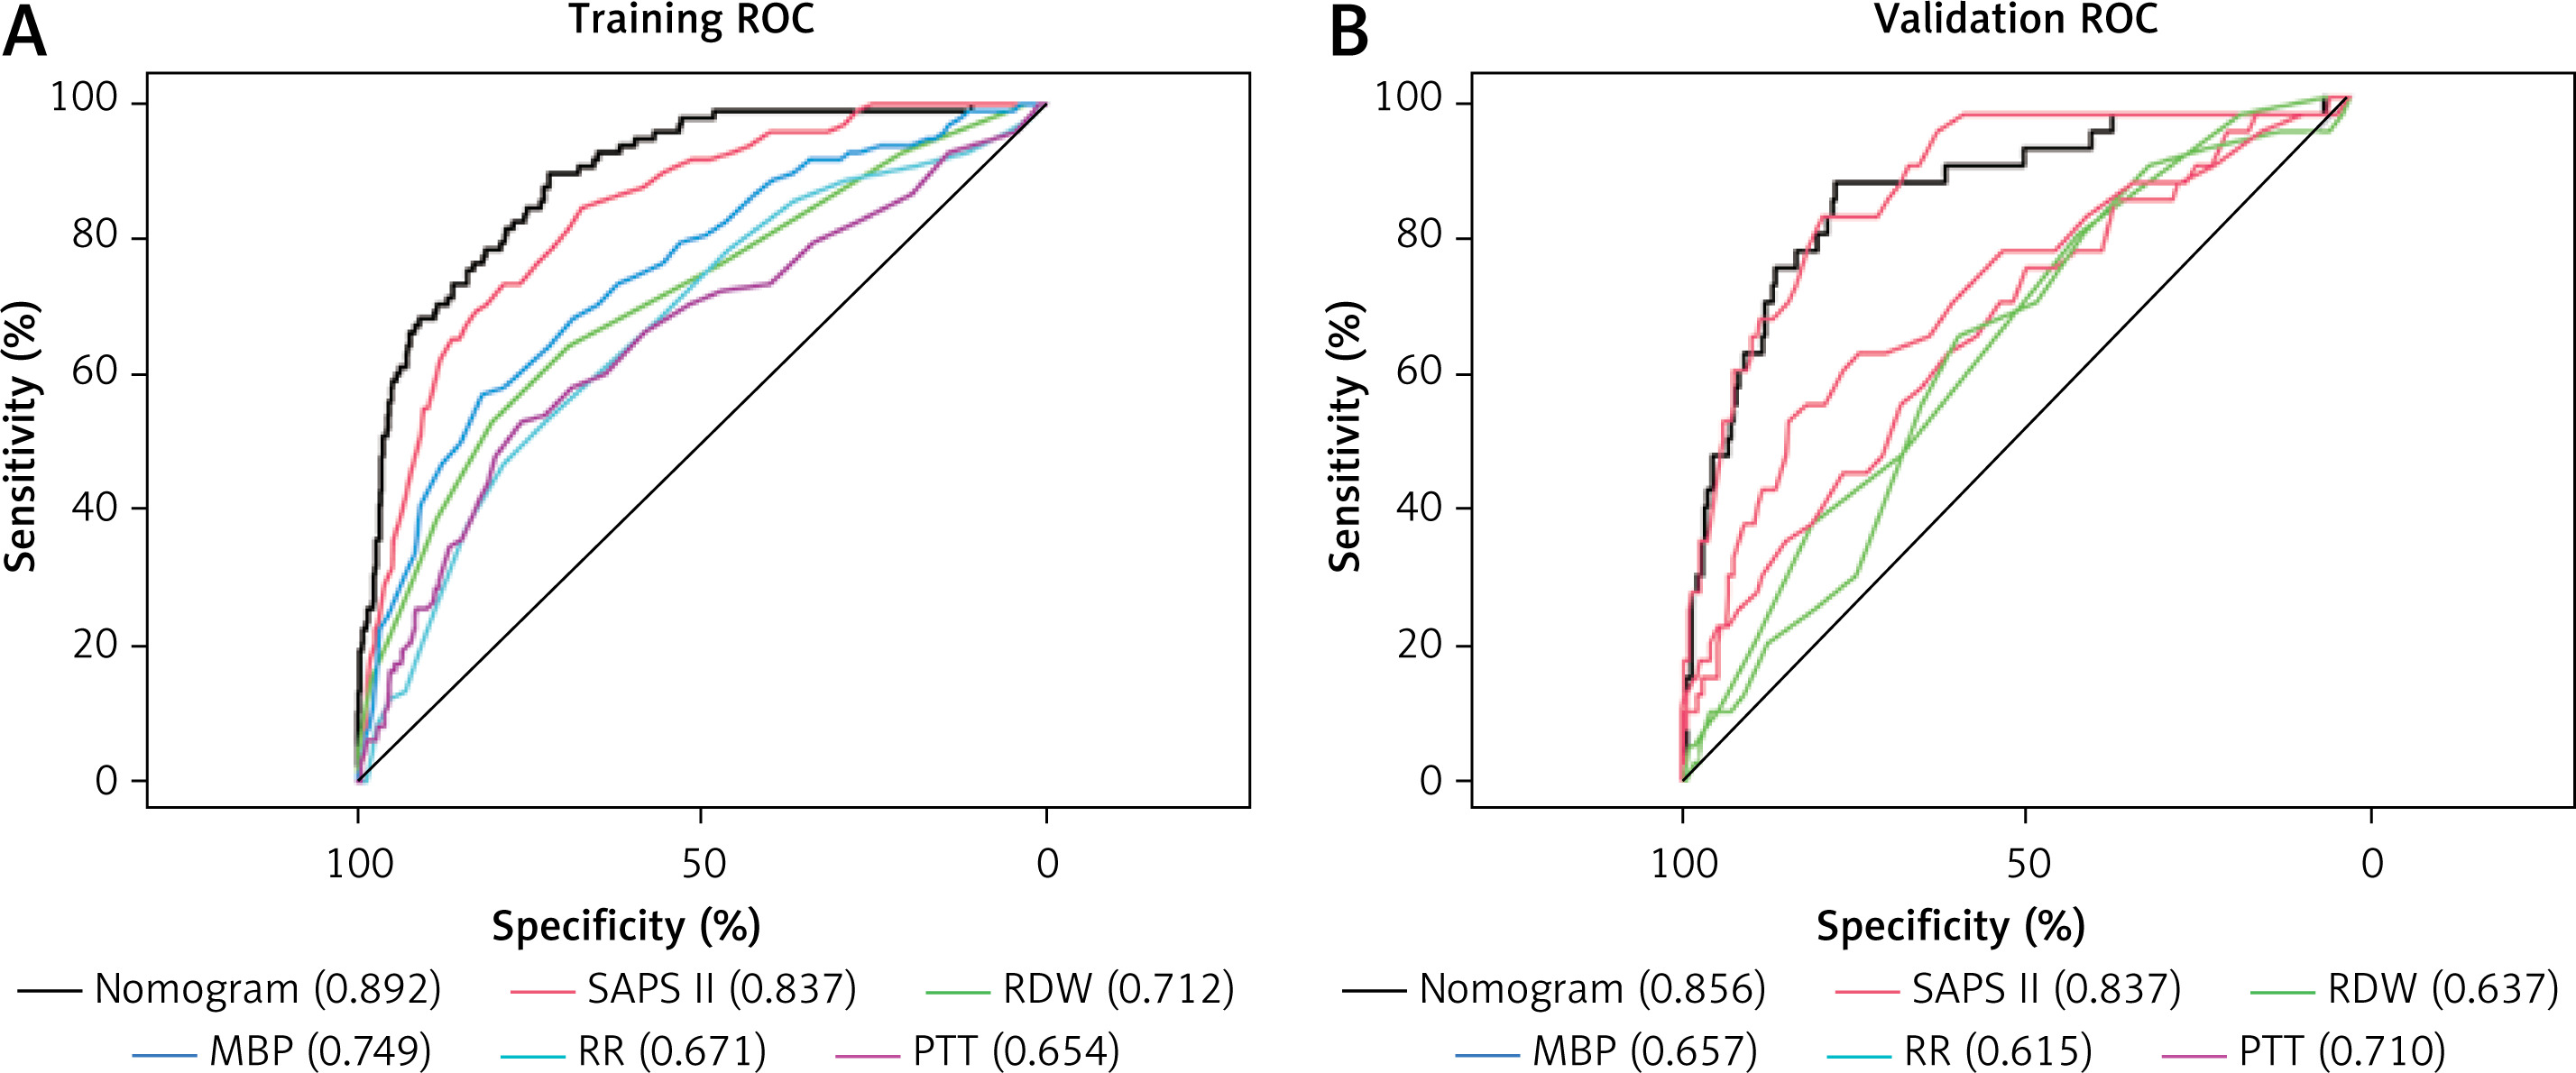
We first employed AUROC (Figure 4 A) to assess the nomogram’s predictive performance, and in the training set, we discovered that the AUROC of our nomogram was higher in contrast with SAPS II (0.892 vs. 0.837), RDW (0.892 vs. 0.712), MBP (0.892 vs. 0.749), RR (0.892 vs. 0.671), and PTT (0.0.892 vs. 0.654); and in the validation set, AUROC of nomogram was higher in contrast with RDW (0.856 vs. 0.637), MBP (0.856 vs. 0.657), RR (0.859 vs. 0.615), and PTT (0.0.856 vs. 0.710); but similar to SAPS II (0.892 vs. 0.856) (Figure 4 B). The distinction in AUROC between SAPS II scores and the nomogram model was examined using Delong’s test. In the training set, the AUROC between SAPS II and the nomogram was Z = 3.924 (p < 0.001). The AUROC between SAPS II and the nomogram was Z = –0.57006 (p = 0.5686) in the validation set. The nomogram showed an AUROC curve that was substantially higher in the training set when in contrast with the SAPS II scores. Nevertheless, it dropped significantly in the validation set.
Figure 4
ROC curve and AUROC of the nomogram, SAPS II, RDW, MBP, RR, and PTT in the training set (A) and validation set (B). The AUROC of the nomogram was larger than that of SAPS II, RDW, MBP, RR, and PTT in the training set. The AUROC of the nomogram was larger than that of RDW, MBP, RR, and PTT in the validation set but similar to that of SAPS II
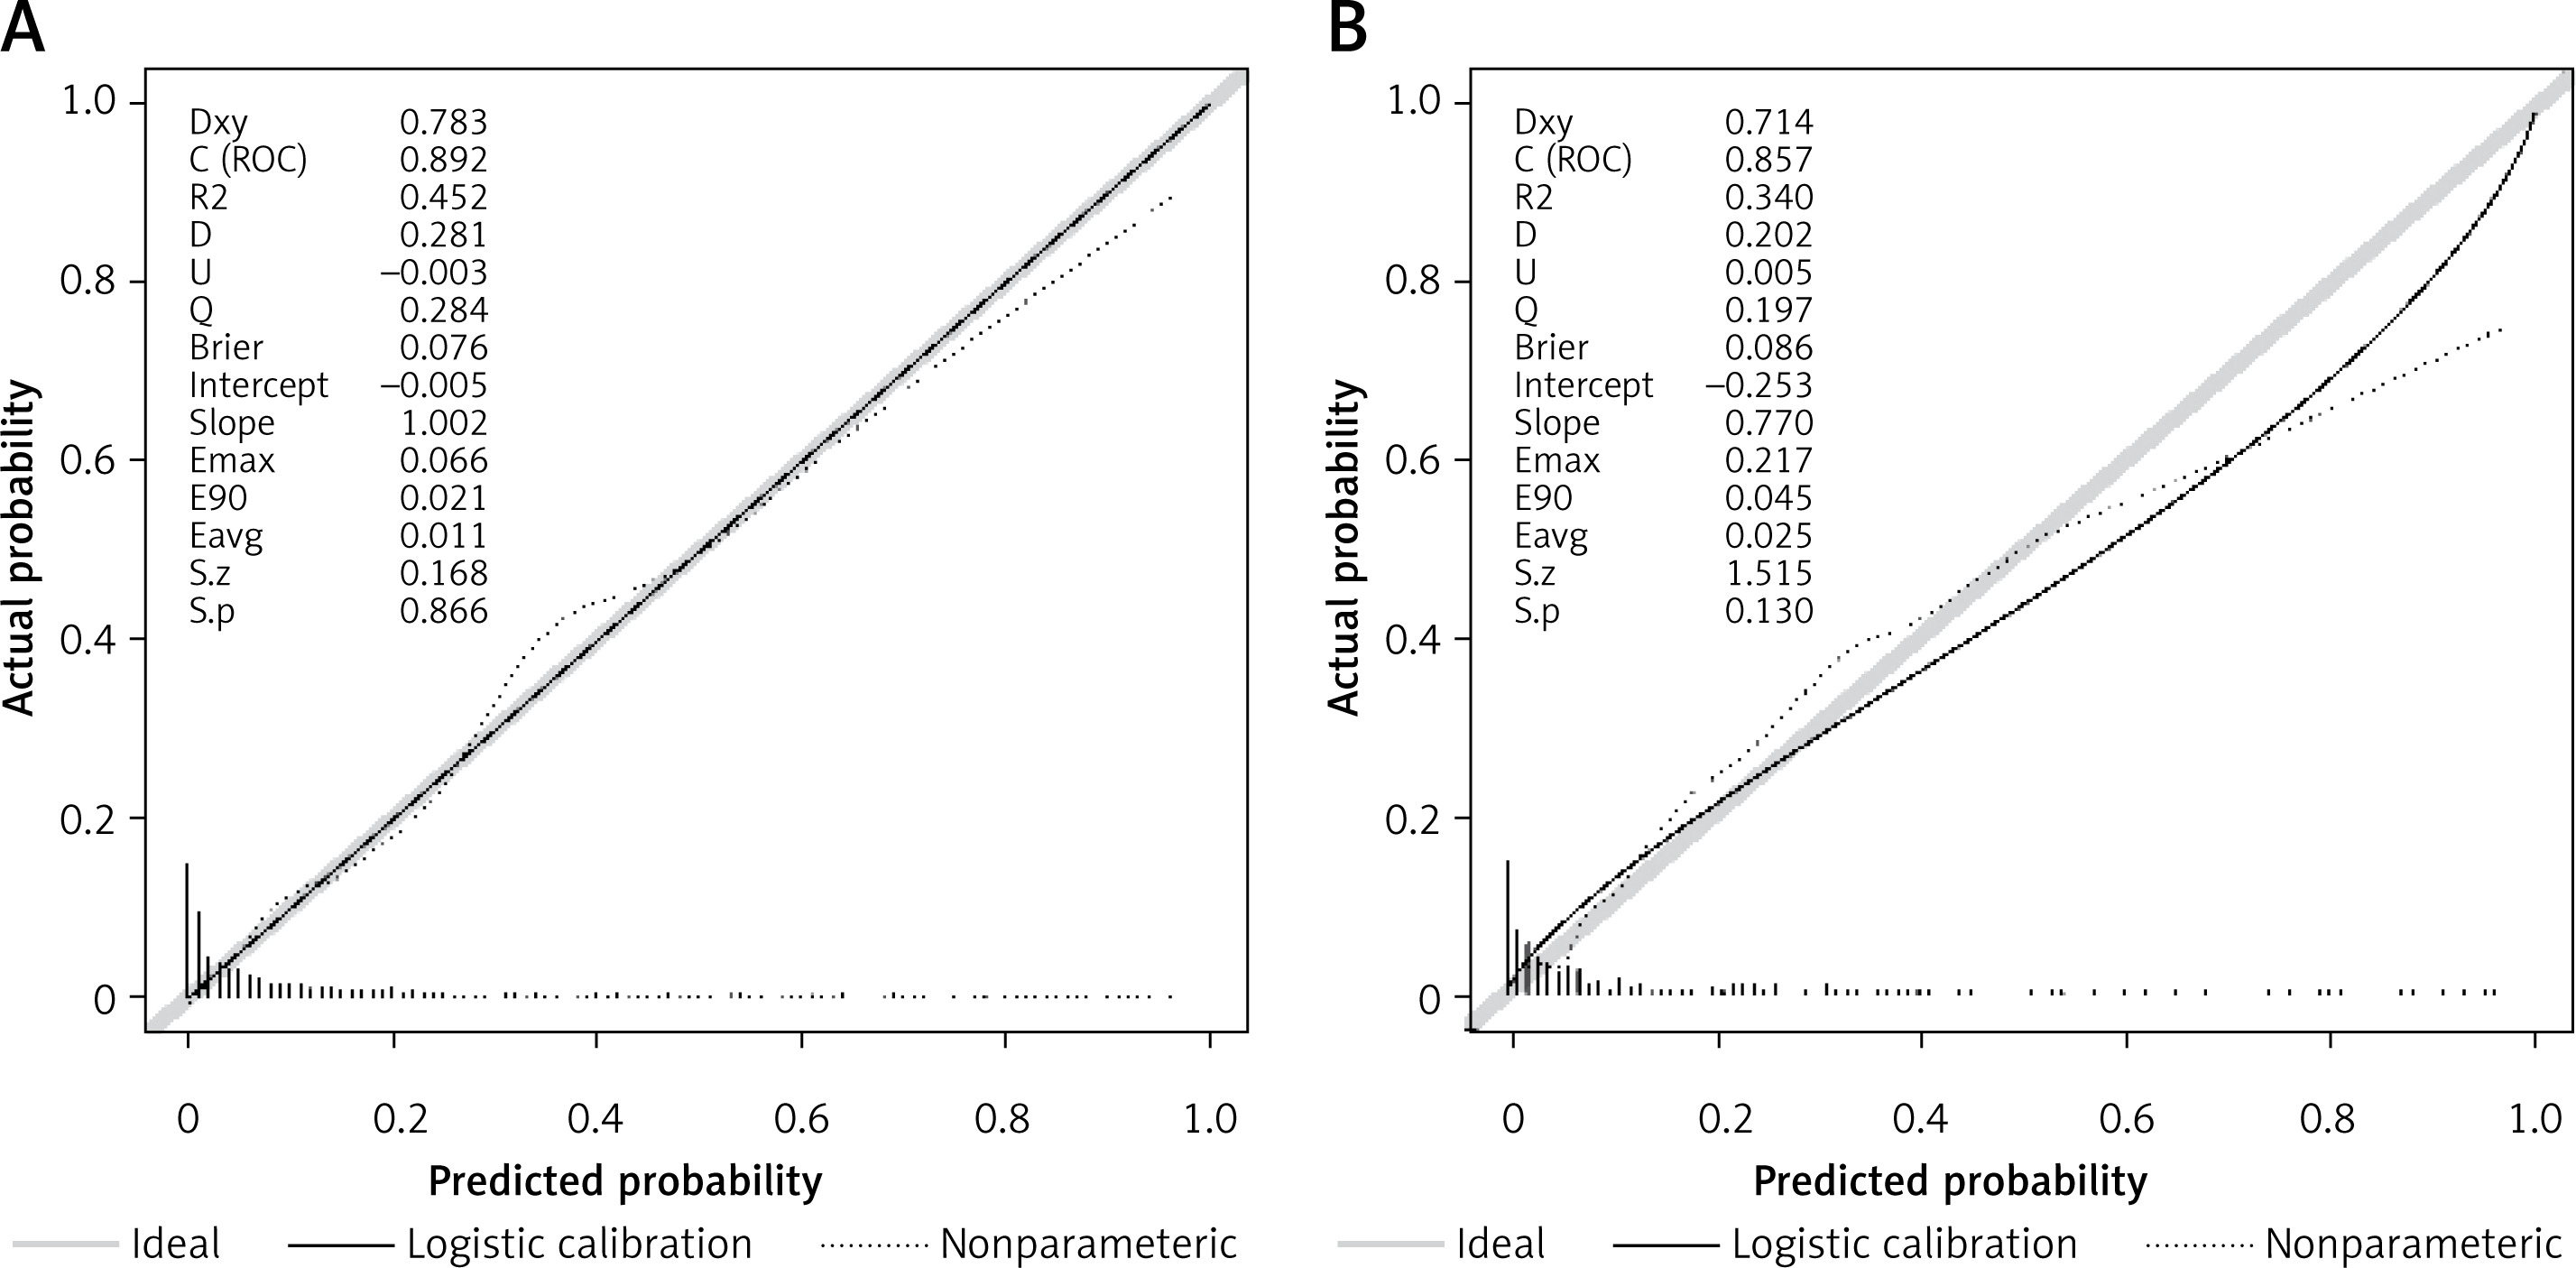
Employing the HL test and a calibration curve, the calibration of the predictive model was done. The predictive model and validation set displayed an outstanding degree of fit from the calibration curves (Figures 5 A, B). The HL test revealed that there was excellent consistency between the predicted and actual probabilities (training set, p = 0.73; validation set, p = 0.598).
Clinical application of the nomogram
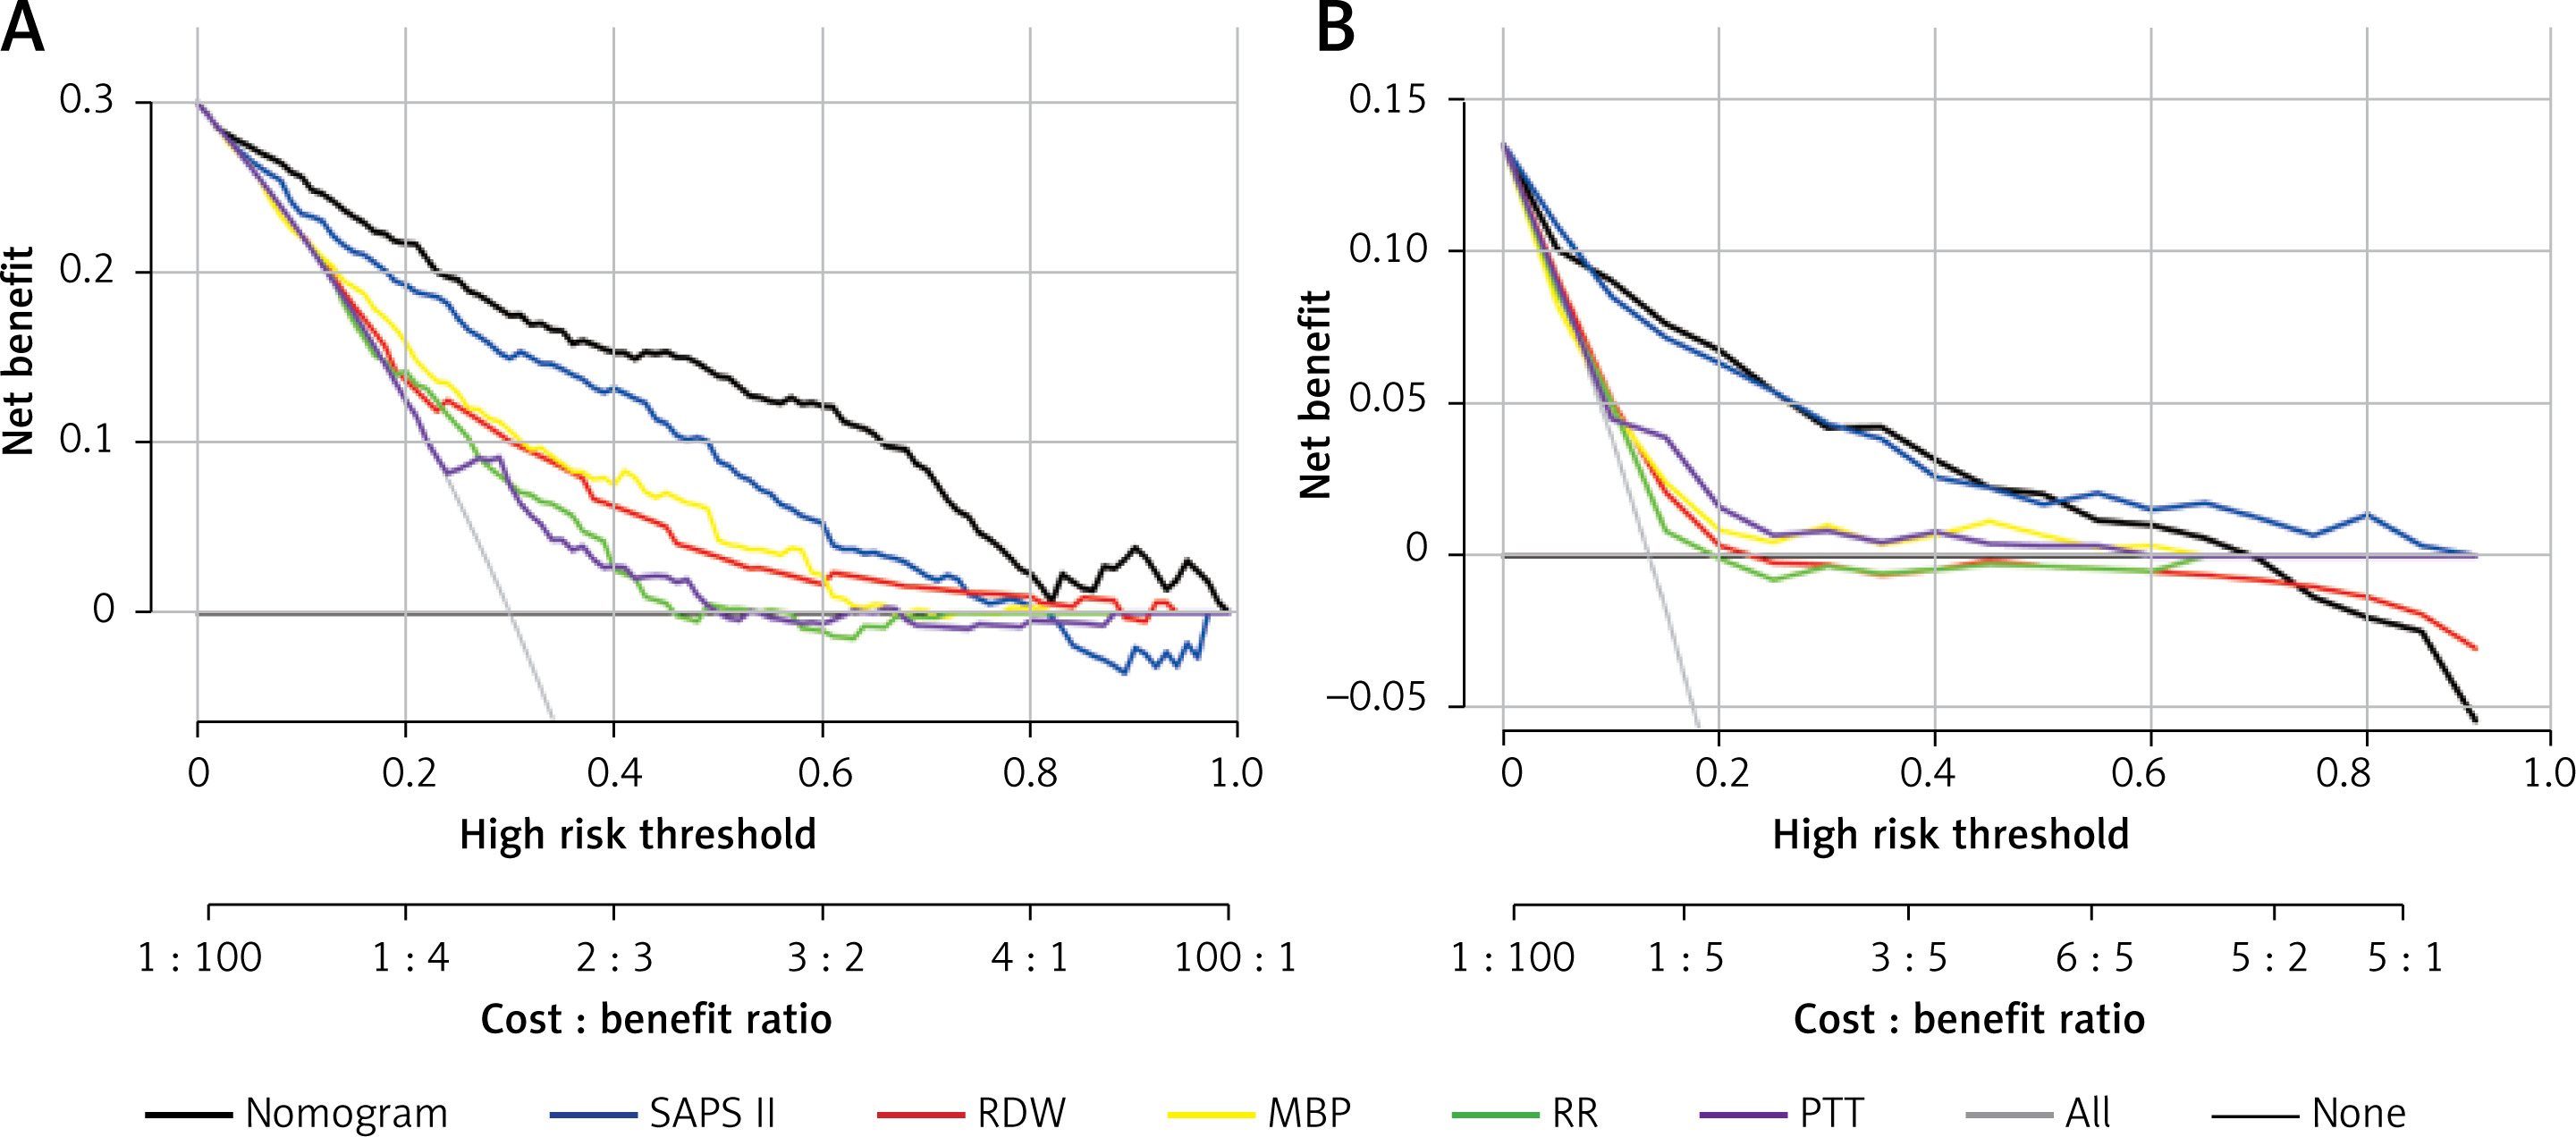
DCA was employed to assess the nomogram’s clinical application with SAPS II, RDW, MBP, RR, and PTT used as the reference. In the training set, when the threshold probability was between 0.01 and 0.98, a clinical intervention directed by this nomogram offered greater net benefit (Figure 6 A). In the verification group, the analysis shows that when the threshold probability was more than 0.01, utilizing the nomogram for predicting IHM provided a net benefit similar to the SAPS II score (Figure 6 B).
Discussion
The independent risk factors for predicting IHM in AP patients were screened in this research by LASSO regression, including SAPS II, RDW, MBP, RR, and PPT. To construct a predictive model for IHM that performs better than existing models and has greater clinical relevance, the 5 independent variables were used.
In 1984, the SAPS II scoring system was first introduced as a substitute for the APACHE scoring system [12]. The SAPS II score was calculated using the worst of the 12 routine physiological measurements within 24 h before admission, data about past health status, and some information gathered at admittance. There is a sigmoidal relationship between the SAPS II score and mortality rate. Previous studies have reported the varying performance of these scoring systems in predicting hospital mortality [13–15]. Other studies on different patient populations validated SAPS II as a sound prediction scoring system [16, 17]. Previously, for predicting the survival duration of patients with SAP, some scholars have included the SAPS II score in the prediction model [18]. We also incorporated the SAPS II score into our model and combined it with other risk factors to achieve a better predictive ability.
Currently, there are several clinical indicators used to predict the prognosis of AP, such as RDW [19–21]. Many studies have shown that RDW is convenient, economical, and reliable in clinical operation and is a good predictor of AP and its mortality. Senol et al. [22] studied the correlation between RDW and mortality in 102 AP patients and found that RDW had a good discriminant effect on mortality (AUC = 0.817, 95% CI: 0.689–0.946). Mortality could be correctly predicted in approximately 77% of patients with a cut-off value of 14.8 for RDW. Our study found that the RDW values of IHM were more remarkable than 14.8 in both the training and validation sets. This result is consistent with previous studies. When inflammation occurs in the body, oxidative stress and inflammatory factors shorten the life span of red blood cells (RBCs), inhibit the maturation of red blood cells, stimulate immature RBCs to release and enrol, and change the glycoproteins and ion channels on the erythrocyte membrane, resulting in changes in the morphology of red blood cells and finally leading to changes in RDW [21–23]. Therefore, RDW can serve as an indicator of inflammation severity in AP and potentially aids in the early prediction of AP severity.
Maintaining a certain MBP in patients with AP is particularly important [24]. Early insufficient tissue perfusion is the leading cause of pancreatic necrosis and multiple organ dysfunction. Guidelines also recommend that patients with pancreatitis maintain mean arterial pressure at ≥ 65 mm Hg [24]. In our patients with AP, MBP was greater than 65 mmHg in both the death and survival groups; however, the MBP in the death group was substantially lower in contrast with that in the survivors (71 mm Hg vs. 81 mm Hg, p < 0.001). We know that AP is often complicated by increased intra-abdominal hypertension [25–27], so it is clinically possible to increase MBP in patients with AP by rehydration or vasoactive drugs to satisfy gastrointestinal organ perfusion [26]. Compared to SBP, DBP, and pulse pressure alone, MBP can offer a more comprehensive and valuable information set for the clinic [28, 29]. In the SAPS II score, SBP is selected as one of the indicators, and if MBP replaces SBP, it may be better at predicting the prognosis of patients.
Our model incorporates the independent variable PTT, which sets it apart from other AP prediction models [18, 30]. PTT refers to partial thromboplastin time, i.e. the activity of coagulation factors in the endogenous coagulation pathway, an index used to reflect blood coagulation function in the clinic. The meaning of APTT is basically the same as that of PTT. The risk of short-term death may rise in AP patients with prolonged APTT. Previous studies showed that in terms of 30-day and 60-day survival, the risk of death in the high APTT group (> 37 s) was substantially higher than that in the standard group (p < 0.05). Similarly, our study also found that the value of PTT in the non-survivor group was substantially elevated in contrast with that in the survivor group (37.5 s vs. 31 s, p < 0.001). The primary cause of death in severe acute pancreatitis (AP) is complications, with the most frequent being early multiple organ failure and late-onset infection. Additionally, there is an incidence of fatal bleeding ranging from 1.2% to 14.5% [31]. A change in blood coagulation function accompanies the occurrence and development of AP, and the degree of coagulation dysfunction is strongly associated with the disease’s severity [32, 33]. Therefore, accurate and efficient monitoring of blood coagulation and anticoagulation indicators is essential for understanding the disease and guiding treatment. Currently, the clinical use of the SAPS II score does not include coagulation-related indicators. However, in our study, PTT was included in the new predictive model, which can be combined with the SAPSAII score to predict the prognosis of patients, increasing the prediction accuracy; our prediction model is equivalent to the improved SAPS II score and is specifically suitable for AP patients.
In previous studies [30], age and BUN were included to predict the IHM of AP. However, this research did not include these 2 indicators. Our predictive model included the SAPS II score comprising age and BUN. In addition, Han et al. [18] also constructed the survival prediction model of SAP through the nomogram model, and they included 15 risk factors, including SAPS II, RDW, RR, etc. These 3 indicators are also in our model. However, our prediction model consists of only 5 indicators, which is noticeably fewer than theirs, and our indicators are easier to obtain clinically. The predicted risk value can be obtained as soon as possible.
Our new prediction model outperforms the single index SAPS II, RDW, MBP, RR, and PTT in the training group, demonstrating superior prediction ability and greater clinical practicability. However, in the verification group, we found that the predictive power of the new model was similar to that of SAPS II, considering the low patient count in the validation group. In the future, more patients can be collected into the verification set, and the model’s predictive ability can be tested. However, the current predictive model does not affect clinical use.
When used with pre-existing data in the early stages of the disease, the ideal prediction model should be accurate and simple to use [34]. Many of these features are implemented in our nomogram model. It is produced using information collected within 24 h of admission and employs some easily accessible, accurate, and inexpensive clinical and laboratory parameters. In addition, the nomogram model has an excellent ability to predict IHM.
While our study benefits from the utilization of a comprehensive dataset obtained from a public database, it is important to acknowledge several limitations. Firstly, it is imperative to note that this study was conducted solely within a single ICU, thus representing a monocentric approach, despite the inclusion of a substantial cohort. Therefore, caution should be exercised when extrapolating our findings and the application of our dynamic online nomogram to other healthcare centres or countries because its generalizability may be restricted. Further research is warranted to validate the efficacy and adaptability of this model in different settings. Secondly, the dataset has a missing rate of over 15%, which means that vital clinical parameters like serum amylase and urinary amylase are not included. It is important to highlight the need to incorporate these missing parameters in future studies to enhance the accuracy of the prediction model. Thirdly, validating the generalizability of these findings to non-US populations is crucial. This can be achieved by conducting similar studies on diverse populations, allowing for comparisons across different cultural and societal contexts. Meta-analyses that combine data from studies conducted in different countries would also contribute to a broader understanding of the topic and its applicability. Finally, although nomograms have been extensively employed in clinical practice to assist medical decision-making, we hope to simplify the work further and broaden the range of possible applications. Thus, we intend to incorporate forecasting tools into PC applications, wearable devices, or mobile devices in the future.
In conclusion, our research discovered that the SAPS II score, RDW, MBP, RR, and PTT are predictors of IHM in ICU patients with AP. A nomogram and a LASSO regression model were constructed and validated in the present research. This nomogram may aid physicians in screening patients with high risk, optimal usage of resources, and reducing the incidence of mortality in this population of patients during clinical practice.