Introduction
The prevalence of metabolic syndrome (MS) is growing [1, 2]. Such a rapid increase in MS can be explained by the tendency to a low physical activity lifestyle and increased consumption of high-calorie food [3]. Obesity, namely its abdominal type (AO), is one of the main components of MS [2]. Genetic predisposition plays a role in the development of AO as a mandatory component of MS, which led to detailed searches for obesity genes and related disorders. Fat cells secrete a number of cytokines into the blood, called adipokines. One of these adipokines is leptin. Leptin concentration is directly proportional to the number of adipocytes [4]. Several polymorphisms of the leptin receptor gene have been described, such as K109R, Gln223Arg, S343S, N567N, K656N, and P1019P. Gln223Arg (rs1137101) has been studied more extensively compared to K109R (rs1137100) in relation to its role in metabolic disorders, in which leptin loses its affinity for the receptor and its regulatory mechanism is disrupted [5–7].
The results of studies investigating the relationship of the Gln223Arg polymorphism of the leptin receptor gene with MS components are contradictory. In some studies, relationships with AO [8], hyperglycemia, hyperinsulinemia [9], dyslipidemia [10], and increased blood (BP) pressure [11] have been determined. Other studies have found a link only with insulin resistance (IR) and type 2 diabetes mellitus (DM). The lack of unequivocal results explains the interest in studying the Gln223Arg polymorphism of the leptin receptor gene as a possible predictor of the development of obesity and IR.
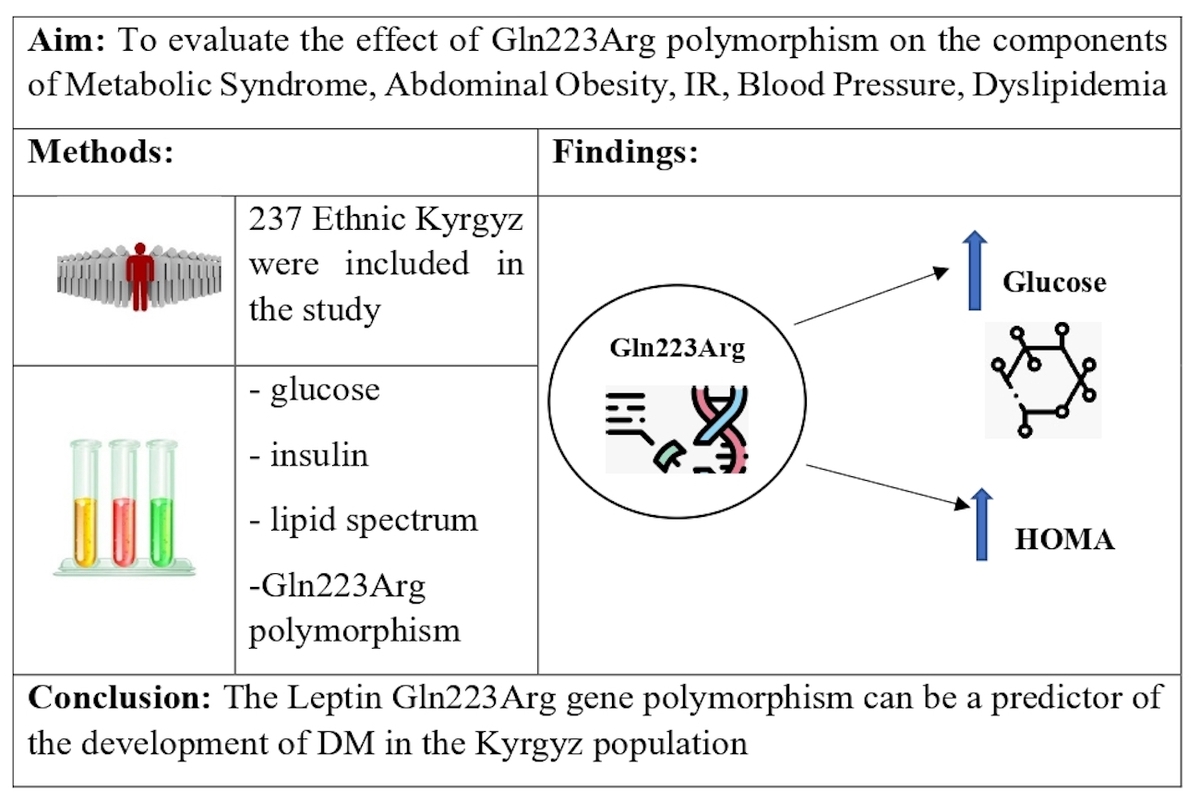
The aim of the study was to determine the possible relationship of the Gln223Arg polymorphism of the leptin receptor gene with MS components in the Kyrgyz ethnic population.
Material and methods
Ethical approval was obtained from the Ethical Committee of the Kyrgyz State Medical Academy. The study included: 237 non-consanguineous Kyrgyz ethnic subjects (110 males and 127 females), aged 36–70 years (average age: 51.7 ±8.8 years), who gave written informed consent to participate. We further subdivided the study participants into two groups comparable for age, socio-economic status and eating pattern. The first group consisted of 98 subjects (43 males, 55 females) who had MS and the second group, which was designated as the control group, consisted of 139 subjects (67 males, 72 females) without MS. The study exclusion criteria included: severe heart failure, malignant arterial hypertension, strokes, myocardial infarction, chronic hepatitis, renal and hepatic insufficiency, systemic connective tissue diseases, chronic alcoholism, thyroid dysfunction, cancer, pregnant and lactating women.
Anthropometric measurements
All patients underwent history and physical examination including systolic and diastolic blood pressure measurements as well as anthropometric parameters (weight, height, waist circumference (WC)). Body mass index (BMI) was calculated with the formula: BMI = weight (kg)/height2 (m)); obesity was diagnosed when BMI ≥ 30 kg/m2.
MS was diagnosed according to the modified criteria of the International Diabetes Federation (2006) [12]. Abdominal obesity was diagnosed at WC ≥ 94 cm in men and ≥ 88 cm in women for the Kyrgyz population [13].
Biochemical measurements
Blood glucose and blood lipid spectrum (total cholesterol (TC), triglycerides (TG), high-density lipoprotein cholesterol (HDL-C)) were determined by the standard method on the Sinchron CX4-DELTA autoanalyzer (Beckman, USA). The cholesterol content of low-density lipoproteins (LDL-C) was calculated using the Friedewald formula [14]. The determination of the insulin level was carried out by the ELISA method at the Hospital Saint Vincent De Paul Laboratory Hormonologie Pediatriqueet Maladies Metaboliques (Paris, France), for which, after blood sampling, the serum was separated and frozen in liquid nitrogen, followed by transportation to the laboratory. The HOMA insulin resistance index was calculated using the formula: HOMA = (serum insulin, mcU/ml x plasma glucose, mmol/l)/22.5. Insulin resistance was diagnosed at a HOMA index ≥ 2.77 [15].
Genotyping
DNA was isolated from 5 ml of venous blood by a standard two-stage method of phenol-chloroform extraction. To amplify the polymorphic locus Gln223Arg (rs1137101) of the leptin receptor gene (LEPR), the following primers were used: forward F 5′-ACCCTTTAAGCTGGGTGTCCCAAATAG-3′ and reverse R 5′-AGCTAGCAAATATTTTGTAAGCAATT-3′. After amplification, MspI endonuclease (Promega, USA) was used to cleave PCR products. PCR products were separated by electrophoresis in 3% agarose gel and visualized in ultraviolet light using the gel-documenting system GelDoc IT (UVP, UK).
Statistical analysis
Statistical data processing was carried out using the program Statistica 8.0. Comparisons of variables with normal distribution were carried out using Student’s t test. The data are presented as the mean ± standard deviation. Comparisons of variables with nonparametric distributions were carried out using the Mann-Whitney test; the data are presented as the median and interquartile range (25–75%). The relationship between qualitative variables was evaluated by analyzing the contingency tables using the χ2 test, calculating the odds ratio (OR) and the corresponding 95% confidence interval (95% CI). Spearman correlation analysis was carried out in order to study the relationship between the Gln223Arg polymorphism with the MS components, insulin levels and HOMA index. The criterion of statistical significance was considered to be the value of p < 0.05.
Results
A total of 237 participants (127 females and 110 males) were studied. Among female study participants 74 were in menopause. MS was diagnosed in 98 subjects, with 43 (43.8%) males and 55 (56.1%) females. IR was detected in 72 (30.3%) studied patients: 23 males with MS (53.4%) and 28 females with MS (50.9%). Arterial hypertension was present in 86 (36.2%) patients, among whom 47 (19.8%) were receiving antihypertensive therapy. DM was present in 15 individuals (6.3%) with 8 (3%) receiving treatment. Clinical characteristics of the studied subjects are presented in Table I.
Table I
Clinical characteristics of the studied population
| Parameters | Total n = 237 | Without MS (n = 139) | With MS (n = 98) | ||
|---|---|---|---|---|---|
| Men n = 67 (48.2%) | Women n = 72 (51.7%) | Men n = 43 (43.8%) | Women n = 55 (56.1%) | ||
| AH, n (%) | 86 (36.2) | 37 (55) | 23 (31.9) | 37 (86) | 43 (78.1)# |
| IR, n (%) | 72 (30.37) | 9 (13.4) | 12 (16.6) | 23 (53.4)* | 28 (50.9)# |
| Obesity n (%) (BMI ≥ 30 kg/m2) | 77 (32.48) | 5 (7.4) | 14 (19.4) | 20 (46.5)* | 38 (69)# |
| Glucose [mmol/l] | 5.48 (5.1–5.9) | 5.3 (5.11–5.58) | 5.25 (5.04–5.54) | 5.77 (5.35–6.5)* | 5.82 (5.51–6.32)# |
| AO, n (%) | 130 (54.85) | 14 (20.8) | 18 (25) | 43 (100)* | 55 (100)# |
| HTG, n %(%) | 72 (30.4) | 21 (31.3) | 4 (5.5) | 26 (60.4)* | 21 (38.1)# |
| Low-HDL-C, n (%) | 138 (58.22) | 26 (38.8) | 34 (47.2) | 30 (69.7)* | 48 (87.2)# |
Depending on the presence of IR, the studied individuals were further subdivided into 2 subgroups. The first subgroup without IR included 165 individuals (78 males and 87 females). The second subgroup with IR consisted of 72 patients (32 males and 40 females). The group with IR had higher glucose, insulin, triglyceride and BMI levels irrespective of the gender. In addition, the group with IR had lower concentration of HDL-C. AO was more prevalent in males with IR (Table II).
Table II
Clinical characteristics of patients with insulin resistance
| Parameters | Without IR, n = 165 (69.6%) | With IR, n = 72 (30.3%) | ||
|---|---|---|---|---|
| Men n = 78 (47.2%) | Women n = 87 (52.7%) | Men n = 32 (44.4%) | Women n = 40 (55.5%) | |
| AH, n (%) | 49 (62.8) | 43 (49.4) | 25 (78.0) | 23 (57.5) |
| Glucose [mmol/l] | 5.35 (5.12–5.61) | 5.38 (5.08–5.71) | 6.43 (5.37–7.21)* | 5.86 (5.43–6.55)# |
| Insulin [µIU/ml] | 5.6 (3.6–7.41) | 6.4 (4.5–8.5) | 14.1 (10.7–18.4)* | 16 (1.3–19.7)# |
| BMI [kg/m2] | 25.8 ±3.1 | 27.0 ±4.8 | 29.0 ±4.3* | 30 ±4.6# |
| AO, n (%) | 32 (41.0) | 41 (47.1) | 25 (78.0)* | 32 (80.0) |
| HTG, n % | 27 (34.6) | 7 (8.0) | 20 (65.2)* | 18 (45.0)# |
| Low HDL-C, n (%) | 35 (44.8) | 47 (54.0) | 21 (65.6)* | 35 (87.5)# |
The prevalence of genotypes and alleles of the Gln223Arg polymorphism of the leptin receptor gene in the examined individuals was in Hardy-Weinberg equilibrium. The frequency of the mutant allele 223Arg was 0.66. The distribution of genotypes was different: Gln223Gln 110 (46.4%), Gln223Arg 95 (40.1%), Arg223Arg 32 (13.5%). We put Arg223Arg and Arg223Gln carrier into one group since the homozygous Arg223Arg carrier group was small and in order to reduce the probability of systematic errors during statistical analysis. General characteristics of the examined individuals are presented in Table III.
Table III
General characteristics of the examined participants depending on the genotype
[i] ns – nonsignificant, AH – arterial hypertension, SBP – systolic blood pressure, DBP – diastolic blood pressure, IR – insulin resistance, BMI – body mass index, WC – waist circumference, MS – metabolic syndrome, TC – total cholesterol, LDL – low-density lipoprotein cholesterol, HDL – high-density lipoprotein cholesterol, TG – triglycerides.
The groups were comparable for gender and age. The Arg223Arg + Gln223Arg group had a higher glucose value of 5.54 mmol/l versus Gln223Gln 5.39 mmol/l (p = 0.02), and insulin 8.2 µIU/ml versus 7.1 µIU/ml (p = 0.03). The parameters of the lipid spectrum did not differ significantly between the groups (Table III).
To further investigate the possible relationship between the Gln223Arg polymorphism of the leptin receptor gene, we determined the relationship between the 223Arg mutant allele and IR and MS components (Table IV). A relationship of this allele with IR (χ2 = 24.41, p < 0.03) OR = 1.83 (95% CI: 1.03–3.24) was detected, while a significant relationship with the following MS components was not found: AO, AH, hypertriglyceridemia (HTG).
Table IV
Relationship of Gln223Arg polymorphism of leptin receptor gene with IR, MS, and MS components
Correlation analysis of the Gln223Arg polymorphism of the leptin receptor gene and the MS components (Table V) demonstrated a positive correlation with insulin, glucose, and the HOMA index.
Discussion
MS represents a major medico-social problem [1, 16]. A lifestyle with reduced physical activity and a diet rich in animal fat and processed carbohydrates contribute to the development of obesity, arterial hypertension, diabetes mellitus, and dyslipidemia. Indeed, environmental factors play a significant role in patients with genetic susceptibility to cardiometabolic disease.
Genetic studies help better understand the physiological and pathologic traits in humans. Identification of genetic predictors of cardiometabolic risk factors allows the detection of high-risk patients at an early stage, which will aid in primary prevention in a high-risk group and hopefully reduce cardiovascular mortality.
In our study, we assessed the relationship of the polymorphism of the Gln223Arg gene of the leptin receptor with anthropometric, biochemical changes and the formation of MS components in subjects of Kyrgyz ethnicity. We identified all three genotypes Gln223Gln, Gln223Arg, Arg223Arg, and compared the prevalence of the 223Arg allele with other populations. In the Kyrgyz population, the frequency of the 223Arg allele was quite high at 0.66; similar results were observed in Britons (0.61), Europeans (0.53) and Americans (0.56) according to data registered on the basis of the National Center for Biotechnology Information [17]. However, among East Asians, particularly Chinese and Japanese, the 223Arg allele frequency was low, 0.13 and 0.15. The heterogeneous frequency of this allele may be related to multiple environmental, nutritional, and genetic factors, depending on the place of residence [17].
In our study, carriers of the Gln223Arg genotype showed an association with hyperinsulinemia; similar results were obtained by others, who had an increased risk of type 2 DM [18–21]. However, in a study by Fang et al., the increased risk of type 2 DM was associated with the Gln223 allele [22]. Such heterogeneous polymorphism data are likely related to the characteristics of the ethnic groups included in the study.
The mechanism of IR in Gln223Arg polymorphism of the leptin receptor gene is attributed to a decrease in the sensitivity of leptin receptors. [23]. A single nucleotide polymorphism with the substitution of adenine for guanine at the 668 position leads to the replacement of glutamine with arginine at the 223 position of the protein product (Gln223Arg) [24]. This mutation is located in exon 6 and disrupts signal transmission by leptin receptors. Normally, leptin binds to leptin receptors located in β cells in the pancreas, as a result of which insulin secretion is suppressed [25]. So, after eating, in response to changes in glucose levels, insulin begins to be produced, which stimulates the production of leptin in fat cells. Leptin, in turn, should reduce the production of insulin through leptin receptors [26]. In the absence of signal transmission by leptin receptors, suppression of insulin production does not occur, which in turn can lead to hyperinsulinemia and subsequent development of IR [27]. According to our data, people of Kyrgyz ethnicity have an increased risk of developing type 2 DM in the future. Further prospective follow-up of patients is necessary to clarify this hypothesis.
Studies on the association of Gln223Arg polymorphism and obesity have shown heterogeneous results (Table VI). Diéguez-Campa et al. demonstrated a link between this polymorphism and obesity in young Mexicans [28] and Ben Ali et al. found an association with an increase in BMI in Tunisian patients [29]. Endo et al. did not find an association of Gln223Arg polymorphism with obesity in Japanese school children [30]. In our study, the Gln223Arg+Arg223Arg group had higher values of BMI and AO, but we did not find a significant relationship. Overweight people have an increased level of leptin, which indicates possible leptin resistance [31–33]. A mutation in the leptin receptor gene leads to uncontrolled leptin production and impaired appetite regulation in the brain. Normally, leptin receptors are expressed in the hypothalamus, where, acting on neuropeptide Y, they suppress appetite and promote a feeling of satiety, which is not observed with mutations in the leptin receptor gene.
Table VI
Studies of associations between Gln223Arg polymorphism of the leptin receptor gene and MS components
| Authors | Population/Association |
|---|---|
| Yang Y, et al. [6] | Meta-analysis/Association with T2DM |
| Fan SH, et al. [7] | Malaysian/Association with plasma leptin levels and obesity |
| Adiga U, et al. [9] | Indian/Association with IR |
| Gu P, et al. [11] | Chinese/Association with essential hypertension |
| Ying J, et al. [19] | Chinese/Association with T2DM |
| Li YY, et al. [20] | Meta-analysis/Association with T2DM |
| Boumaiza I, et al. [21] | Tunisian/Association with obesity and MS |
| Dieguez-Campa CE, et al. [28] | Mexican/Association with obesity |
| Endo K, et al. [30] | Japanese/No association with obesity |
| Ashraf R, et al. [34] | Kashmir/Association with T2DM |
| Al-Harithy, et al. [35] | Saudi females/Association with T2DM and obesity |
| Daghestani MH, et al. [36] | Saudi females/Association with metabolic profile |
| Ali EMM, et al. [37] | Egyptian/Association with obesity |
| Wu H, et al. [38] | Meta-analysis/No association with T2DM |
| Komşu-Ornek Z, et al. [39] | Turkish children/No association with obesity and MS |
| Murugesan D, et al. [40] | Indian/Association with leptin, insulin, and BMI |
Our study did not reveal an association of Gln223Arg polymorphism with hypertension, obesity and dyslipidemia. Perhaps the contradictory results are related to the different genetic background in the study population and probably due to the limited study sample.
Limitations of the study. Only patients of Kyrgyz ethnicity were included in the study. In our study, there were fewer participants with the homozygous Arg223Arg genotype than patients with the other genotypes. Therefore, we had to combine patients with Arg223Arg and Arg223Gln genotypes into one group. Therefore, we could not fully assess the effect of each genotype on the incidence of each individual MS component, which may have influenced our results. Also, the absence of prospective observational studies limits the risk assessment of MS components in the Kyrgyz ethnic group. A larger sample size, inclusion of other ethnic groups living in Kyrgyzstan and a prospective study type are needed to better understand the association of leptin gene polymorphism and MS components.
In conclusion, the Gln223Arg polymorphism of the leptin receptor gene has not been previously studied in the Kyrgyz population. This study sheds light on the nature of the Gln223Arg polymorphism of the leptin receptor gene in the Kyrgyz ethnic population. In our study, there was no association with all components of MS. However, the study demonstrated an association with hyperinsulinemia and IR in carriers of Gln223Arg, indicating a possible role of leptin receptor gene polymorphism in the pathogenesis of DM development.