Introduction
Worldwide, more than 415 million people live with type 2 diabetes mellitus (T2DM), and it is estimated that by 2040 there will be about 642 million [1]. In Mexico, in 2015, there were reported nearly 100 thousand deaths due to T2DM, accounting for 15.0% of all deaths [2]. Some researchers have predicted a prevalence of T2DM of 22.52% by 2050 [3]. However, the reported number is underestimated as there is a percentage of people with diabetes who are not aware of their condition.
T2DM is caused by a combination of genetic susceptibility, environmental and other related behavioral effects. There are more than 80 common genetic variants for T2DM, with increased risk ranging from 5% to 40% [4]; however, the vast majority of these studies of susceptibility have been conducted in populations with European ancestry, so the identified variants have been insufficient to characterize the risk of T2DM [5].
To date, it is known that common variants represent only about 10% of the heritability of T2DM and it has been proposed that interactions between gene-environment and gene-gene and epigenetic events (which are strongly influenced by the environment) are the other percentage of heritability [4]. Hence it is imperative to study common variants in populations with a high prevalence of predisposing risk factors such as obesity, hypertension, and dyslipidemia and with a questionable ancestry linked to susceptibility to diabetes, such as haplotypes commonly found in Mexicans [6], or thrifty alleles common found in Mexican Amerindians and mestizo populations [7].
The increased risk of arteriosclerosis in T2DM has partially been attributed to low levels of ApoA-I [8] and increased concentrations of ApoB, which might favor the formation of chylomicrons and low-density lipoproteins [9].
Since there are unique factors of T2DM that may modify the transcriptional activity of APOA1 and APOB genes and due to the elevated risk of myocardial infarction (MI) in T2DM, it is necessary to study the susceptibility to MI due to genotypes on these genes that allow us to identify new genetic markers in the scenario of an exposed population. These genotypes could favor changes in levels of apolipoproteins and other lipids.
Thus, we evaluated some of the most relevant polymorphisms related to changes in the concentrations of apolipoproteins and other lipids levels that could be used as genetic markers of susceptibility for MI: in APOA1: a substitution of G to A in the region 75 of the promoter (-75 G>A, rs670) and a change of C to T in codon 83 (83C>T, rs5070); in APOB: the polymorphism XbaI CT 2488 (rs693) located in exon 26 involving a silent mutation at the third nucleotide of the codon threonine at amino acid 2488.
Material and methods
Study design and participants
We studied 462 genetically unrelated individuals from Western Mexico. Ethnic origin was defined as those having at least two generations of ascendants born in Mexico. These subjects had the following characteristics.
One hundred thirty-five patients older than 45 years with DMT2 and infarction (DI), with a history of T2DM diagnosed previously by their physician and confirmed by us as fasting glucose higher than 126 mg/dl according to the American Diabetes Association (ADA) [10]. Some of the most relevant biochemical tests indicative of cardiovascular risk were measured. Classical risk factors, as defined by the ADA, were categorized as present or absent.
Eighty-five non-infarcted diabetic individuals (NID) older than 45 years with a previous diagnosis of DMT2 but without records of ischemic events.
Two hundred forty-two individual older than 45 years with no history of ischemic events and without DMT2 (healthy subjects – HS) as the main exclusion criteria. They denied active infections or receiving any treatment.
The 462 individuals responded to a questionnaire about their medical history and lifestyle characteristics.
All subjects were recruited at Hospital de Especialidades del Centro Médico Nacional de Occidente del Instituto Mexicano del Seguro Social (CMNO-IMSS). Subjects with overlapping heart disorders or other diseases such as familial hypercholesterolemia, as well as genetically related individuals, were not included.
The study was conducted following the Declaration of Helsinki (2013). Informed written consent was obtained. Ethical approval was granted by the Ethics and Biosafety Committee of the Centro Universitario de Ciencias de la Salud, CUCS, UdeG.
Genetic analysis of polymorphisms
Genotyping was performed according to the technique described in our previous study [11]. Twenty-five percent of samples were double-genotyped with a concordance rate of 100%.
Statistical analysis
The statistical analysis was carried out using the SPSS statistical package version 22.0 and Excel 2010. The χ2 test was used to compare discrete variables and to test the Hardy-Weinberg equilibrium. The data for continuous variables were expressed as mean ± standard deviation (SD) and median comparison was evaluated by the Mann-Whitney U test. The odds ratio (OR) was the measure of association for genotype, allele frequencies and for risk factors, the cutoff of significance was p < 0.05.
Results
Clinical variables
We aimed to investigate the association between the polymorphisms with MI when T2DM is present or absent. Therefore, we selected three groups for comparations.
Risk factors in HS, NID and DI are shown in Table I. The most common risk factor in the three groups was high blood pressure with a percentage of 25.0%, 60.0% and 79.3% respectively. The average age was 60, 65 and 56 years respectively.
Table I
Risk factors of the study groups
We compared some of the classical biochemical parameters indicative of cardiovascular risk and statistically significant differences were observed in all of them (p < 0.001), the most notable settings were: in DI patients, an increase in fasting glucose (median (M) = 165.0 mg/dl)); decreased levels of HDL-C (M = 20.0 mg/dl) and increased levels of C-reactive protein (C-RP) (M = 24.0). All classical biochemical parameters related to cardiovascular risk were statistically significantly different among groups (p < 0.001) (Table II).
Table II
Biochemical characteristics
| Parameter | HS (N = 252) | NID (N = 85) | P-value* | DI (N = 135) | P-value* | Normal values | ||||||
|---|---|---|---|---|---|---|---|---|---|---|---|---|
| Percentiles | Percentiles | Percentiles | ||||||||||
| 50 | 75 | 95 | 50 | 75 | 95 | 50 | 75 | 95 | ||||
| Age | 56 | 62 | 73 | 60 | 66 | 75 | – | 65 | 70 | 79 | – | – |
| Total cholesterol [mg/dl] | 159.0 | 192.3 | 241.6 | 156.0 | 189.5 | 262.5 | < 0.001 | 116.0 | 142.0 | 180.0 | < 0.001 | 150–199 |
| Fasting glucose [mg/dl] | 90.0 | 104.0 | 162.3 | 134.0 | 209.5 | 339.4 | < 0.001 | 165.0 | 208.0 | 270.9 | < 0.001 | 75–105 |
| Triglycerides [mg/dl] | 96.5 | 127.8 | 199.0 | 114.0 | 152.3 | 265.2 | < 0.001 | 93.0 | 121.5 | 168.5 | < 0.001 | < 200 |
| LDL-C [mg/dl] | 63.5 | 89.0 | 133.6 | 69.0 | 103.0 | 157.4 | < 0.001 | 41.5 | 56.0 | 84.0 | < 0.001 | < 130 |
| HDL-C [mg/dl] | 36.0 | 53.5 | 75.0 | 34.0 | 57.0 | 73.0 | < 0.001 | 20.0 | 30.0 | 49.5 | < 0.001 | > 40 |
| CRP [mg/l] | 2.0 | 3.8 | 23.0 | 3.0 | 4.0 | 17.6 | < 0.001 | 24.0 | 36.0 | 39.1 | < 0.001 | 1–10 |
| ApoA-I [mg/dl] | 198.3 | 213.3 | 236.1 | 189.7 | 215.3 | 262.2 | < 0.001 | 165.6 | 184.9 | 231.3 | < 0.001 | 94–178 |
| ApoB [mg/dl] | 164.7 | 184.6 | 225.5 | 163.6 | 185.4 | 277.0 | < 0.001 | 128.3 | 153.4 | 195.5 | < 0.001 | 63–133 |
Susceptibility conferred by polymorphisms in DI and NID
-75 G>A polymorphism of APOA1
Statistically significant differences were found in genotype distribution between DI and NID groups (OR = 2.01, 95% CI: 1.117–3.623, p = 0.019, Table III). There is an increased risk for A allele carriers as seen in the dominant model (OR = 1.77, 95% CI: 1.020–3.084, p = 0.042, Table III). It is worth noting that this association is only obtained in the scenario of DMT2 as we did not find such risk when we compared the DI group against HS individuals in whom we know there is no suspicion of DMT2.
Table III
Genotype and allele distribution of the APOA1 and APOB polymorphisms in NID and DI groups
| 75 G>A Genotype APOA1 | NID n = 85 (%) | DI n = 130 (%) | OR (CI) | P-value |
|---|---|---|---|---|
| G/G | 50 (58.8) | 58 (44.6) | – | – |
| G/A | 27 (31.8) | 63 (48.5) | 2.01 (1.117–3.623) | 0.019 |
| A/A | 8 (9.4) | 9 (6.9) | 0.970 (0.348–2.702) | 0.042 |
| Alleles: | 2n = 170 (%) | 2n = 260 (%) | ||
| G | 127 (74.7) | 179 (68.8) | – | – |
| A | 43 (25.3) | 81 (31.2) | 1.33 (0866–2063) | 0.19 |
| Models*: | ||||
| Dominant: | ||||
| G/G | 50 (58.8) | 58 (44.6) | – | – |
| G/A + A/A | 35 (41.2) | 72 (55.4) | 1.77 (1.020–3.084) | 0.042 |
| Recessive: | ||||
| G/G + G/A | 77 (90.6) | 121 (93.1) | – | – |
| A/A | 8 (9.4) | 9 (6.9) | 0.716 (0265–1935) | 0.50 |
| 83 C>T Genotype APOA1 | NID n = 80 (%) | DI n = 135 (%) | OR (CI) | P-value |
| C/C | 67 (83.8) | 123 (91.1) | – | – |
| C/T | 13 (16.2) | 12 (8.9) | 0.503 (0.217–1.164) | 0.10 |
| T/T | 0 (0.0) | 0 (0.0) | 0.547 (0.011–27.85) | 1.00 |
| Alleles: | 2n = 160 (%) | 2n = 270 (%) | ||
| C | 147 (87.5) | 258 (95.6) | – | – |
| T | 13 (12.5) | 12 (4.4) | 0.526 (0.234–1.183) | 0.11 |
| 2488 C>T Genotype APOB | NID n = 82 (%) | DI n = 135 (%) | OR (CI) | P-value |
| C/C | 32 (39.0) | 56 (41.5) | – | – |
| C/T | 36 (43.9) | 60 (44.4) | 0.909 (0.642–1.287) | 0.59 |
| T/T | 14 (17.1) | 19 (14.1) | 0.701 (0.425–1.156) | 0.16 |
| Alleles: | 2n = 164 (%) | 2n = 270 (%) | ||
| C | 100 (61.0) | 172 (63.7) | – | – |
| T | 238 (39.0) | 98 (36.3) | 0.89 (0.597–1.734) | 0.56 |
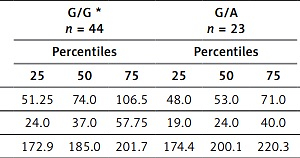
Given this finding, we determined how this polymorphism affected ApoA-I concentrations and other biochemical parameters in this DI group (Table IV; only those parameters with statistical significance are shown). Concentrations of ApoA-I in A/A carriers were significantly decreased in comparison with heterozygotes (p = 0.038) and LDL-C and HDL-C levels were lower in heterozygotes compared to G/G carriers (Table IV).
Table IV
Lipid levels in the DI group related to the genotypes of the −75 G>A APOA1 polymorphism
| Parameter | G/G * n = 44 | G/A n = 23 | P-value** G/G vs. G/A | A/A n = 7 | P-value** G/G vs. A/A | ||||||
|---|---|---|---|---|---|---|---|---|---|---|---|
| Percentiles | Percentiles | Percentiles | |||||||||
| 25 | 50 | 75 | 25 | 50 | 75 | 25 | 50 | 75 | |||
| LDL-C [mg/dl] | 51.25 | 74.0 | 106.5 | 48.0 | 53.0 | 71.0 | 0.029 | 31.0 | 68.0 | 101.0 | 0.47 |
| HDL-C [mg/dl] | 24.0 | 37.0 | 57.75 | 19.0 | 24.0 | 40.0 | 0.044 | 27.0 | 32.0 | 53.0 | 0.50 |
| ApoA-I [mg/dl] | 172.9 | 185.0 | 201.7 | 174.4 | 200.1 | 220.3 | 0.131 | 161.0 | 170.9 | 187.7 | 0.038 |
83 C>T polymorphism of APOA1
Neither genotype nor allelic distributions of 83 C> T polymorphism was different between DI and NID (Table III). There were no associations between biochemical parameters and genotypes.
2488 C>T polymorphism of APOB
According to clinical characteristics, some differences were observed between genotypes in the DI group: HDL-C was lower in T/T carriers relative to C/C carriers (17.0 mg/dl vs. 18.5 mg/dl, respectively, p = 0.009); also, triglyceride levels were significantly lower in heterozygous individuals compared to C/C carriers (90 mg/dl vs. 96 mg/dl respectively; p = 0.029) (Table V).
Table V
Lipid levels in the DI group related to the genotypes of the 2488 C>T APOB polymorphism
| Parameter | C/C* n = 56 | C/T n = 60 | P-value** C/C vs. C/T | T/T n = 19 | P-value** C/C vs. T/T | ||||||
|---|---|---|---|---|---|---|---|---|---|---|---|
| Percentile | Percentile | Percentile | |||||||||
| 25 | 50 | 75 | 25 | 50 | 75 | 25 | 50 | 75 | |||
| HDL-C [mg/dl] | 12.0 | 18.5 | 26.3 | 9.0 | 16.0 | 27.0 | 0.237 | 9.0 | 17.0 | 26.0 | 0.009 |
| TGC [mg/dl] | 76.5 | 96.0 | 129.8 | 79.0 | 90.0 | 114.0 | 0.029 | 70.8 | 78.0 | 95.3 | 0.512 |
Discussion
Clinical and biochemical characteristics of the groups
It is estimated that the rate of death from coronary heart disease in diabetic patients is almost three times higher than that of subjects without this condition [12]. Factors such as high blood pressure, smoking, insulin resistance, hyperglycemia, inflammation and dyslipidemia are also known to increase this risk [13, 14], and Mexicans have a high burden of all these factors, being among those most afflicted by cardiovascular disease in the world.
As an example of the strong influence of risk factors, in our study, the percentage of individuals with high blood pressure (HBP) in NID and DI (diabetic scenario) is 2.4 and 3.2 times higher respectively than the proportion observed in HS (non-diabetic scenario). The same trend is observed with sedentary lifestyle, being 1.6 and 4.3 times higher; dyslipidemia, being 1.9 and 3.7 times higher; and obesity, being 1.5 and 2.5 times higher. The percentage of overweight and smoking was similar between HS and NID (15.1 and 15.3 respectively) but was three times higher for DI (48.9%), which means that at least these two risk factors are involved in the susceptibility to MI independently if an individual has T2DM or not (Table I). To the best of our knowledge there is no other study in which this comparison has been made in three groups of individuals, indicating the importance of the difference of susceptibility between them.
In this study, 58% of all diabetic individuals (mean age: 62.5) had body mass index (BMI) ≥ 25 kg/m2; 70% had HBP and 32% were frequent smokers; this percentage was reported as 75%, 50% and 34% respectively in the diabetic population (mean age: 54.5) surveyed by ENSA (Encuesta Nacional de Salud) [15] and most recently, (but only data for HBP and dyslipidemia are reported), in an analysis of diabetic population (mean age: 56.9) by the National Health and Nutrition Survey (ENSANUT) as 47% and 32% respectively [16].
The prevalence of T2DM was 8.18% according to ENSA in 2000 and according to ENSANUT [17]; it increased to 9.14 in 2016. This change in prevalence and other changes in behavior during the last 15 years reflect the importance of monitoring risk factors in the population.
Biochemical parameters indicative of cardiovascular risk are also altered in our population. Although the comparison of medians between the 3 groups is statistically significant, the unique median values outside of the normal range were: in the HS group: HDL-C: 36.0 mg/dl, ApoA-I: 198.3 mg/dl and ApoB: 164.7 mg/dl; in the NID group: glucose: 134.0 mg/dl, HDL-C: 34 mg/dl, ApoA-I: 189.7 mg/dl and ApoB: 163.6 mg/dl; and in the DI group: glucose: 165.0 mg/dl, HDL-C: 20.0 mg/dl and C-RP: 24.0 mg/dl (Table II).
Levels of LDL-C and triglycerides are lower than expected in the three groups. It is known that about 55% of the population with T2DM older than 40 years receive treatment for high cholesterol due to the presence of cardiovascular disease risk (HBP, overweight, obesity, etc.) or because they have a history of ischemic events [16]; therefore such parameters could not be used as a measure of prognosis after MI in this aged population, as these values are generally altered due to medication and diet, but we could use other parameters such as ApoB and ApoA-I, as it is well known that their ratio indirectly reflects the disequilibrium between pro-atherogenic and atherogenic particles and their levels are not affected by the fasting state [18].
Genetic analysis
Genome-wide association studies have identified loci associated with susceptibility to T2DM; for example, the 2488C>T polymorphism in APOB is a variant associated with T2DM primarily with changes in levels of TG, LDL-C and HDL-C [19]. The other two variants analyzed in this study have not been associated with T2DM, but they have been associated primarily with changes in levels of ApoA-I and HDL-C, which are known to be deregulated in T2DM and have a significant impact in the formation of atherosclerotic plaque.
Polymorphic variants can exert their biological effects depending on what type of comorbidity is present; for example, in obesity it is known that TNF-α is closely related to insulin resistance and hyperinsulinemia and has been demonstrated to deregulate the expression APOA1 by lowering by 50% the levels of some transcription factors that can act as second messengers and increase the expression of this gene [20].
Diabetic dyslipidemia also contributes to changes in the expression of APOA1, which intervenes in the function and survival of pancreatic β cells, obesity and insulin resistance in muscle and liver [21]. These are just some examples that can help us to explain the increased risk of MI in the scenario of T2DM.
APOA1 gene polymorphisms and their relation to cardiovascular disease in T2DM
The risk of ischemic heart disease in patients with T2DM is up to three times higher than in those without the disease, and not all patients with T2DM develop an associated coronary event [22]. This makes it clear that the genetic component occurring in patients with T2DM is probably involved in these cardiovascular events. Other factors such as habits of the individual and the presence of other comorbidities also contribute to the development of ischemic events.
-75 G>A polymorphism in APOA1 gene
We found that the -75 G>A polymorphism is associated with DI. G/A carriers have 2.01 times higher susceptibility to DI compared with G/G genotype (OR = 2.01, 95% CI: 1.117–3.623); only one copy of the A allele contributes to the risk, as can be seen in the dominant model (Table III; OR = 1.77, 95% CI: 1.020–3.084).
We also found associations of this polymorphism with levels of ApoA-I, HDL-C and LDL-C: levels of ApoA-I significantly decreased in the presence in homozygous polymorphic genotype AA compared to reference genotype G/G (170.9 mg/dl vs. 185.0 mg/dl, p = 0.038). Another effect of risk is reflected in levels of HDL-C in G/A compared to G/G carriers (24.0 vs. 37.0 mg/dl, p = 0.044) (Table IV). Once again it looks like the A allele is contributing to the risk.
To the best of our knowledge, this variant has not been studied to determinate the susceptibility to MI in diabetic patients, but in the same way as us, it has been reported as a variant responsible for changes in lipids by altering the function of the promoter of the APOA1 gene. The A allele of this polymorphism has been associated with hypertension [23]; with higher systolic blood pressure and blood glucose levels in adolescents with higher BMI; the genotype G/A has been shown to confer an increased risk of atherogenic dyslipidemia in Turkish adults [24]; and Chinese obese children carriers of G/A genotype have been shown to have higher levels of VLDL, LDL-C and TG [25]. Other authors have found the G allele to be responsible for the risk of coronary artery disease, being primarily associated with low HDL-C levels [26].
It is possible that lower plasma concentrations of HDL-C are due to a decreased response of the APOA1 gene to insulin; which could be explained by the marked increase of free fatty acids in T2DM preventing APOA1 promoter activation by the transcription factor Sp1, a specific second messenger of insulin [27]. It is likely, therefore, that the affinity of some transcription factors could be altered in the presence of the variant.
Although the biological mechanism of the -75G> A variant is not fully established, its role in lipid metabolism and other risk factors related to cardiovascular disease in different populations is evident and consistent with our findings. Although those authors did not find those associations under T2DM, we can assert that the presence of the A allele in DI is associated with decreased levels of ApoA-I and HDL-C in T2DM, which could contribute to explaining the increased cardiovascular risk of these individuals.
The sometimes inconclusive effect of an allele or genotype (as protective or non-protective) is usually due to ethnicity differences, but lately some authors have reported novel systematic reviews to determine the most likely statistical association of a genetic variant with a cardiovascular disease, such as in the case of the study of Xu and Zhou, who determined that -75 G>A polymorphism is a protective factor for cardiovascular disease [28].
83 C>T polymorphism of APOA1 gene
The biological mechanism of the 83C>T variant has not been established but there is evidence of its involvement in lipid metabolism, and other risk factors related to cardiovascular disease and T2DM: the -75A and 83T alleles have shown an association with hypertension and the 83C allele with obesity and hypertension [23]. Although we did not find an association of this genetic variant with MI in DMT2, there is evidence that the 83C>T variant significantly decrease the levels of ApoA-I and HDL-C in patients with heart disease and diabetics, unlike non-diabetics [29].
2488C>T polymorphism of APOB gene
Although we did not find an association of this polymorphism with DI, the C/T carriers have lower levels of TG compared to the reference genotype C/C (90.0 vs. 96.0 mg/dl, p = 0.029) and lower levels of HDL-C in T/T carriers against C/C. (17.0 vs. 18.5 mg/dl, p = 0.009) (Table V). This result is concordant with a meta-analysis of 61 studies (50,018 subjects) in which it was found that T carriers had higher levels of ApoB, TG, TC and LDL-C and lower levels of HDL-C than non-carriers [30].
A genome-wide association study was conducted in a Finnish and Swiss population, including about 1500 patients with T2DM and controls. This study identified loci associated with susceptibility to T2DM which in turn are associated with changes in levels triglycerides, HDL-C and LDL-C, the 2488C>T variant (between about 400,000 variants studied) being one of the main variants highly associated with levels of these parameters [19].
In an analysis of 16 European cohorts, which included an average of about 20,000 individuals, the number of T2DM patients was not as large as in the earlier report, and yet this variant was found to have the fourth highest impact on triglycerides, HDL-C and LDL-C levels; therefore the authors suggest that this variant could have an independent effect and not be associated with T2DM [31].
In another association study, three different cohorts were evaluated, and also there was an association with LDL-C (p = 1 × 10–21) and triglycerides (p = 2 × 10⁻⁷) [32].
The polymorphic site located at position 2488 in exon 26 of the APOB gene involves a silent variant in the third nucleotide of the threonine codon at amino acid 2488 [33]. This silent variant is only 600 to 900 residues from two binding domains of the protein to its receptor (LDL receptor), so it has been proposed that this SNP is in linkage disequilibrium with polymorphisms affecting these binding regions; variants in this site may lead to different affinity to the LDL receptor, leading to a distinct catabolism for LDL-C [34], and this dysregulation in the production of LDL-C is well known to alter the levels of ApoB, TG and HDL-C, as they are involved in the same metabolic pathways contributing to the dyslipidemia observed in people with diabetes [35].
Our results have shown that it is important to select individuals sharing a particular comorbidity, because as we know, changes in the DNA sequence (whether a SNP, an insertion, deletion or duplication) can lead to differences in gene-protein affinity and/or activation or inactivation of signaling pathways which may be exacerbated by specific elements of the comorbidity (in our case T2DM). This dysregulated gene-protein interaction in T2DM will trigger complications at the level of different metabolic pathways and eventually contribute, at least partially (we should not forget that we are managing a complex disease), to the risk of cardiovascular diseases.
Diabetic dyslipidemia additionally adds changes in the outflow of APOA1, which mediates in the capacity and survival of pancreatic β-cells, weight and insulin obstruction in muscle and liver. Many patients still cannot reach the recommended target levels of lipids after treatment; therefore, the study of some variants (such as in the case of the study of PCSK9) has led to the identification of novel mechanisms of actions, resulting in novel therapies in just a short period of time [36].
Classical risk scores are the common measures to assess clinical outcomes after a coronary event [37] but polygenetic risk scores are also an important element to include in the near future.
In conclusion, the -75 G>A APOA1 polymorphism could be considered as a susceptibility factor for myocardial infarction in individuals with T2DM. Also, the 83 C>T APOA1 and 2488 C>T APOB polymorphisms are associated with changes in levels of triglycerides, HDL-C and LDL-C in the same group. However, additional genetic studies should be performed in the future to determine a more comprehensive genetic risk score in our population.