

Introduction
Type 2 diabetes mellitus (T2DM) is a metabolic disease characterized by chronic hyperglycemia, accompanied to varying degrees by alterations in carbohydrate, protein, and lipid metabolism. Diabetes leads to numerous complications, which are exacerbated when glycemic control is inadequate. If undiagnosed and untreated, it can lead to serious dysfunction of multiple organs. It is a significant factor in premature mortality due to cardiovascular complications. Therefore, scientific knowledge of the various processes underlying T2DM is essential to improve its treatment [1–3].
The World Health Organization (WHO) estimates that by 2030, there will be over 470 million people with pre-diabetes, and these will be mainly undiagnosed patients. Pre-diabetes is characterized by a reversible, high-risk state in which 5–10% of all patients may return to normal glycemic status. Early treatment of diabetes and pre-diabetes can only be achieved by timely identification through the healthcare system [4–6].
Type 2 diabetes mellitus leads to several metabolic and microvascular disorders that affect the oral mucosa, including the tongue. Microcirculation disorders in the densely vascularized tongue manifest earlier than in other tissues. Due to its accessibility, the tongue is a valuable diagnostic tool that can aid in detecting metabolic disorders and monitoring patient health. Therefore, this paper addresses the role of the dentist in the interdisciplinary treatment of this 21st-century pandemic [7, 8].
New, non-invasive technologies are being sought for both the diagnosis and treatment of T2DM, eliminating pain and anxiety among patients. Needle-free drug injections [9] and infrared radiation (IRT), which safely and non-invasively capture the body’s natural radiation without contact, have enormous potential in the systemic treatment of diabetes [9, 10].
Infrared radiation has been used in the diagnosis of diabetes, anemia, and coronary artery disease based on local temperature changes secondary to changes in blood flow [11–14]. This research is a continuation of the author’s method for obtaining thermographic measurements of temperature distribution on the tongue surface, which can be used in the early diagnosis of general diseases, including diabetes, manifested by fluctuations in core temperature [10–14]. In this study, we focused on assessing tongue temperature, as it closely correlates with blood perfusion rate and metabolic processes [14].
A thermal imaging camera identifies and monitors the amount of emitted radiation and then converts this value into temperature. Based on the obtained results, relevant information can be obtained on the correlation between biochemical parameters and surface temperature. Disturbances in biochemical parameters lead to vascular dysfunction and blood flow disturbances caused by changes in body temperature, which is an important indicator of health [11–14]. The aim of the study was to identify correlations between lipid profile parameters and thermal parameters obtained from thermal imaging of the tongue in order to assess the risk of cardiovascular diseases in patients diagnosed with T2DM. This work represents a further step towards demonstrating that thermal imaging of the tongue can be used as a screening technique for T2DM and its complications in the form of cardiovascular diseases.
Material and methods
This study extends our previously published pilot study by employing a larger cohort and leveraging advancements in thermal imaging technology [10]. It introduces novel analyses exploring correlations between tongue thermal parameters and lipid profiles, which had not been previously investigated. Furthermore, sensitivity and specificity assessments based on a blinded evaluation of thermal images were incorporated to enhance the analytical rigor.
Initially, 55 patients with T2DM and 13 healthy controls were enrolled. After applying the inclusion/exclusion criteria and verifying completeness/quality of the datasets, 18 T2DM participants and 1 control were excluded. Therefore, the final analyzed cohort comprised 29 T2DM patients and 12 controls (Table I). The number of observations may vary across specific analyses due to missing laboratory values and/or the exclusion of statistical outliers, as defined by the predefined statistical protocol.
Table I
Biochemical parameters for the diabetes group and the control group
[i] LDL-C – low-density lipoprotein cholesterol, HDL-C – high-density lipoprotein cholesterol, Non-HDL-C – non-high-density lipoprotein, TC/HDL-C – total cholesterol to HDL cholesterol ratio, LDL-C/HDL-C – low-density lipoprotein cholesterol to HDL cholesterol ratio, TG/HDL-C – triglycerides to HDL cholesterol ratio.
Patients had been ill for an average of 13 years and were treated with oral hypoglycemic drugs. Patients with T2DM were treated with oral hypoglycemic drugs. Most frequently, they were biguanide derivatives (metformin), sodium-glucose cotransporter-2 (SGLT2) inhibitors, dipeptidyl peptidase 4 (DPP-4) inhibitors, and all patients received statins.
Clinical examination
Patients with T2DM were enrolled in the study based on medical records and a panel of laboratory tests. All patients underwent a clinical examination, which included a medical interview and an oral examination by a dentist.
The control group consisted of volunteers without general health problems and with healthy oral mucosa who completed the same interview questionnaire, underwent a clinical examination, and consented to non-invasive thermographic examinations.
Our study focused on assessing tongue temperature, as its value significantly correlates with blood flow and metabolic processes. As a highly muscular organ resting freely on the floor of the mouth, the tongue is easily examined without contact. It was divided into two sectors: the tongue dorsum (TD) and the tongue apex (TA).
Inclusion and exclusion criteria
Figure 1 shows the inclusion and exclusion criteria. Inclusion criteria required adult patients of both sexes to be diagnosed with T2DM and to have a recorded glycated hemoglobin level, commonly used to monitor glycemic control. They consumed a balanced diet determined by a dietitian, considering individual needs, including body weight, lifestyle, type of treatment, and comorbidities. Overweight and obese patients were advised to control portions with a daily caloric deficit of 500 kcal.
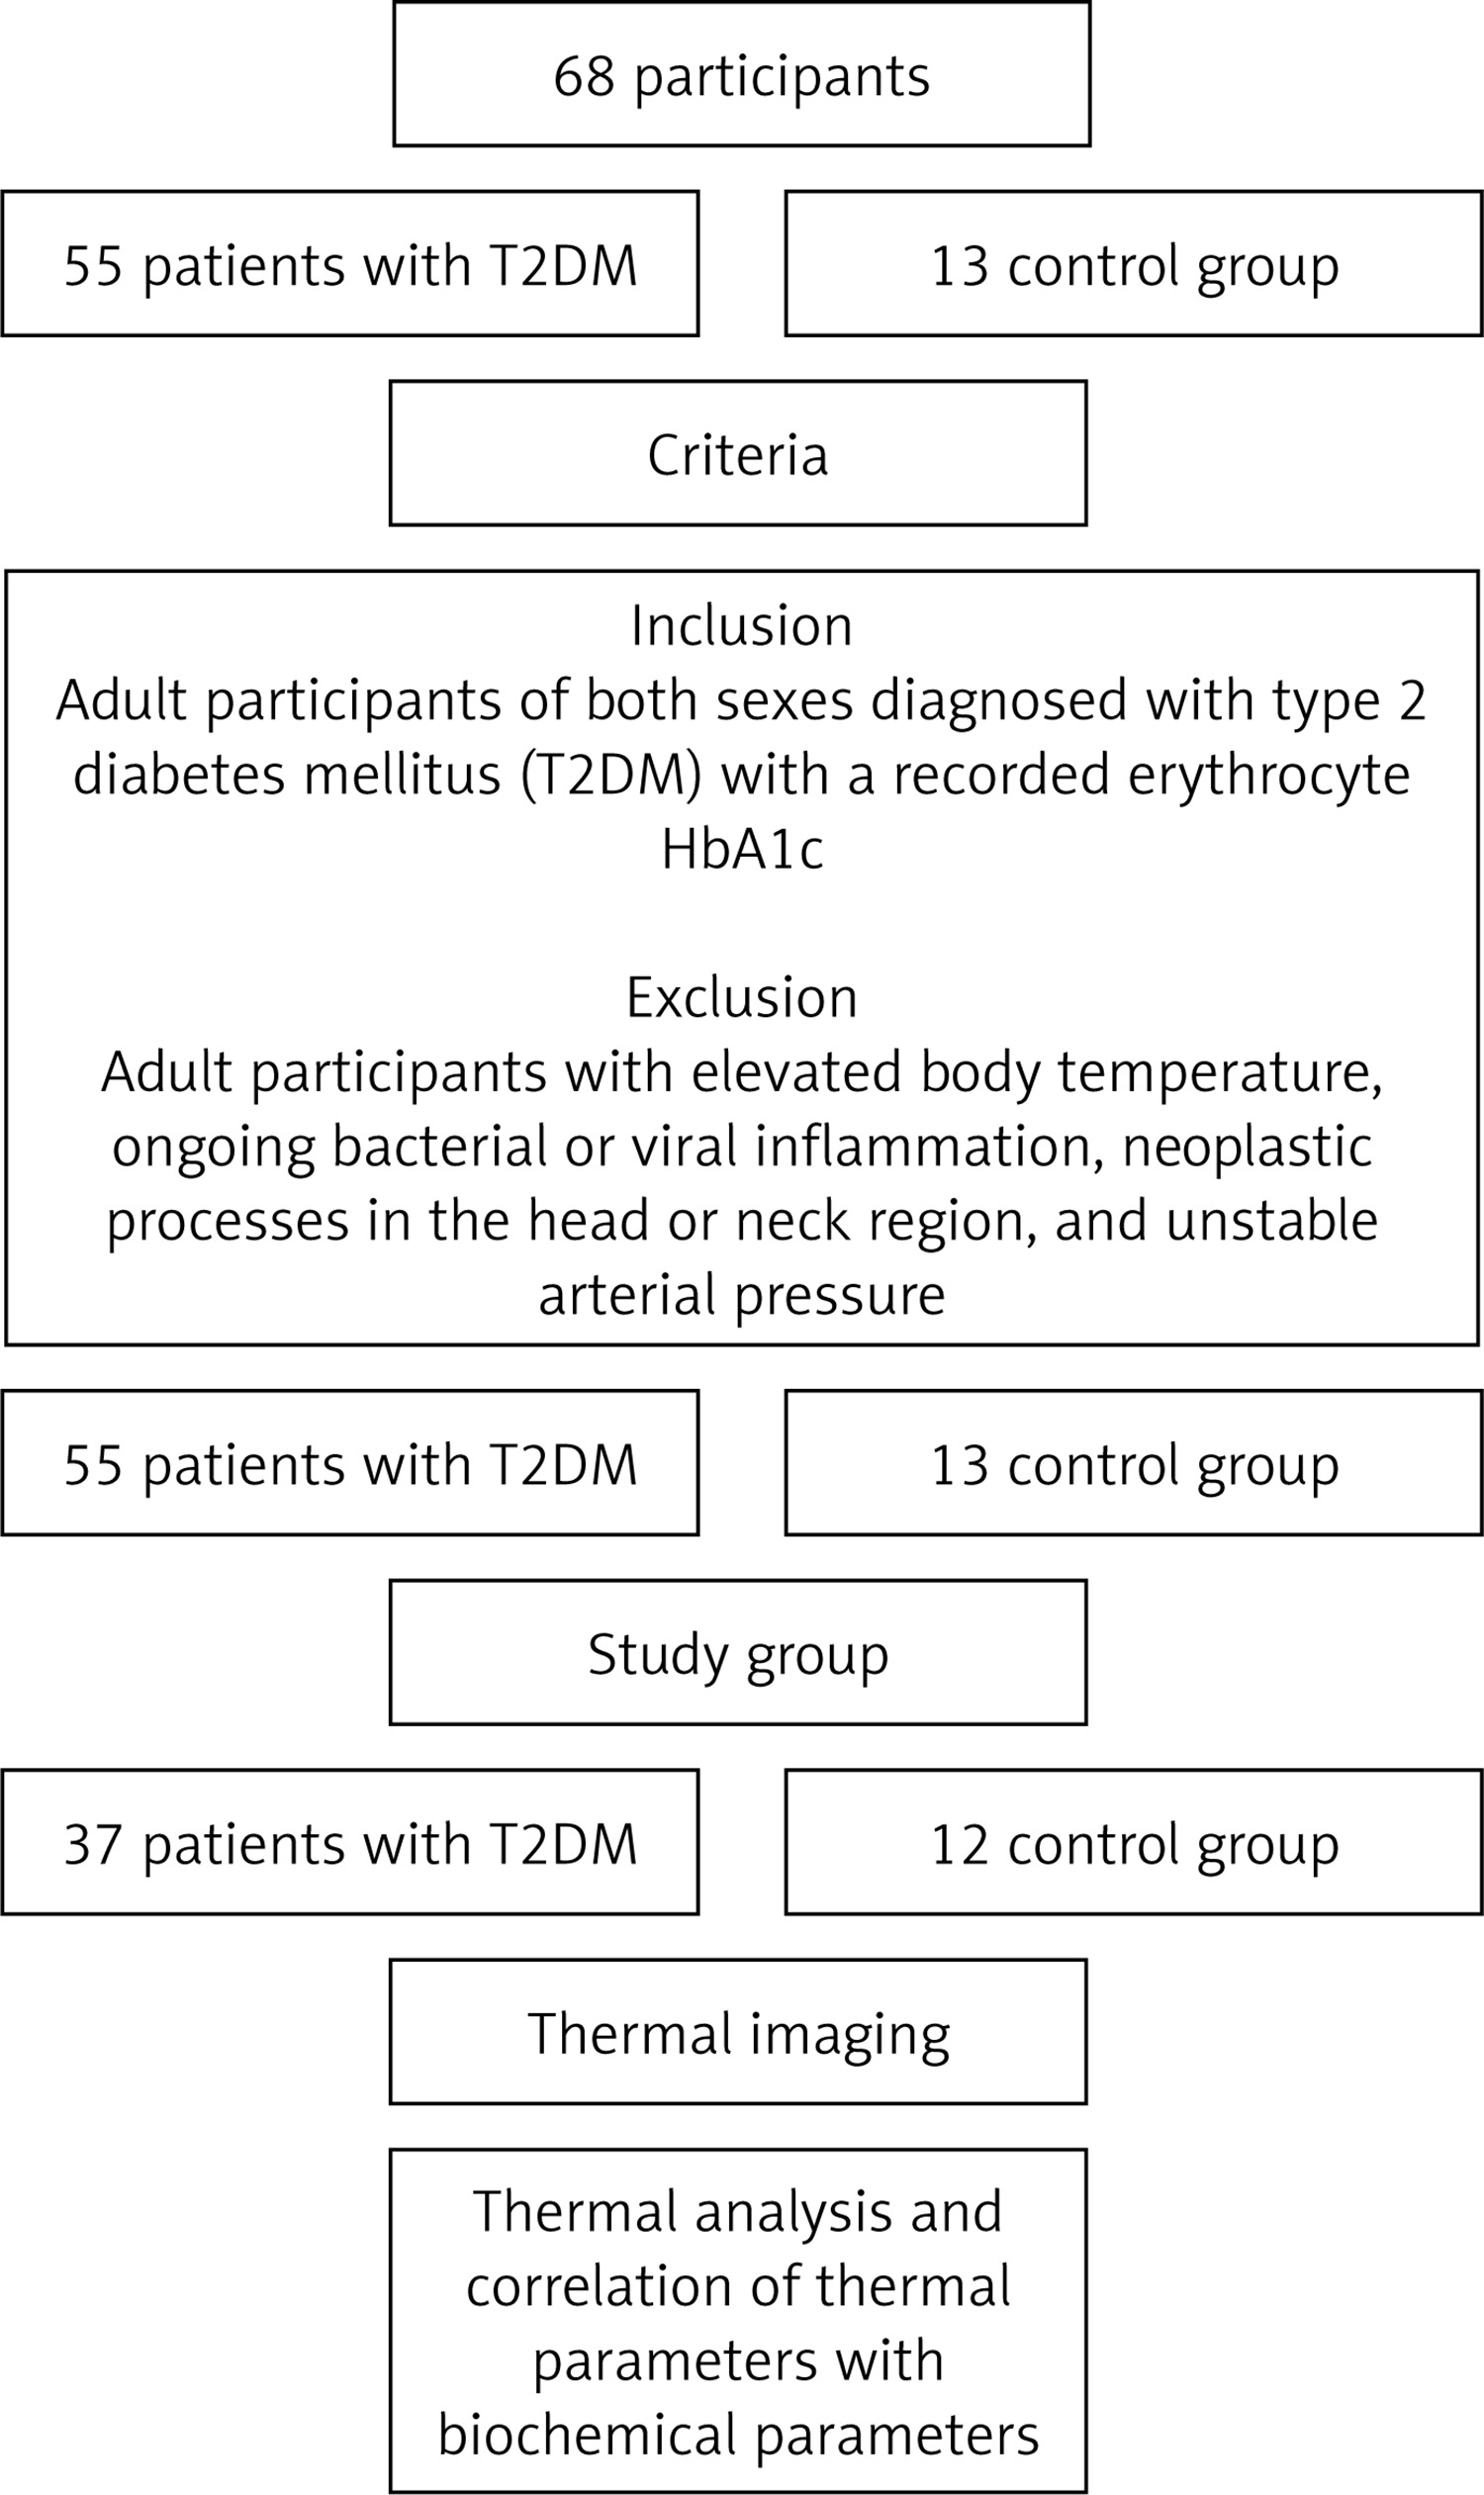
Exclusion criteria included patients with elevated body temperature, ongoing bacterial or viral inflammation, neoplastic processes in the head or neck, and unstable blood pressure. Patients with macrovascular complications and patients with microvascular complications, such as diabetic retinopathy and nephropathy, were excluded.
Biochemical parameters
Blood collection for the lipid profile was performed following a 12-hour fasting period. The patients were on previously prescribed medications; their medications had not yet been modified. Before the test, patients were advised to avoid alcohol consumption and intense physical activity to ensure accurate results. A 5–10 ml blood volume was drawn from the cubital vein using appropriate test tubes. Immediately after collection, the samples were transported to the hospital laboratory. Before further laboratory analyses were conducted, they underwent proper preparation, including centrifugation.
Depending on the specific parameter, enzymatic, colorimetric, and immunoenzymatic methods were employed for analysis. The standard lipid profile parameters assessed included total cholesterol (TC), low-density lipoprotein cholesterol (LDL-C), triglycerides (TG), high-density lipoprotein cholesterol (HDL-C), and non-HDL cholesterol (non-HDL-C).
Additionally, lipid profile ratios were calculated to provide more detailed information on cardiovascular risk, including the TG/HDL-C ratio, TC/HDL-C ratio, LDL-C/HDL-C ratio, and non-HDL-C/HDL-C ratio.
Two parameters were also studied to assess renal function: serum creatinine, measured using the colorimetric method, and the estimated glomerular filtration rate (eGFR), calculated based on creatinine concentration, age, and gender.
In addition to the lipid profile and renal function tests, glycated hemoglobin (HbA1c) was measured using the immunoturbidimetric method, providing insight into long-term glucose control.
Other parameters studied
According to a predetermined algorithm, the same researchers measured blood pressure and body temperature at a similar time in the early afternoon.
For at least 3 h before the measurements, the patient did not drink warm fluids or engage in intense physical activity. The measurement was taken at least 3 h after consuming a large meal. Body temperature was continuously measured with a non-contact thermometer on the forehead from a distance of 2–3 cm, with the patient at rest and in a relaxed body position.
Body mass index (BMI) was calculated from the patients’ height and weight recorded in their medical records using the standard equation.
The study was conducted according to the principles of the Declaration of Helsinki (1964), and its protocol received approval from the Local Bioethics Committee of the Silesian Medical University in Katowice (approval number: PCN/CBN/0052/KB1/67/II/22/23). Before participation, each volunteer and patient provided written informed consent on the diagnostic form and was thoroughly informed about the study objectives and procedures.
Thermographic investigation
All participants were examined by a physician or dentist immediately prior to the thermal imaging examination and prepared according to the established thermal imaging algorithm. The examination was performed on the day of admission to the hospital ward after taking unmodified medications.
Thermal imaging was performed in a room where the temperature stabilized at approximately 23 ±1°C. The distance of the thermal camera from the patient during the examination was 0.5 ±0.02 m. A standard infrared imaging protocol used in medicine [15] was employed. To stimulate the tissues, a cold provocation test was used, during which the patient was instructed to rinse his mouth with water at room temperature (22°C) for 60 s. During the measurements, patients were asked to breathe through their nose. The procedure lasted 10 min, and thermal measurements were performed 2 and 10 min after mouth rinsing, as per the protocols established by the authors [9, 10, 16]. The 2-minute time point was selected to capture the early phase of thermal recovery following the cooling stimulus, reflecting the rapid dynamics of microvascular reperfusion. The 10-minute time point was used to evaluate later recovery toward thermal stabilization. Both time points were chosen to maintain consistency with the authors’ previously established protocols and to facilitate comparison with earlier studies that used the same provocation approach. During both measurements, the patient’s mouth was open for 5 s, with the first measurement performed 2 min after rinsing and the tongue resting freely on the oral cavity floor. The second measurement, taken 10 min after rinsing, followed the same procedure. Thermal imaging was performed using a FLIR Systems T1020 thermal imaging camera with a sensitivity of < 0.02 K. Thermal images were analyzed using ThermaCAM Researcher Pro 2.8 SR-3 software. Two ROIs were analyzed for each participant: (1) the tongue apex (TA) and (2) the tongue dorsum (TD). ROIs were delineated manually on each thermogram using anatomical landmarks to ensure repeatability across subjects. The apex ROI covered the anterior 1/3 of the tongue tip, while the dorsal ROI covered the central dorsal surface, avoiding the lateral borders. Areas affected by saliva pooling, specular reflections, or motion artefacts were excluded from ROI contours. For each ROI, the mean temperature (Tmean) was calculated automatically by the software as the average of all pixels within the ROI. The thermal camera was factory-calibrated and operated in accordance with the manufacturer’s specifications. All examinations were performed under controlled ambient conditions (23 ±1°C) with a fixed camera–subject distance (0.5 ±0.02 m). The same acquisition setup (room conditions, camera position, and patient instructions) was used for all participants to minimize systematic measurement bias.
From the thermograms, the mean temperature (Tmean) was extracted. In thermal imaging, this parameter represents the average temperature value, expressed in degrees Celsius (°C), calculated from all pixels within a defined region of interest (ROI) on the thermogram.
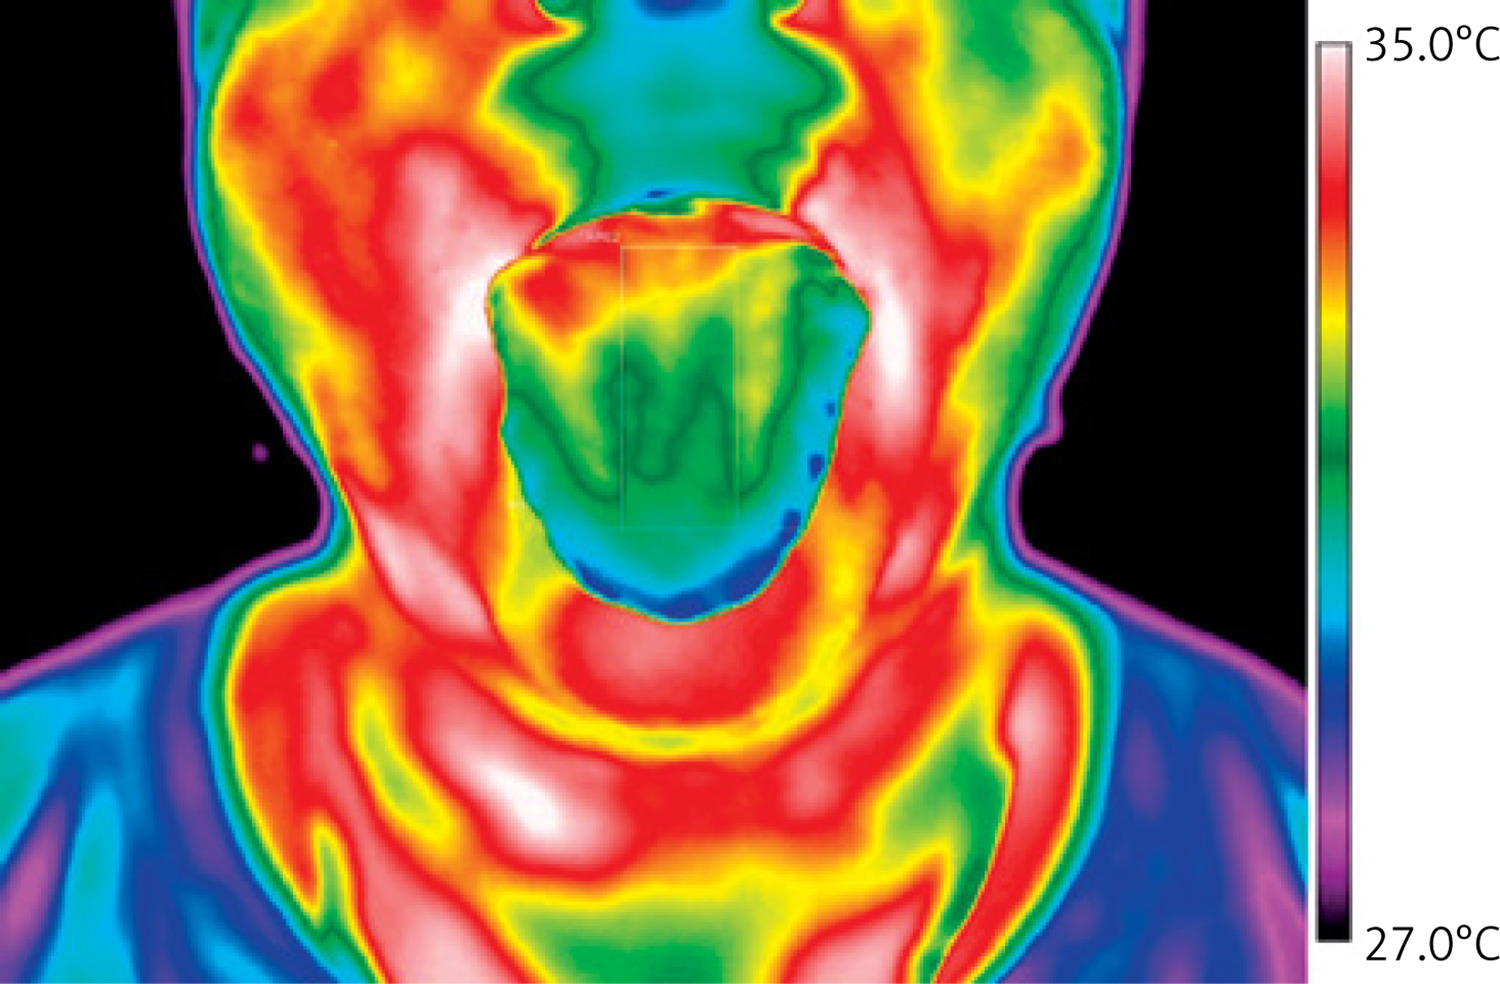
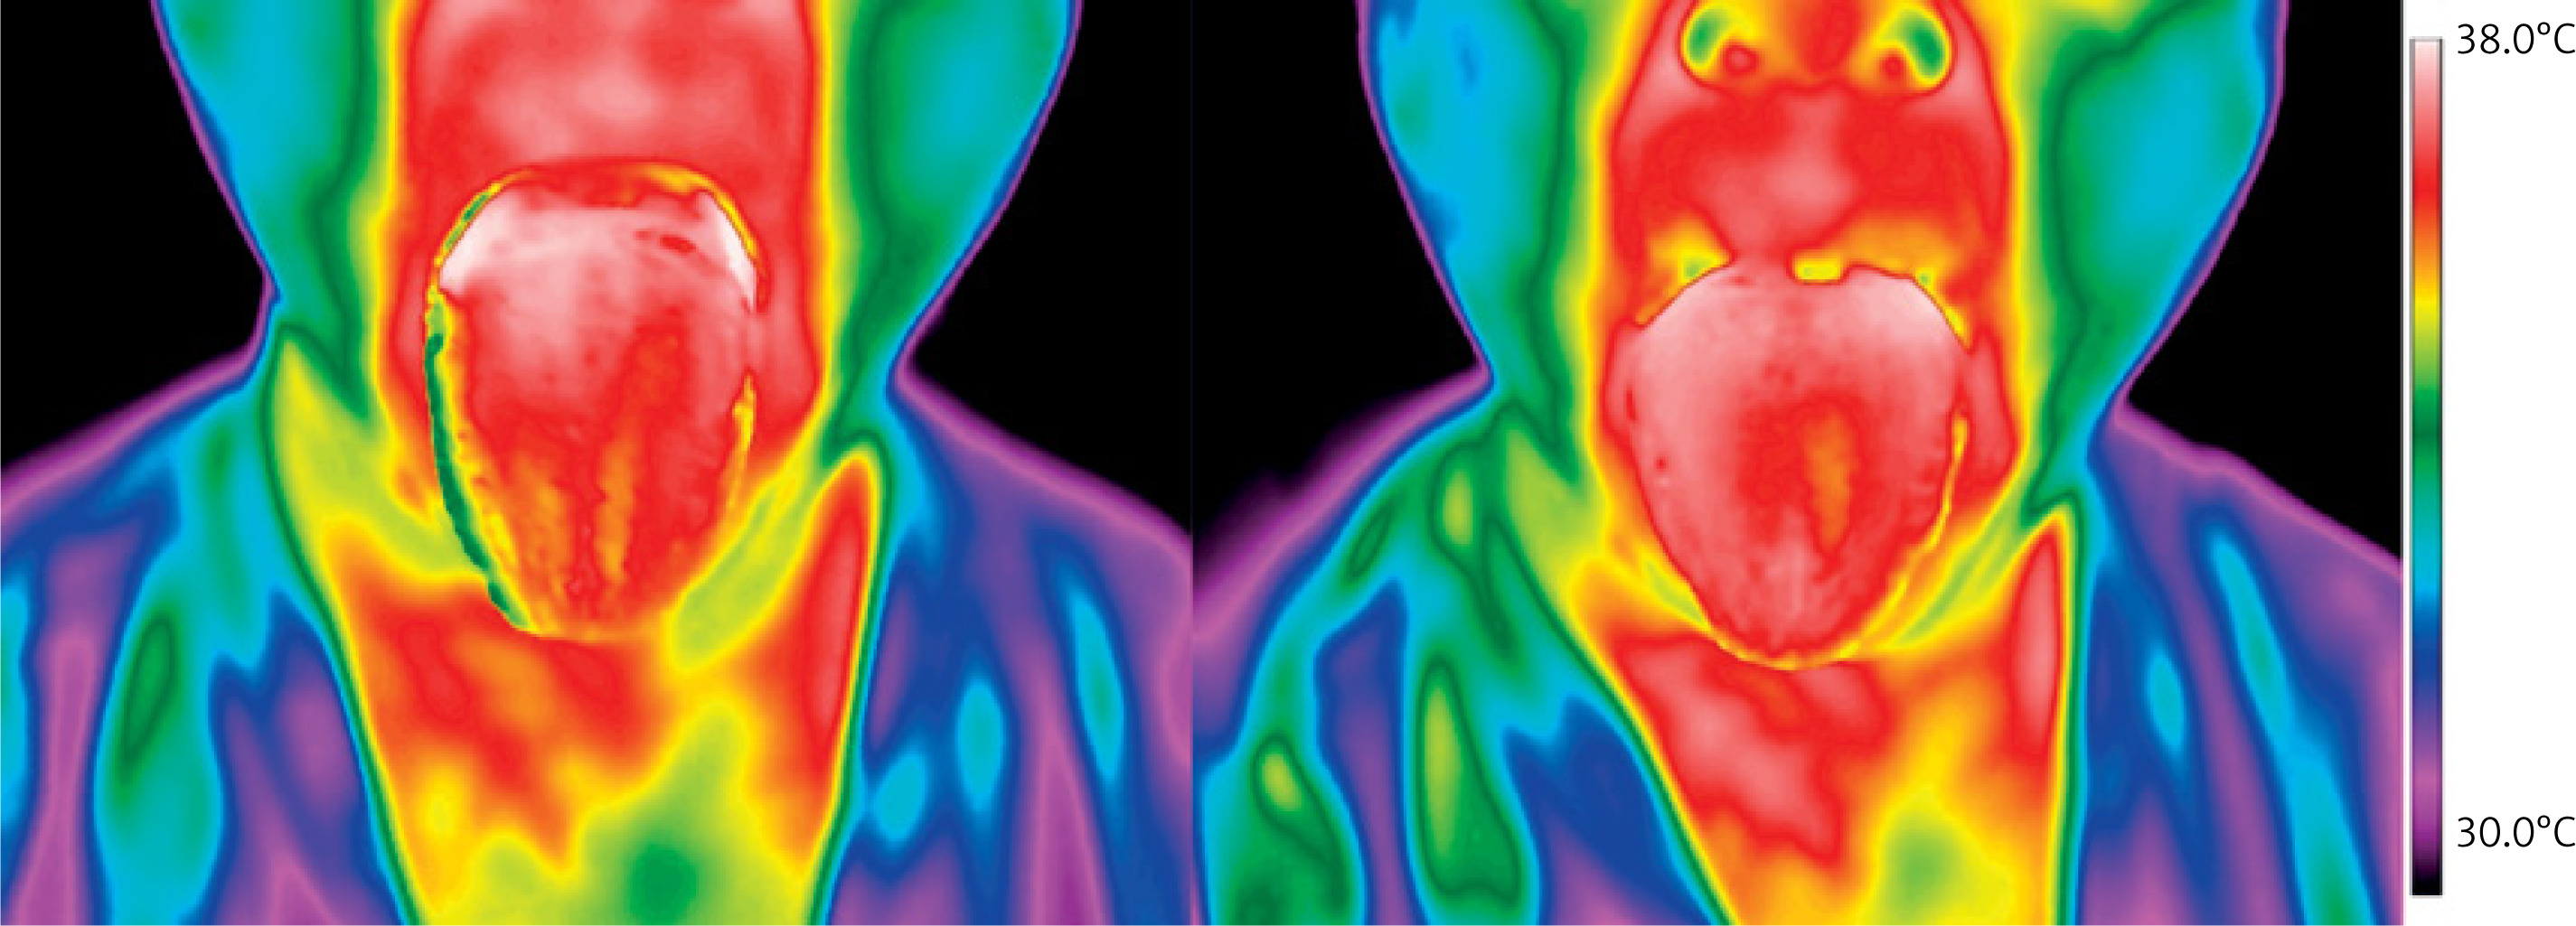
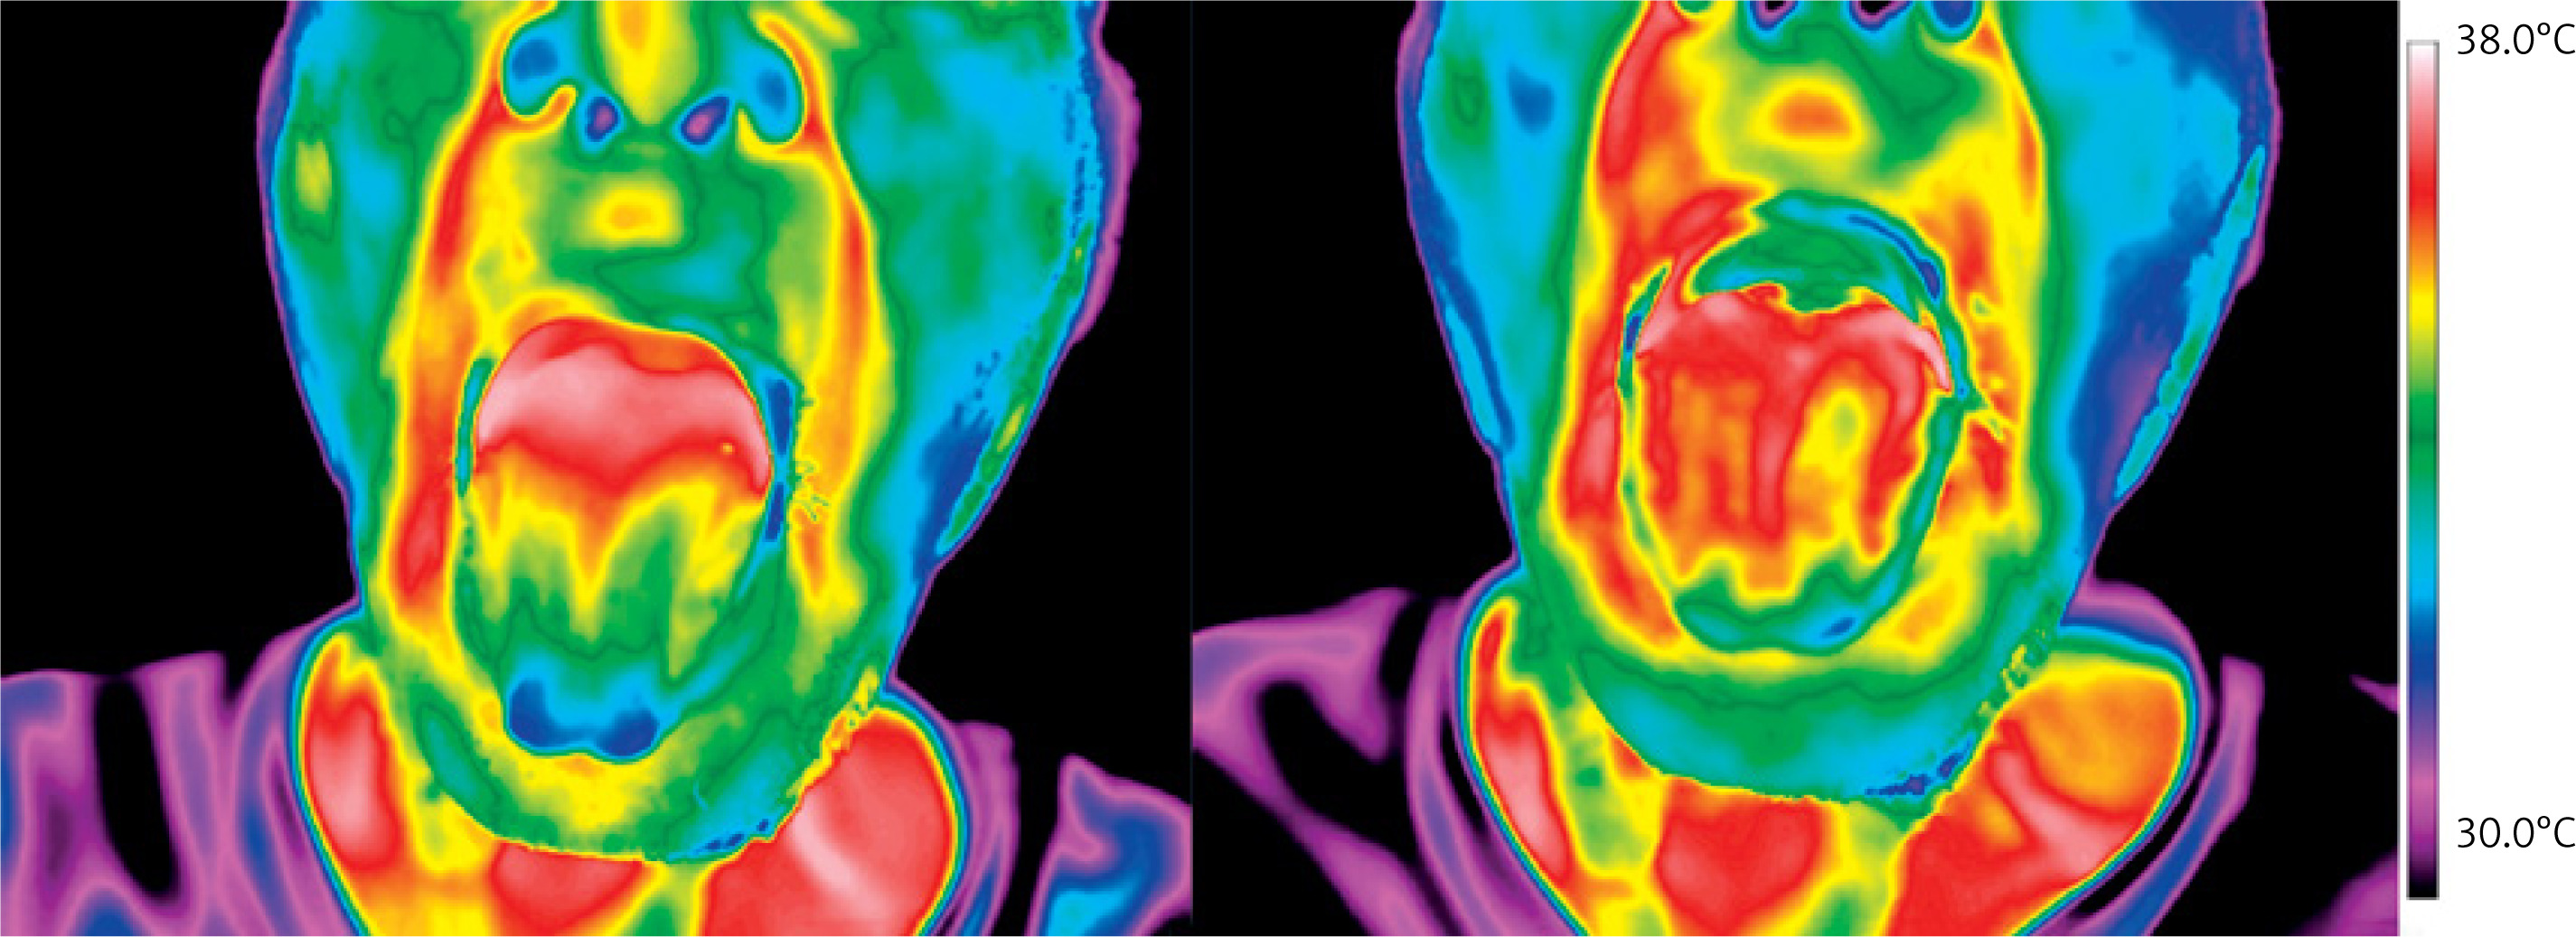
Thermal images of the tongue of a representative patient from the person with diabetes and the control groups are shown in Figures 2–4, respectively.
Figure 2
Thermal image of the tongue from a representative patient from the diabetes group. The regions of interest marked on the tongue are visible and were used for subsequent parametrization and further thermal analysis
Statistical analysis
Statistical analyses were performed using Statistica 10 software. The Shapiro-Wilk test was used to evaluate normality, while homogeneity of variances was also examined to assess the distribution characteristics of continuous variables. Differences in N across specific analyses were due to occasional missing laboratory values and/or the predefined removal of single outliers when justified to avoid distortion of correlation estimates. These exclusions were restricted to the affected analyses, did not alter the overall group sizes, and did not impact the statistical test results. When the assumptions of normality and equal variances were met, parametric tests were applied. Pearson’s correlation coefficient was used to evaluate the strength and direction of linear relationships between variables.
For variables that did not meet the assumptions of normality or homogeneity, non-parametric alternatives, such as Spearman’s rank correlation, were used. All statistical tests were conducted at a significance level of p < 0.05, with a 95% confidence interval.
Correlation analyses were carried out to determine the strength and direction of associations between quantitative variables, providing insight into potential linear relationships within the dataset.
To reduce measurement variability, thermograms were acquired and analyzed by trained personnel following a standardized protocol. ROI delineation and temperature extraction were performed using the same software and predefined anatomical rules to minimize inter-operator differences.
Results
The final analyzed cohort consisted of 29 patients with T2DM and 12 healthy controls. A comparison of biochemical lipid parameters between the two groups is presented in Table I. The primary objective of the thermographic analysis was not to differentiate between groups, but to assess correlations between tongue thermal parameters and lipid profile indices, particularly those associated with cardiovascular risk
Representative thermal images for both studied groups are presented in Figures 3 and 4.
The qualitative analysis of the presented thermal images shows that the tongue temperature decreases after mouth rinsing with water, reaching approximately 15°C below core body temperature. Two minutes after mouthwashing, differences in tongue thermal patterns between the diabetes and control groups become readily apparent. Healthy participants exhibited faster recovery of tongue temperature compared to patients with diabetes.
The other parameters measured in biochemical tests performed for both studied groups are collected in Table I. Table I summarizes biochemical parameters for the final analyzed sample (12 controls and 29 T2DM patients).
The primary objective of this study was to investigate correlations between selected biochemical markers and thermal parameters derived from tongue thermal imaging following a provocative test. This approach aimed to explore simple, non-invasive methods for assessing cardiovascular disease risk in patients diagnosed with type II diabetes.
Importantly, this work builds on the authors’ previous research, further supporting the potential application of tongue thermal imaging as a screening tool for diabetes and its common complication, ischemic heart disease.
The observed correlations were generally moderate to strong and predominantly positive. Notably, the only negative correlation was identified between the mean temperature of the tongue apex measured 2 min after oral cavity cooling with room temperature water and the HDL-C level. This inverse relationship suggests that higher tongue apex temperatures may be associated with lower HDL-C concentrations, potentially indicating altered vascular or metabolic responses in individuals with lower HDL-C levels. Notably, this correlation was among the weakest observed in the study.
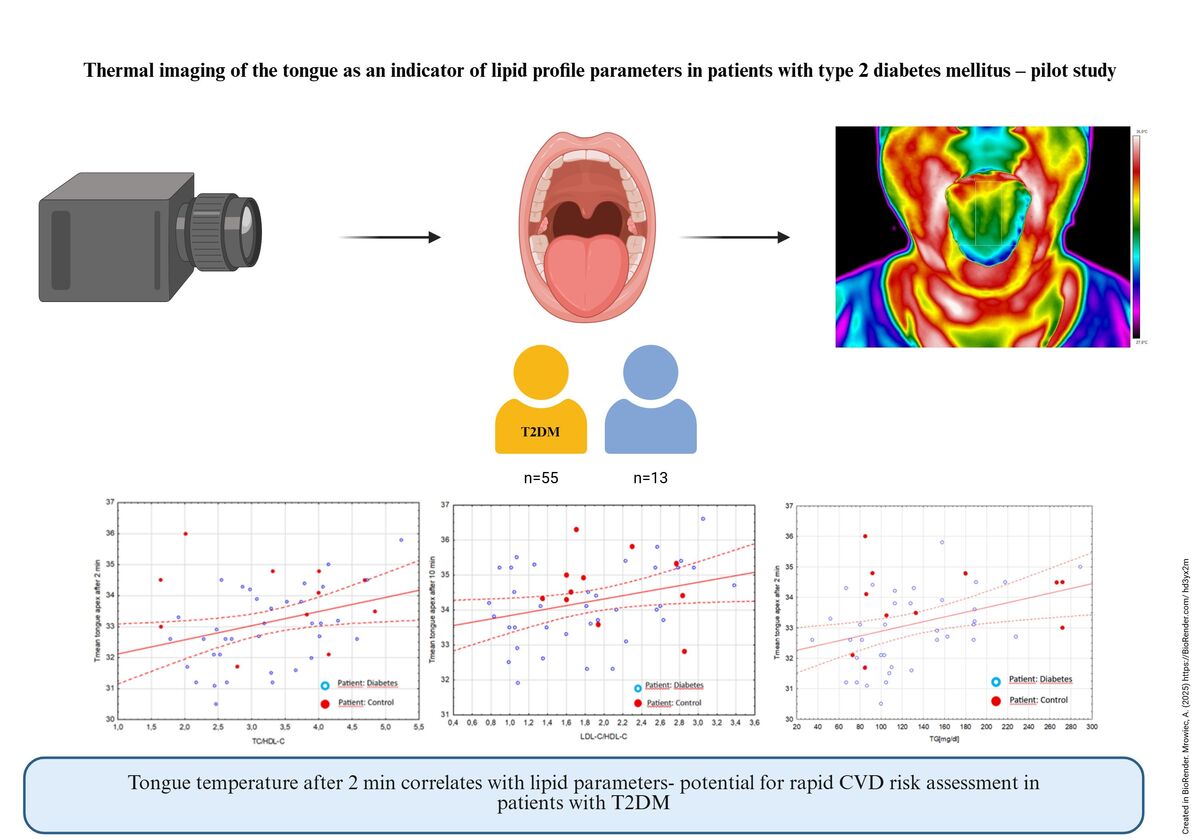
Correlation analyses presented in Figures 5–7 refer specifically to the mean temperature of the tongue apex (TA) measured 2 min after oral cavity cooling. The TA was selected as a region of interest due to its high vascularization and sensitivity to microcirculatory changes. The most crucial correlation coefficient values of 0.55, 0.55, and 0.54 were obtained for the Tmean of the TA after 2 min and TC/HDL-C and LDL-C/HDL-C, respectively. The correlation coefficients (r = 0.47–0.55) indicate moderate positive relationships, all of which were statistically significant (p ≤ 0.002). These results are presented in Figures 5 and 6.
Figure 5
Correlation between mean tongue apex temperature obtained 2 min after mouth rinsing and TC/HDL-C (r = 0.55, p < 0.001)
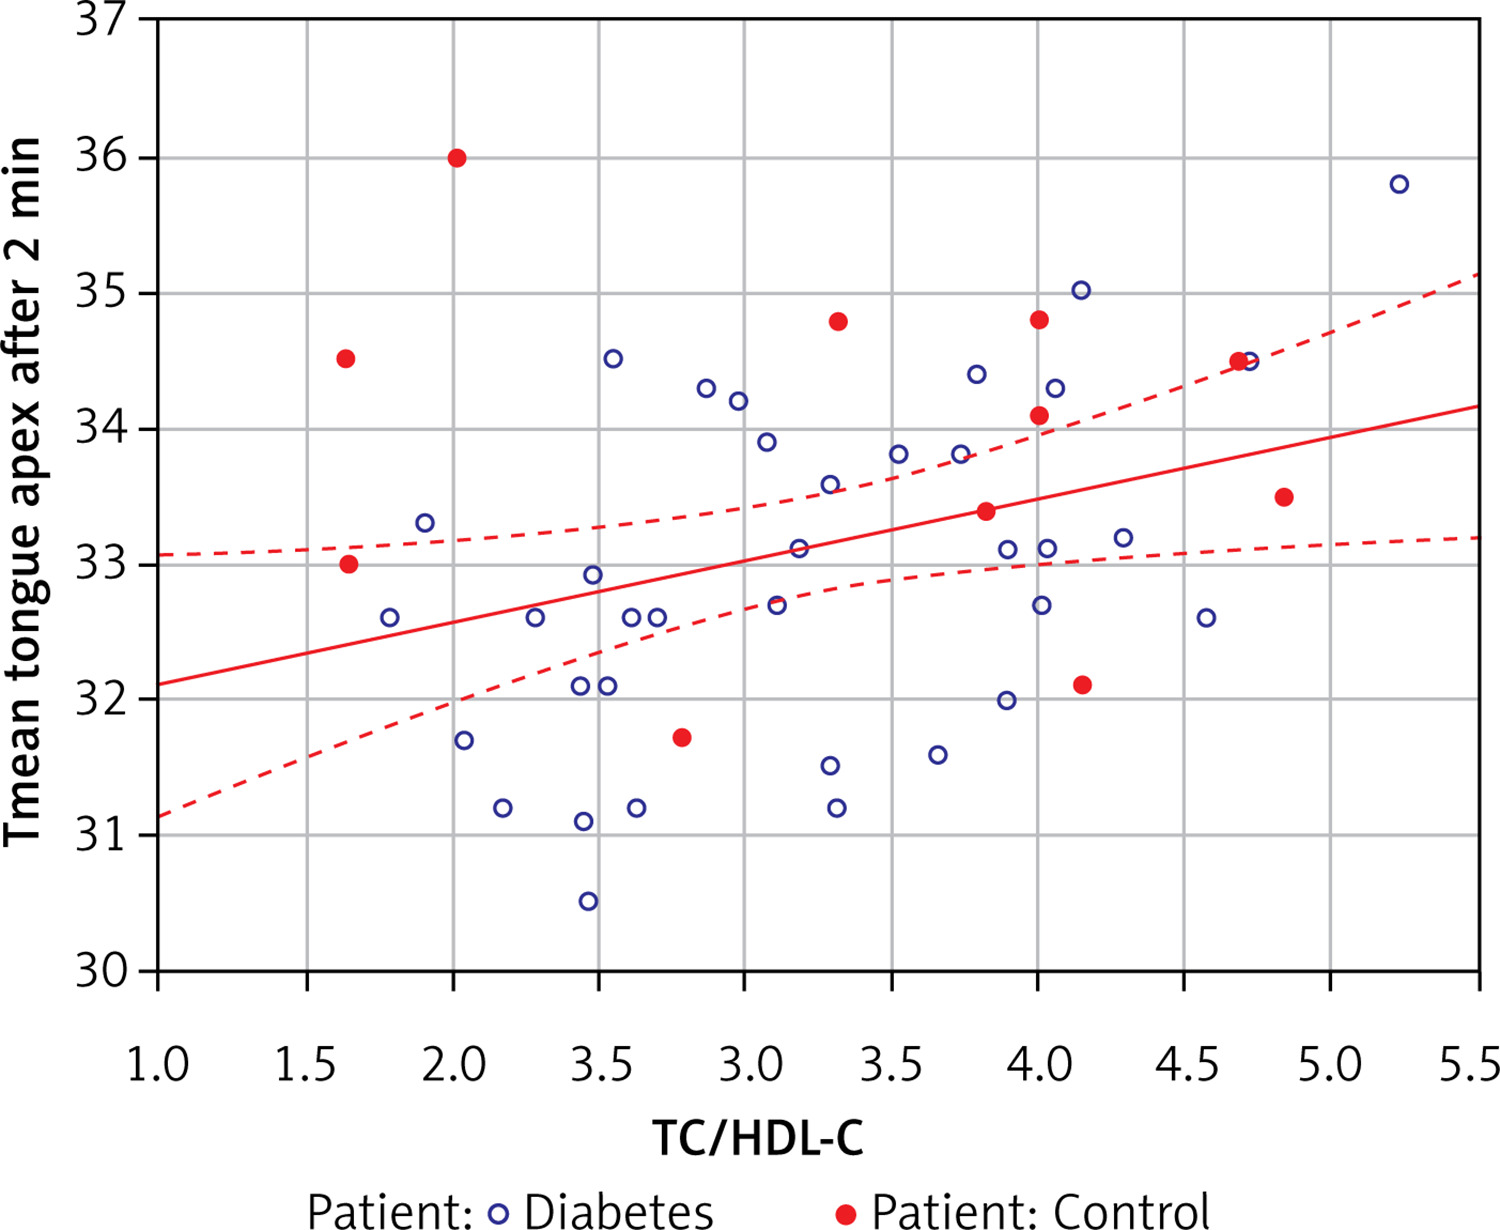
Figure 6
Correlation between mean tongue apex temperature obtained 2 min after mouth rinsing and LDL-C/HDL-C (r = 0.54, p < 0.001)
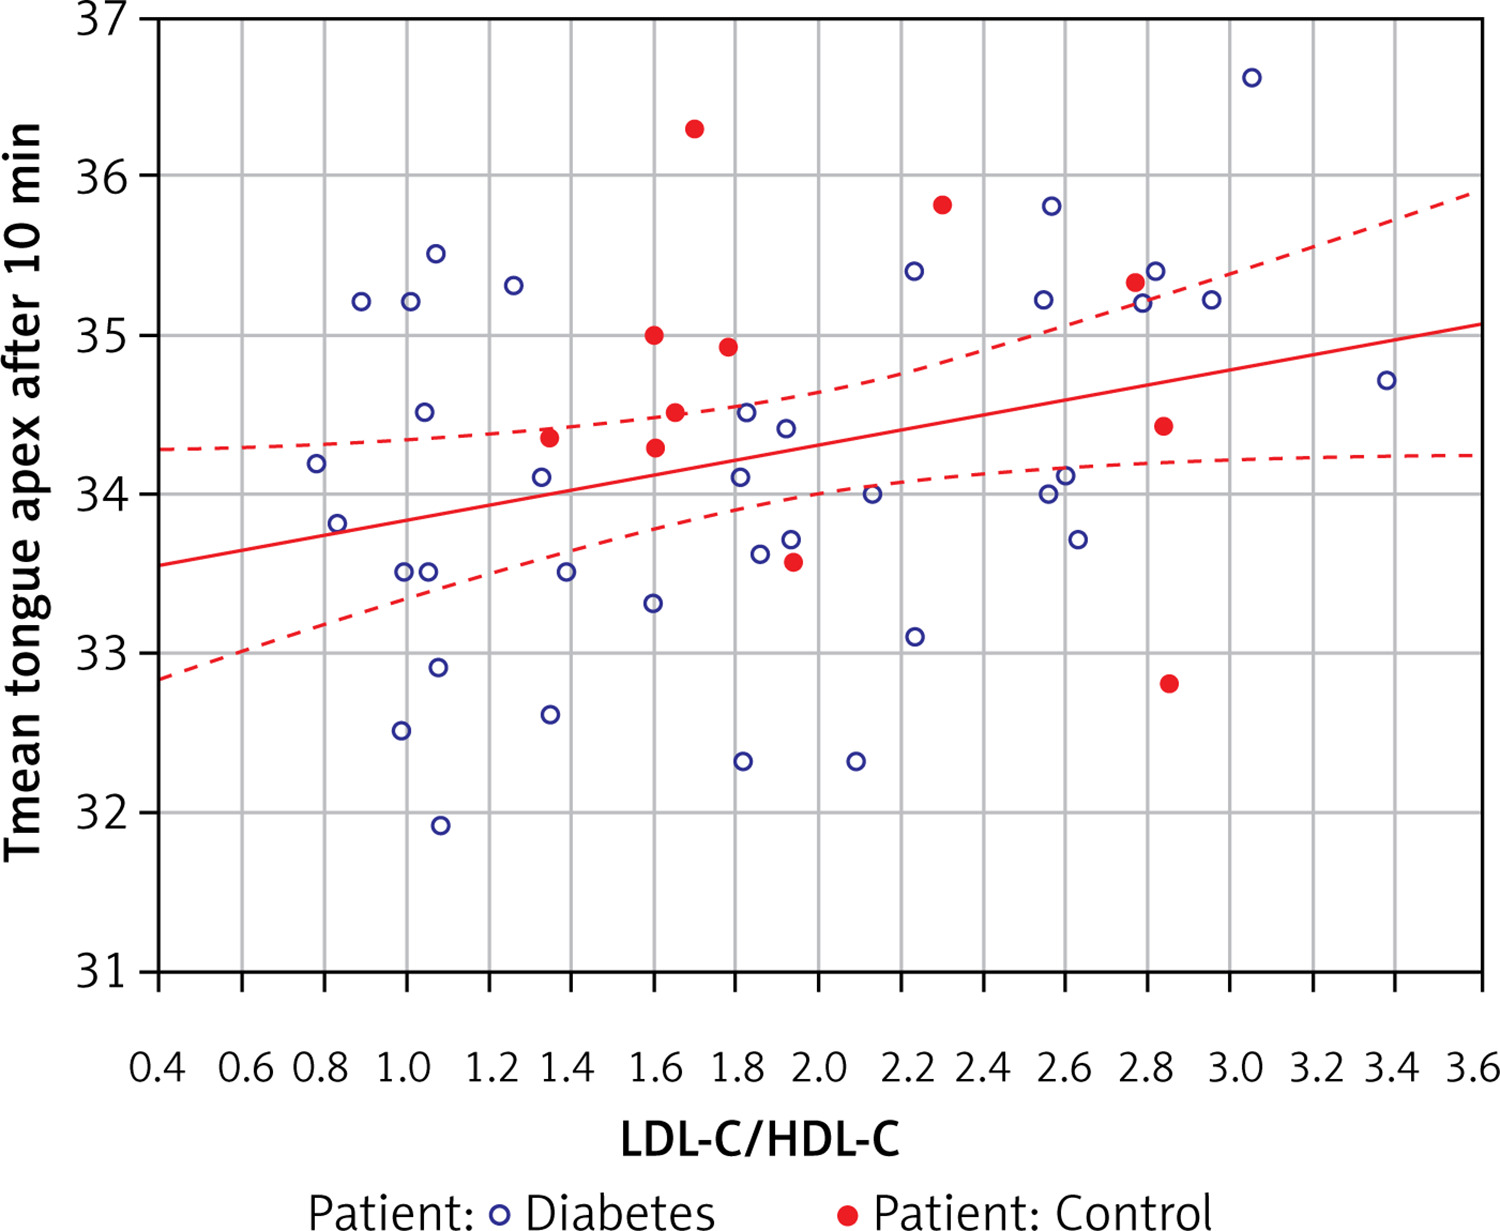
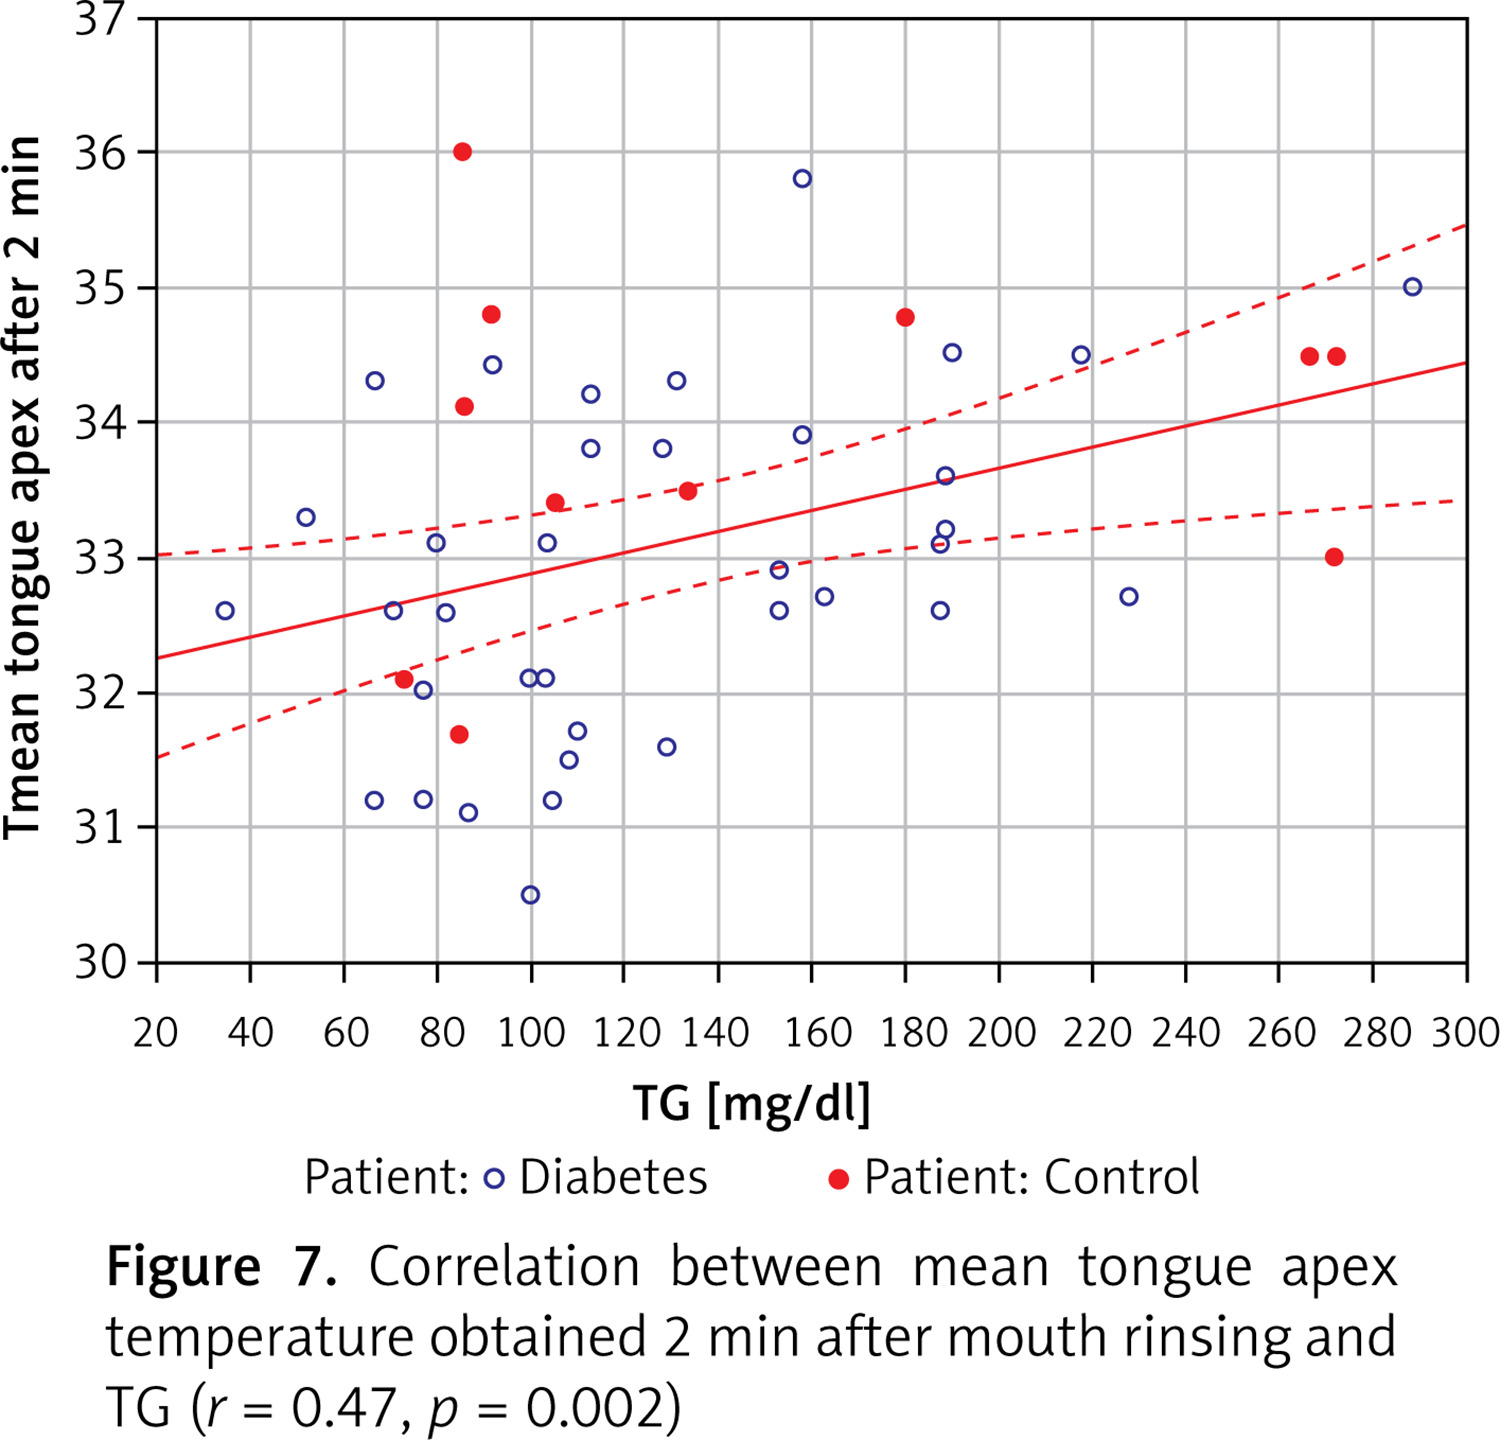
Figure 7
Correlation between mean tongue apex temperature obtained 2 min after mouth rinsing and TG (r = 0.47, p = 0.002
Correlation values and their statistical significance suggest that the tongue temperature increases significantly with higher TC/HDL-C and LDL-C/HDL-C ratios. The strong correlation obtained for the discussed parameters supports the validity of using infrared thermography as a noninvasive, fast, and safe screening test.
Of note, a moderate-to-strong positive correlation (0.47) was observed between the temperature of the TA 2 min after cooling of the oral cavity and the TG concentration. This finding may be particularly relevant for rapid assessment of the patient’s general health, for example during a routine dental visit. This relationship is illustrated in Figure 7. Correlation analyses were conducted on the combined dataset (T2DM and controls) to examine associations across a metabolic continuum. Subgroup-specific analyses are planned for future studies with larger cohorts.
Discussion
According to the American Diabetes Association and the European Association for the Study of Diabetes, T2DM is a chronic, complex disease, and its treatment requires multifactorial behavioral and pharmacological treatment to prevent or delay complications and maintain quality of life. It includes management of blood glucose levels, body weight, cardiovascular risk factors, comorbidities, and complications. Effective care demands a multidisciplinary, informed, and organized approach, with active patient engagement in self-care [17, 18].
Reports show that a significant percentage of people at increased risk for systemic diseases can be identified early in the dental office. In the United States, 19.5 million people visit a dentist annually, without seeing their primary care physician. Therefore, dentists are assigned a special role in healthcare [2].
Elevated levels of lipoproteins, such as TC, HDL, LDL, and TG, play an important role in the development of macrovascular and microvascular complications in various areas of the body. Disturbances in biochemical parameters lead to vascular dysfunction, blood flow disorders, and, consequently, changes in body temperature, which are a crucial indicator of health. Core body temperature correlates with increased cell density as the disease progresses [13, 14, 19, 20].
Contemporary knowledge of cardiovascular diseases increasingly focuses on precise identification of risk factors and their effective modification. Diagnostics based solely on LDL-C are insufficient [15, 16, 21]. New markers of cardiovascular risk are sought to improve the prediction of cardiovascular diseases. Therefore, individually calculated lipid indices are theoretically better and provide more information than laboratory lipid parameters in predicting cardiovascular diseases [22–24].
Our study builds upon previous analyses that demonstrated a statistically significant relationship between HbA1c concentration and changes in tongue dorsum temperature. The results confirm that tongue temperature, measured by the IRT method, significantly correlates with standard biochemical parameters, enabling the early assessment of diabetes-related complications.
Our work was motivated by the research of Thiruvengadam et al., which used regression analysis to assess the predictive power of thermal imaging in diagnosing cardiovascular disease. They found that TC (mg/dl) correlated with measured surface temperature in the following areas: the left temporal lobe, the left and right neck, and the left hand. HDL (mg/dl), in turn, correlated with measured surface temperature in the following areas: the left and right temporal lobes, the left and right forefeet, and the left and right hindfeet [14].
Our research indicates that the tongue temperature increases significantly with higher TC/HDL-C and LDL-C/HDL-C ratios. The strong correlation obtained for the discussed lipid profile parameters supports the validity of using infrared thermography as a noninvasive, fast, and safe screening test for patients with T2DM to detect predictors of CHD. It is also worth noting the strong, positive correlation between the tongue apex temperature and TG levels, which may represent an early indicator of dyslipidemia. However, in view of the primary goal of the study – to find a fast and reliable technique for the initial diagnosis of the patient’s general health condition in the dental office – the parameters obtained after a shorter interval, i.e., 2 min after oral cavity cooling, are far more practical. According to the position of the Polish Diabetes Association, the most effective preventive strategy to avoid and delay the occurrence and development of diabetes complications is early diagnosis and early intervention aimed at alleviating symptoms and reducing the consequences and costs of treatment [23].
According to Banach et al., patients benefit most from lipid-lowering treatment when adhering to three key principles: treatment of lipid disorders should begin as early as possible, therapy should be intensive, and it should be maintained lifelong [24, 25].
It is notable that diagnostic odds ratios calculated based on individual biochemical parameters – such as TC/HDL-C, LDL-C/HDL-C, and TG/HDL-C – consistently showed positive correlations with the tongue apex temperature. This supports the potential of using thermal imaging as a technique for rapid initial assessment of the patient’s general health status in the dental office. This expanded analysis further confirms the strong discriminative capability of tongue thermography, even without reliance on the provocation test. Moreover, integrating quantitative temperature differences alongside sensitivity and specificity evaluations significantly reinforces the diagnostic utility of this modality.
Several limitations of this study warrant consideration. First, all measurements were conducted exclusively during afternoon sessions to minimize the potential impact of diurnal fluctuations in ambient temperature. The control group comprised younger individuals, as exclusion of chronic diseases was applied only within this cohort, potentially limiting the generalizability of findings across age groups. Due to the relatively small sample size of patients and healthy controls after applying stringent inclusion and exclusion criteria, the present study should be considered a pilot investigation.
In conclusion, effective treatment of patients with T2DM requires cooperation between the patient, physician, and dentist. A dental examination is essential in the interdisciplinary treatment of T2DM and its complications. Lipid profile plays a vital role in treating T2DM, as it helps assess the risk of cardiovascular diseases, which are much more common in patients with T2DM. Tongue temperature parameters derived from thermal imaging show significant correlations with lipid profile, particularly after a provocation test. The test is noninvasive, does not require ionizing radiation, and is mobile, economical, and easy to use, which makes it available to every patient. The results suggest that thermovision diagnostics of the tongue surface provides a non-invasive biomarker reflecting lipid metabolism alterations and cardiovascular risk in T2DM patients, supporting its potential utility in early disease diagnosis.

