Introduction
From the aspect of metabolic risk, obesity is a heterogenous condition. Besides healthy, normal-weight individuals and “at risk” obese extremes, there are subjects with normal weight who are metabolically obese – “at risk” – and obese subjects who are still metabolically healthy [1, 2]. Regardless of body mass index (BMI), individuals with central or abdominal obesity, compared to those with the peripheral (gluteofemoral) type of adiposity, are predisposed to higher risk of developing health problems [3, 4]. This grouping of abdominal obesity and metabolic risk factors that can predispose an individual to a greater risk of developing cardiovascular diseases and diabetes is defined as metabolic syndrome [5].
The association of abdominal obesity with insulin-resistant metabolic syndrome is primarily attributed to visceral adipose tissue (VAT) expansion, its endocrine and metabolic impairments and consequent liver dysfunction [6–9]. More recent data imply that visceral fat accretion follows inadequate or overfilled abdominal subcutaneous adipose tissue (SAT) [10–12]. It has been hypothesized that once SAT reaches its maximal expanding capacity, fatty acids redistribute ectopically in less insulin sensitive VAT and non-adipose tissues, causing lipotoxic effects and insulin resistance [11, 13, 14]. Even if the pathophysiological significance of abdominal SAT to metabolic risk has been confirmed in many correlation and epidemiologic studies [4, 15–18], the molecular mechanisms of this abdominal adipose tissue storage dysfunction in obesity are still vague.
The importance of leptin and other adipokines, primarily adiponectin, in regulating insulin sensitivity and metabolism is well acknowledged. These energy metabolism-related adipokines integrate short-term energy changes in adipocytes and, in a complex network, provide feedback to the brain and peripheral tissues, to fine-tune energy input and expenditure [19].
Current endocrine models mostly explain the link between obesity and increased metabolic risk. Impaired circulatory levels of adiponectin correlate with increases in adiposity and cardio-metabolic risk [20, 21], while proinflammatory cytokines and serum leptin levels exponentially increase with increasing body fat mass [9, 22] and systemic insulin resistance [4]. However, peripheral (gluteofemoral) SAT can be a predominant source of circulating adipokines, especially in obese women [3, 23], and the existing paradigm based on hypoadiponectinaemia/hyperleptinaemia is still unable to explain the heterogeneity of metabolic risk in weighed-matched subjects. Also, the association of circulatory levels of resistin with obesity and metabolic syndrome in humans is still controversial [24].
Since the synthesis of adipokines reflects adipose tissue function in overall metabolic homeostasis, we assumed that differences in the expression of adipokines in different adipose tissues could reveal divergences in the metabolic phenotype. We examined the gene and protein expression levels of leptin, adiponectin, and resistin in paired biopsies of SAT and VAT in normal-weight and obese women, sub-classified as metabolically healthy or metabolically obese (“at risk”).
Material and methods
Subjects and sample collection
This study conformed to the standards set by the latest revision of the Declaration of Helsinki. The subjects volunteered for the study and signed an informed consent form. All procedures were approved by the Ethics committees of the Clinical Center of Vojvodina and the Institute for Biological Research at the University of Belgrade. The study group consisted of 30 overweight or obese women and 20 normal-weight women who were hospitalized for elective surgery. The subjects were premenopausal (with regular menses for the last 6 months) with an average age of 42.88 ±7.17 years and a stable body weight for the last 6 months. The indications for laparotomy were a benign case of one of the following: uterine myomas, cholelithiasis and ovarian cysts. According to criteria established by the WHO [25], BMI was used to define patients as normal weight (BMI 18.5–25 kg/m2) and overweight and/or obese (BMI ≥ 25 kg/m2). Body composition was assessed using a Tanita Body Composition Analyzer BC-418 MA III (Tanita Corporation, Tokyo, Japan). To assess fat distribution waist and hip circumferences were measured and the fat mass index (FMI) was calculated. To determine the metabolic profile, we used the criteria outlined by Karelis et al. [2]. Metabolically healthy individuals, regardless of nutritional level, were identified as those who fulfilled four out of five criteria: homeostasis model assessment of insulin resistance (HOMA-IR) < 1.95, triglycerides < 1.7 mmol/l, total cholesterol < 5.2 mmol/l, LDL cholesterol < 2.6 mmol/l and HDL cholesterol > 1.1 mmol/l. The subjects were classified as metabolically healthy normal weight (MHNW), metabolically obese normal weight (MONW), metabolically healthy obese (MHO), and “at risk” obese.
Biochemical tests
Anthropometric measurements, body composition assessment, and blood sampling were performed before surgery. Blood was collected, allowed to clot, and centrifuged (3500 g) to prepare serum. Total cholesterol and total triglyceride levels were determined by an enzyme-based method, HDL cholesterol levels were determined by the precipitation method with sodium phosphowolframate, and LDL cholesterol levels were calculated using the formula of Friedewald et al. [26]. Fasting blood glucose levels were determined by the Dialab glucose GOD-PAP method, and serum insulin and leptin levels were determined by ELISA. The HOMA-IR was used as a measure of insulin resistance (HOMA-IR = fasting glucose (mmol/l) × fasting insulin ((μU/ml)/22.5). Compared to the MHNW group, MONW women had significantly higher levels of total (6.18 ±0.90 mmol/l in MONW vs. 4.32 ±0.36 mmol/l in MHNW group) and LDL cholesterol (4.07 ±0.79 mmol/l in MONW vs. 2.29 ±0.60 mmol/l in MHNW group). Compared with the MHO women, “at risk” obese women had significantly higher levels of total (5.93 ±0.98 mmol/l in “at risk” obese vs. 4.12 ±0.31 mmol/l in MHO group) and LDL cholesterol (3.81 ±0.85 mmol/l in “at risk” obese vs. 2.02 ±0.71 mmol/l in MHO group), triglycerides (1.84 ±0.81 mmol/l in “at risk” obese vs. 1.02 ±0.39 mmol/l in MHO group), and insulin (14.34 ±8.86 mmol/l in “at risk” obese vs. 5.46 ±3.07 mmol/l in MHO group), as well as a higher HOMA-IR index (3.04 ±1.86 in “at risk” obese vs. 0.99 ±0.53 in MHO group). These biochemical data and details of the anthropometric and clinical characteristics of the patients included in this study were presented in our previous study [27].
At the beginning of surgery under general balanced anaesthesia, samples of abdominal adipose tissues were obtained from both subcutaneous and visceral (greater omentum) fat depots. One piece of adipose tissue was snap-frozen in liquid nitrogen and stored at –80°C until subsequent analysis.
RNA extraction and real-time PCR
Total RNA was prepared from 100 mg of isolated VAT and SAT using the TRIzol method (Invitrogen, Life Technologies, CA, USA) as previously described [28]. Real-time PCR was performed using SYBR Green on the ABI Prism 7000 Sequence Detection System (Applied Biosystems, Foster City, CA, USA). Primer sequences and cycling conditions used are listed in Table I. As an internal standard for amplification, the expression of RPLP0 (60S acidic ribosomal protein P0) was quantified in parallel. The primers were purchased from Metabion International AG (Martinsried, Germany). Prior optimization was conducted for each set of primers, and consisted of determination of optimal primer and MgCl2 concentration, template concentration, and verification of the efficiency of the amplification and non-specific amplification. PCR amplification was performed in duplicate in a total reaction volume of 20 μl. The reaction mixture consisted of 2 μl of diluted template, 10 μl of iQ SYBR Green Supermix 2x (Bio-Rad, Hercules, CA, USA), 200 nM forward and reverse primers, and 0.4 μl of 5-carboxy-x-rhodamine (Invitrogen).
Table I
Primers sequences and cycling conditions
SDS-PAGE and western blotting
For western blot analysis, a 400 mg tissue sample was homogenised (Ultra/Turrax homogenizer, Janke und Kunkel Ka/Werke, Staufen, Germany, 0–4°C) in 0.25 M sucrose, 0.1 mM EDTA and 50 mM Tris-HCl buffer, pH 7.4, which contained a 10 µg/ml protease inhibitor cocktail (Roche Diagnostic GmbH, Mannheim, Germany) as previously described [29]. The homogenates were sonicated for 10 s at 40 kHz and then centrifuged at 38000 g for 90 min. The protein concentration in the supernatant was estimated by the method of Lowry et al. [30] using bovine serum albumin as a standard. The extracts were stored at –80°C until western blot analysis.
Ten-microgram protein aliquots were boiled, electrophoresed by SDS-PAGE, and transferred to Hybond-P polyvinylidene fluoride membranes (Amersham, Piscataway, NJ, USA). The nonspecific binding sites of the membranes were blocked using 5% BSA in TBS (200 mM Tris, 1.5 M NaCl, pH 7.4) for 1 h at room temperature. Blots were then incubated with specific primary antibodies in TBS-T (0.2% Triton X-100 and 5% BSA in TBS) against the following: leptin (sc-842; 1 : 300), resistin (sc-80323; 1 : 2000) purchased from Santa Cruz Biotechnology, Inc. (Dallas, Texas, USA); adiponectin (ab25891; 2 µg/ml) and β actin (ab8226; 1 : 1000), purchased from ABCAM (Cambridge, UK). The sample was incubated overnight at 4°C followed by a 2 h incubation period at room temperature with horseradish peroxidase-conjugated IgG secondary antibodies. Goat anti-mouse secondary antibodies (Santa Cruz Biotechnology, CA, USA) were used to detect resistin and β actin. Goat anti-rabbit secondary antibodies (Santa Cruz Biotechnology, CA, USA) were used to detect leptin and adiponectin. The protein bands were visualised by chemiluminescence using a chemiluminescence detection system from Amersham (API, Indianapolis, IN, USA). The intensity of the bands was quantified using ImageQuant software. The volume was the sum of all the pixel intensities within a band (1 pixel = 0.007744 mm2). The ratio of dots per band for the target protein versus β-actin in the corresponding samples was averaged from three similar independent experiments, and expressed relative to that of the MHNW group, which was standardised as 100%. The data were then statistically analysed.
Immunohistochemical staining
Immediately after dissection and washing, visceral and subcutaneous adipose tissue samples were fixed in 10% formaldehyde at 4°C overnight, paraffin-embedded, and cut into 10-μm-thick sections. Tissues were deparaffinised by xylene and rehydrated in graded ethanol. The sections were incubated with 0.3% H2O2 in methanol for 30 min at room temperature to block endogenous peroxidase, followed by three washes in 0.015 M phosphate-buffered saline (PBS, pH 7.4), and incubated with a 1.5% normal goat serum (ABC Staining System, Santa Cruz Biotechnology Santa Cruz, CA, USA) in PBS for 60 min at room temperature to block non-specific binding. Sections exposed to anti-leptin antibodies (sc-842; 1 : 200, Santa Cruz Biotechnology) were incubated overnight at 4°C, followed by two PBS washes of 5 min each. Sections were then incubated with 1 : 200 IgG biotinylated serum goat anti-rabbit antibodies (ABC Staining System, Santa Cruz Biotechnology) in PBS for 30 min at room temperature, followed by two PBS washes of 5 min each. AB reagent (ABC Staining System, Santa Cruz Biotechnology) was added for 60 min at room temperature, followed by three PBS washes of 5 min each, and then incubated with 0.02% H2O2 and 0.075% 3,3’-diaminobenzidine-tetrahydrochloride (Sigma-Aldrich, Inc. St Louis, MO, USA) in 0.05 M Tris buffer, pH 7.6, for 10 min in a dark room. After being counterstained with haematoxylin, the slides were mounted and examined with a light microscope (Leica Microsystems, Germany). The specificity of the immune reaction was tested by omitting the primary antibodies.
Statistical analysis
Pearson’s correlation analysis was used to examine simple relationships between the serum leptin and BMI. The effects of BMI and metabolic risk on adipokines’ expression levels were assessed by two-way ANOVA using GraphPad Prism 5. The Tukey test was used to perform pairwise comparisons. Statistical significance was accepted at p < 0.05. Data are reported as mean ± standard deviation (SD) or standard error of the mean (SEM).
Results
In comparison to normal weight counterparts, both obese groups of women have higher FMI (p < 0.01). FMI was similar among the weight-matched women in respect to metabolic risk profile (Table II).
Table II
Fat mass index of metabolically healthy and metabolically obese (“at risk”) normal-weight and obese women
| Variable | Fat mass index Mean ± SD |
|---|---|
| Normal weight (n = 20): | |
| Metabolically healthy (n = 9) | 9.93 ±2.41 |
| Metabolically obese (n = 11) | 9.69 ±2.82 |
| Obese (n = 30): | |
| Metabolically healthy (n = 7) | 13.50 ±2.31** |
| Metabolically obese (n = 23) | 14.41 ±2.03** |
In comparison to normal-weight women, obese groups had significantly higher values of leptin (p < 0.05). However, comparisons of serum leptin levels in metabolically healthy and “at risk” weight-matched women did not show statistically significant differences (Table III).
Table III
Leptin levels in the serum of metabolically healthy and metabolically obese (“at risk”) normal-weight and obese women
| Parameter | Normal-weight, metabolically healthy (n = 9) | Normal-weight, metabolically obese (n = 11) | Obese, metabolically healthy (n = 7) | Obese, metabolically obese (n = 23) |
|---|---|---|---|---|
| Leptin [ng/ml] | 4.14 ±0.98 | 7.82 ±3.94 | 16.02 ±5.73* | 15.25 ±2.44* |
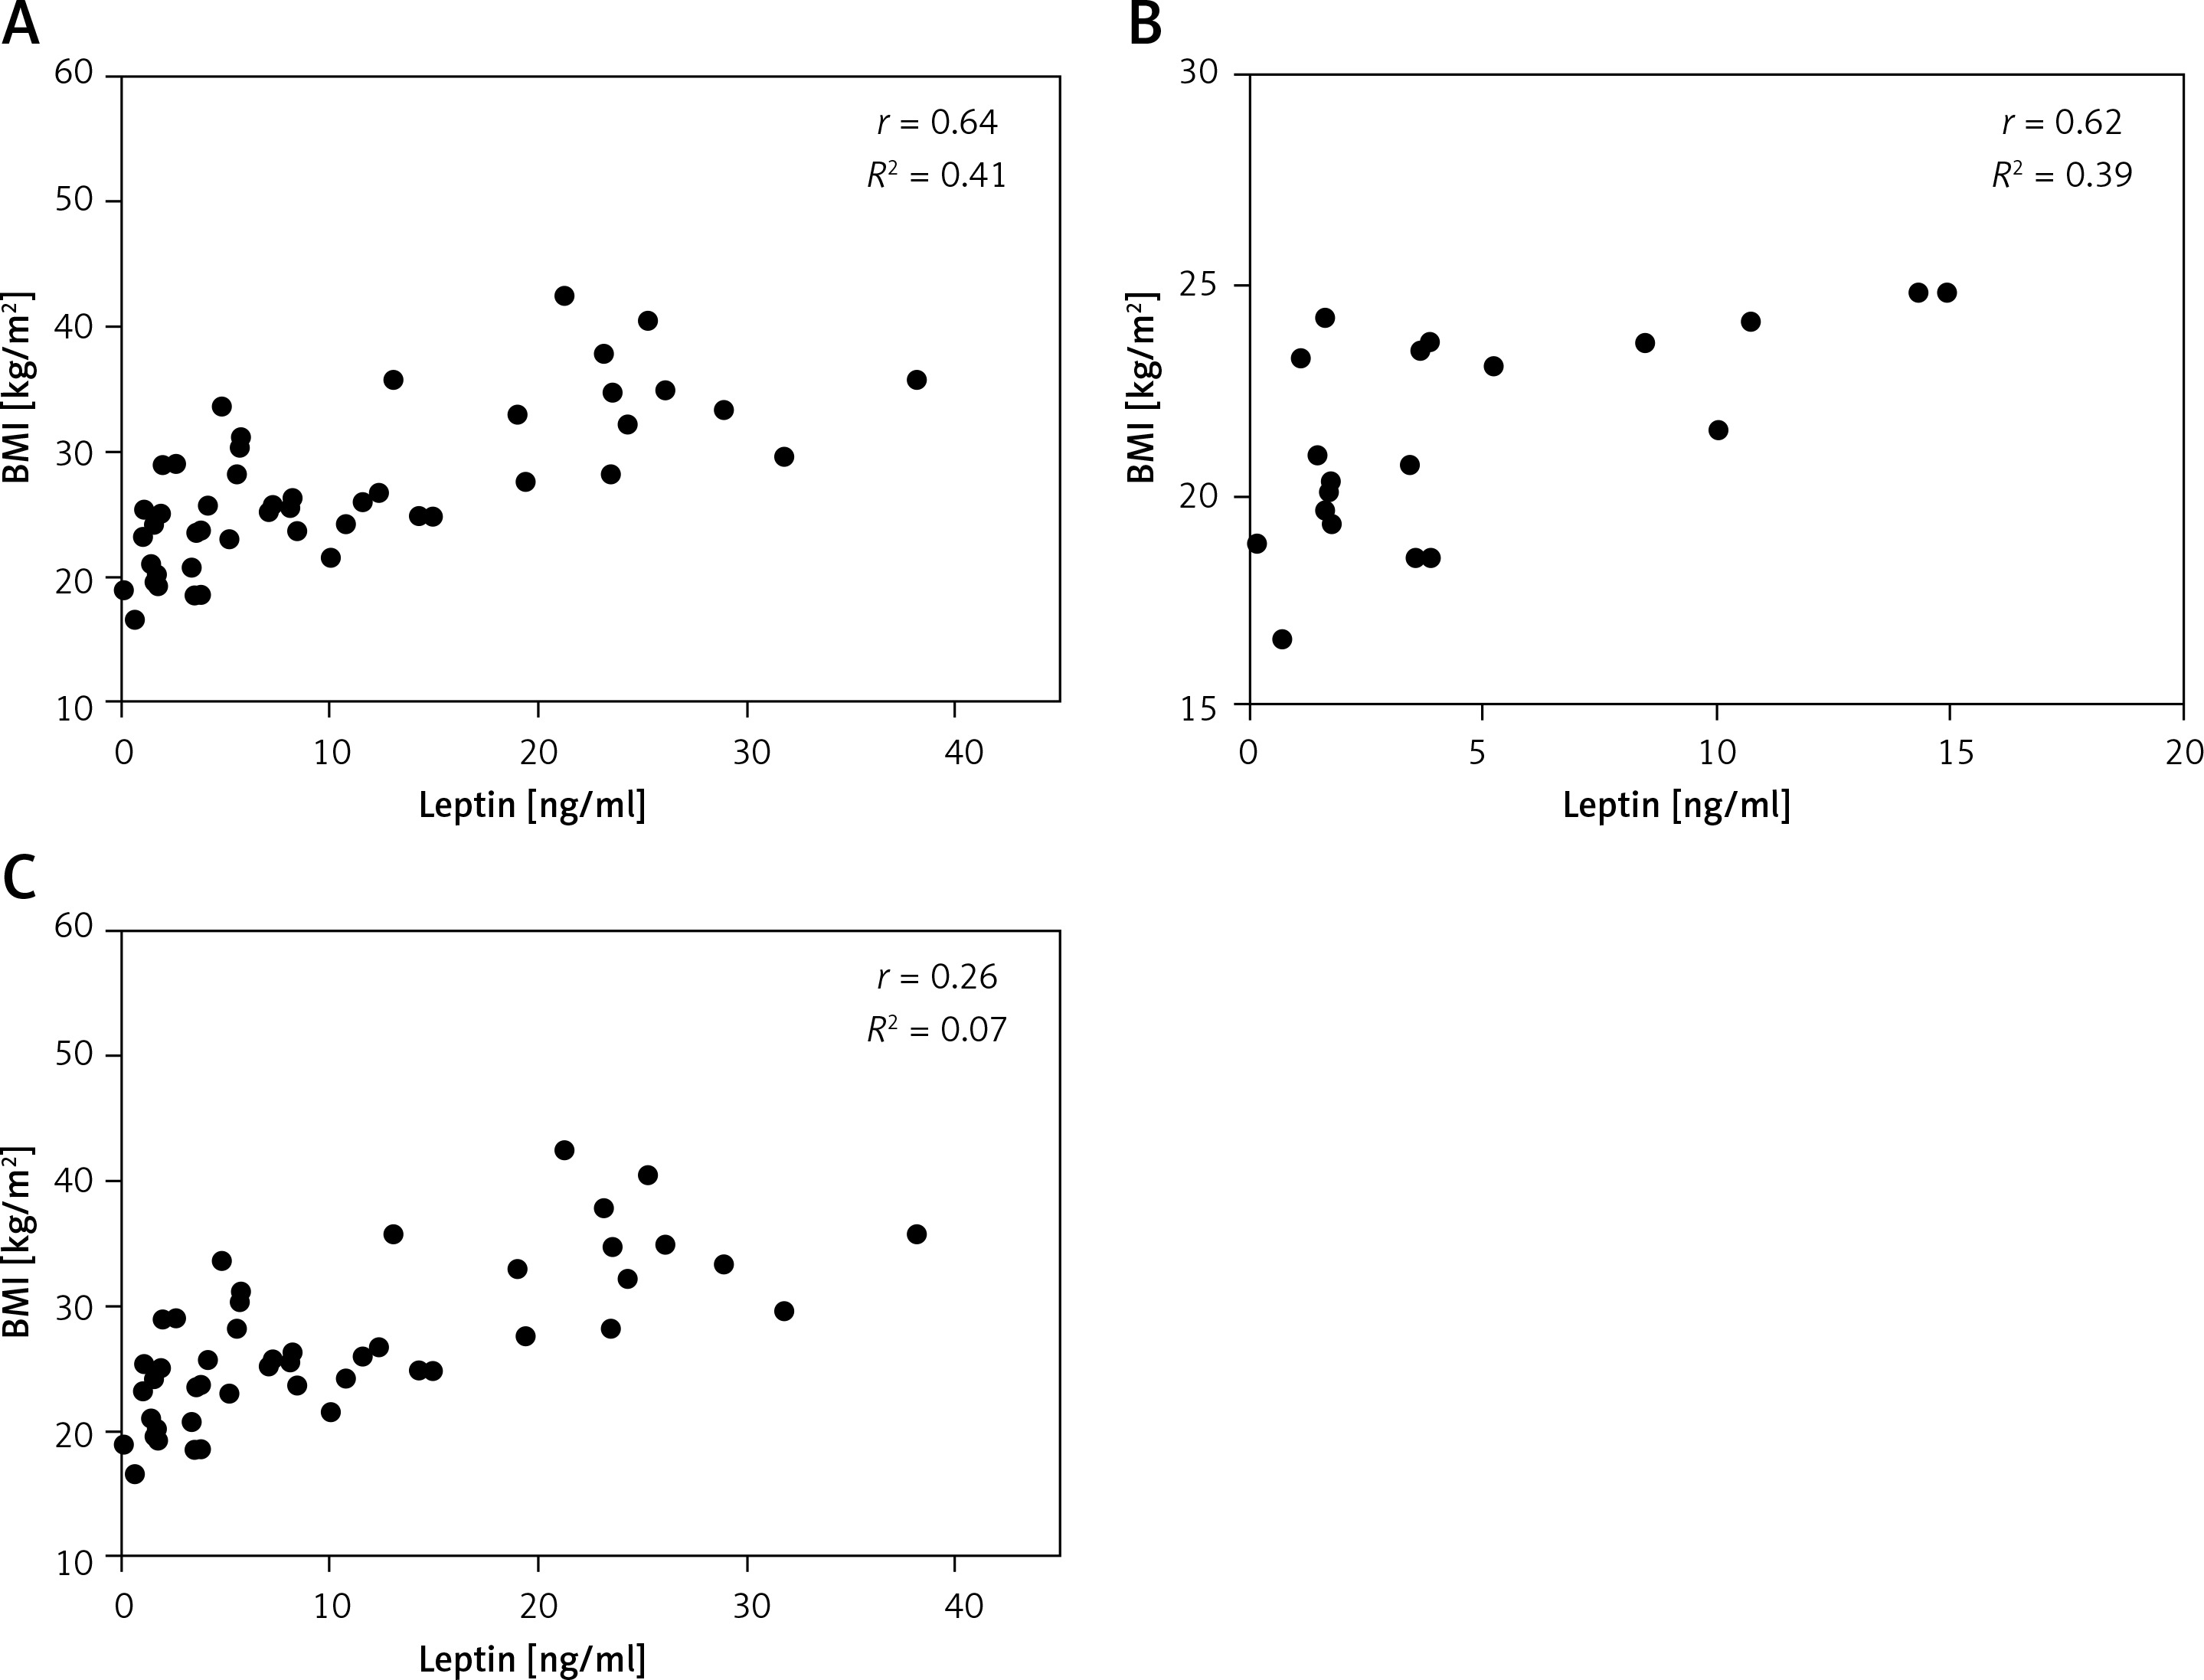
There was a significant correlation (r = 0.64, p < 0.0001) between serum leptin concentration and BMI in patients enrolled in this study (Figure 1 A). We also analysed the correlation between the plasma leptin levels and BMI in the normal-weight and obese subgroups, and the results showed a strong positive correlation only in the normal-weight group (r = 0.62; p = 0.0032) (Figure 1 B).
Figure 1
Relationship between serum leptin levels and BMI. Serum leptin levels are shown in relation to each subject’s BMI (A), and in normal-weight (n = 20) (B) and obese groups (n = 20) (C)
We further investigated whether the mRNA and protein expression levels of leptin as well as the levels of adiponectin and resistin in abdominal adipose tissues are associated with obesity “per se”, and/or with metabolic risk.
There was no significant interaction effect between BMI and metabolic risk profile on gene and protein expression of leptin in VAT, and expression levels of leptin increased with BMI, irrespectively of metabolic risk profile (p < 0.001 and p < 0.01 for main effect of BMI on gene and protein expression, respectively). There was also a main effect of metabolic risk, but only on gene expression of leptin in VAT (p < 0.01). Compared to MHNW women, MHO women had ~2.6-fold higher mRNA levels and about 63% higher leptin protein levels in the VAT, while metabolically obese (“at risk”) obese women had ~3-fold higher mRNA levels of leptin and ~78% higher levels of leptin protein in this depot (Figures 2 A, C). Among the weight-matched women, there were negligible differences in leptin expression levels in the VAT.
Figure 2
mRNA and protein expression levels of leptin in the visceral (A, C) and subcutaneous adipose tissues (B, D) of metabolically healthy normal-weight, metabolically obese normal-weight, metabolically healthy obese, and metabolically obese (“at risk”) women. The protein content is expressed relative to that of a metabolically healthy normal-weight control, which was standardised to be 100%. The results of a representative example from three observations are shown. The data were quantified as described in the Materials and methods section. The values represent the mean ± SEM
*Comparison with metabolically healthy normal-weight group, *p < 0.05, **p < 0.01, ***p < 0.001. #Comparison with corresponding metabolically healthy group, ##p < 0.01.
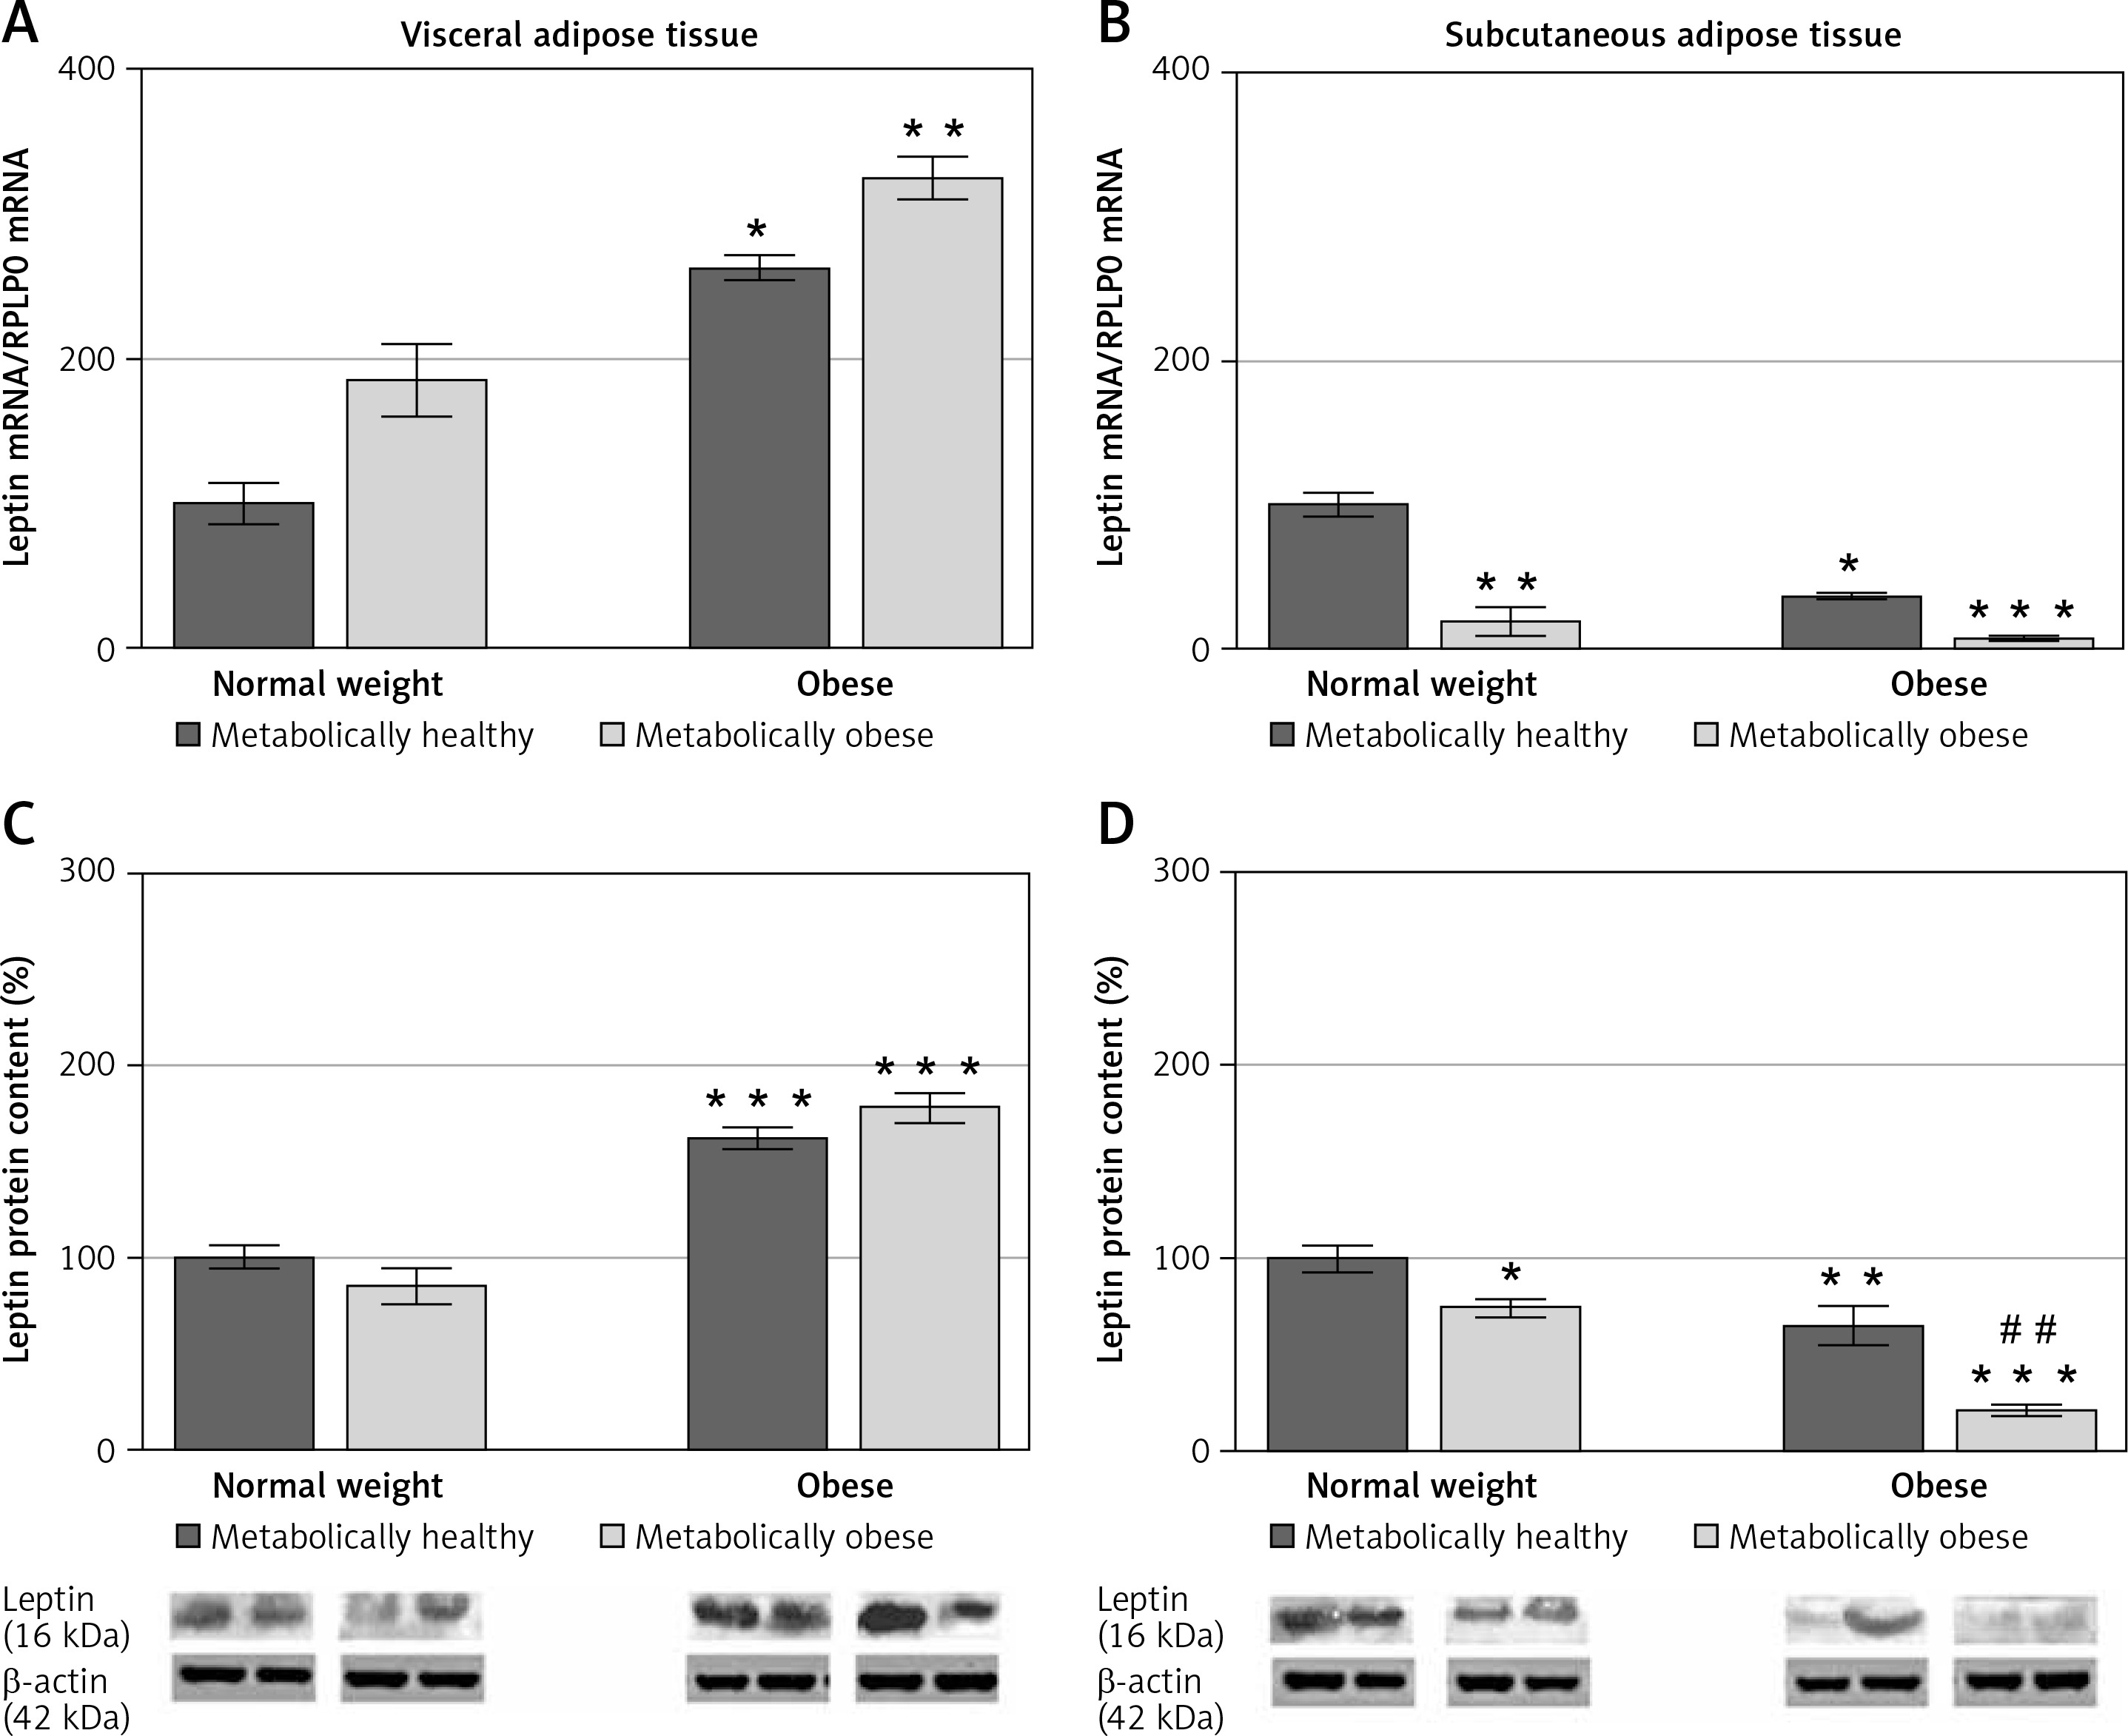
There was a significant interaction effect between BMI and metabolic risk profile on leptin gene expression in SAT (p < 0.05), although there were also prominent main effects of BMI (p < 0.01) and metabolic risk (p < 0.001). However, there was not a significant interaction effect of BMI and metabolic risk on protein expression of leptin in SAT; it decreased with metabolic risk in SAT, regardless of BMI (p < 0.001 for main effect of metabolic risk). There was also a significant effect of BMI (p < 0.001). MHO women had ~36% (p < 0.01) of the leptin mRNA in the SAT compared with MHNW women (Figure 2 B). Among the weight-matched groups of women, both metabolically obese groups had lower levels of leptin gene and protein expression in SAT versus their corresponding metabolically healthy controls (Figures 2 B, D). In the SAT of MONW women only 18.3% of the mRNA leptin levels (Figure 2 B) and ~74% of the leptin protein expression (Figure 2 D) observed in MHNW controls were detected. Similarly, in the SAT of “at risk” obese women ~20% of the leptin gene expression and ~32% (p < 0.01) of the leptin protein expression observed in the MHO control were observed (Figures 2 B, D).
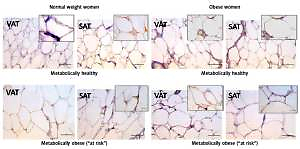
Leptin immunopositivity was found in large, differentiated unilocular adipocytes, and also in some less differentiated adipocytes (with paucilocular or multilocular appearance) in both VAT and SAT (Figure 3). In the normal-weight women there was a faint immunopositive reaction for leptin in the VAT, while in the corresponding SAT of the same subjects a clear immunopositive reaction for leptin was seen (Figure 3, left). However, in the MHO women this difference in leptin immunopositivity faded, indicating again higher leptin occurrence in the VAT, and lower leptin presence in the corresponding SAT of the same obese women. Moreover, metabolically obese women (MONW and “at risk” obese), compared to their weight-matched metabolically healthy controls (MHNW and MHO), displayed stronger leptin immunopositivity in VAT, and weaker immunopositivity in corresponding SAT samples (Figure 3, right). In summary, higher metabolic risk in weight-matched women can be discriminated by higher gene expression of leptin in VAT and lower protein synthesis of leptin in SAT.
Figure 3
Leptin immunohistochemistry in the visceral (VAT) and subcutaneous (SAT) adipose tissues of metabolically healthy normal-weight, metabolically obese normal-weight, metabolically healthy obese and “at risk” obese women. Immunoreactivity for leptin is visible in the cytoplasm of the visceral and subcutaneous adipocytes of all investigated groups, whereas the highest immunoreactivity is visible in the VAT of the “at risk” obese women compared with that in the controls. Omission of the primary antibody completely eliminated the immunoreactivity (NK). Scale bars: 20 μm
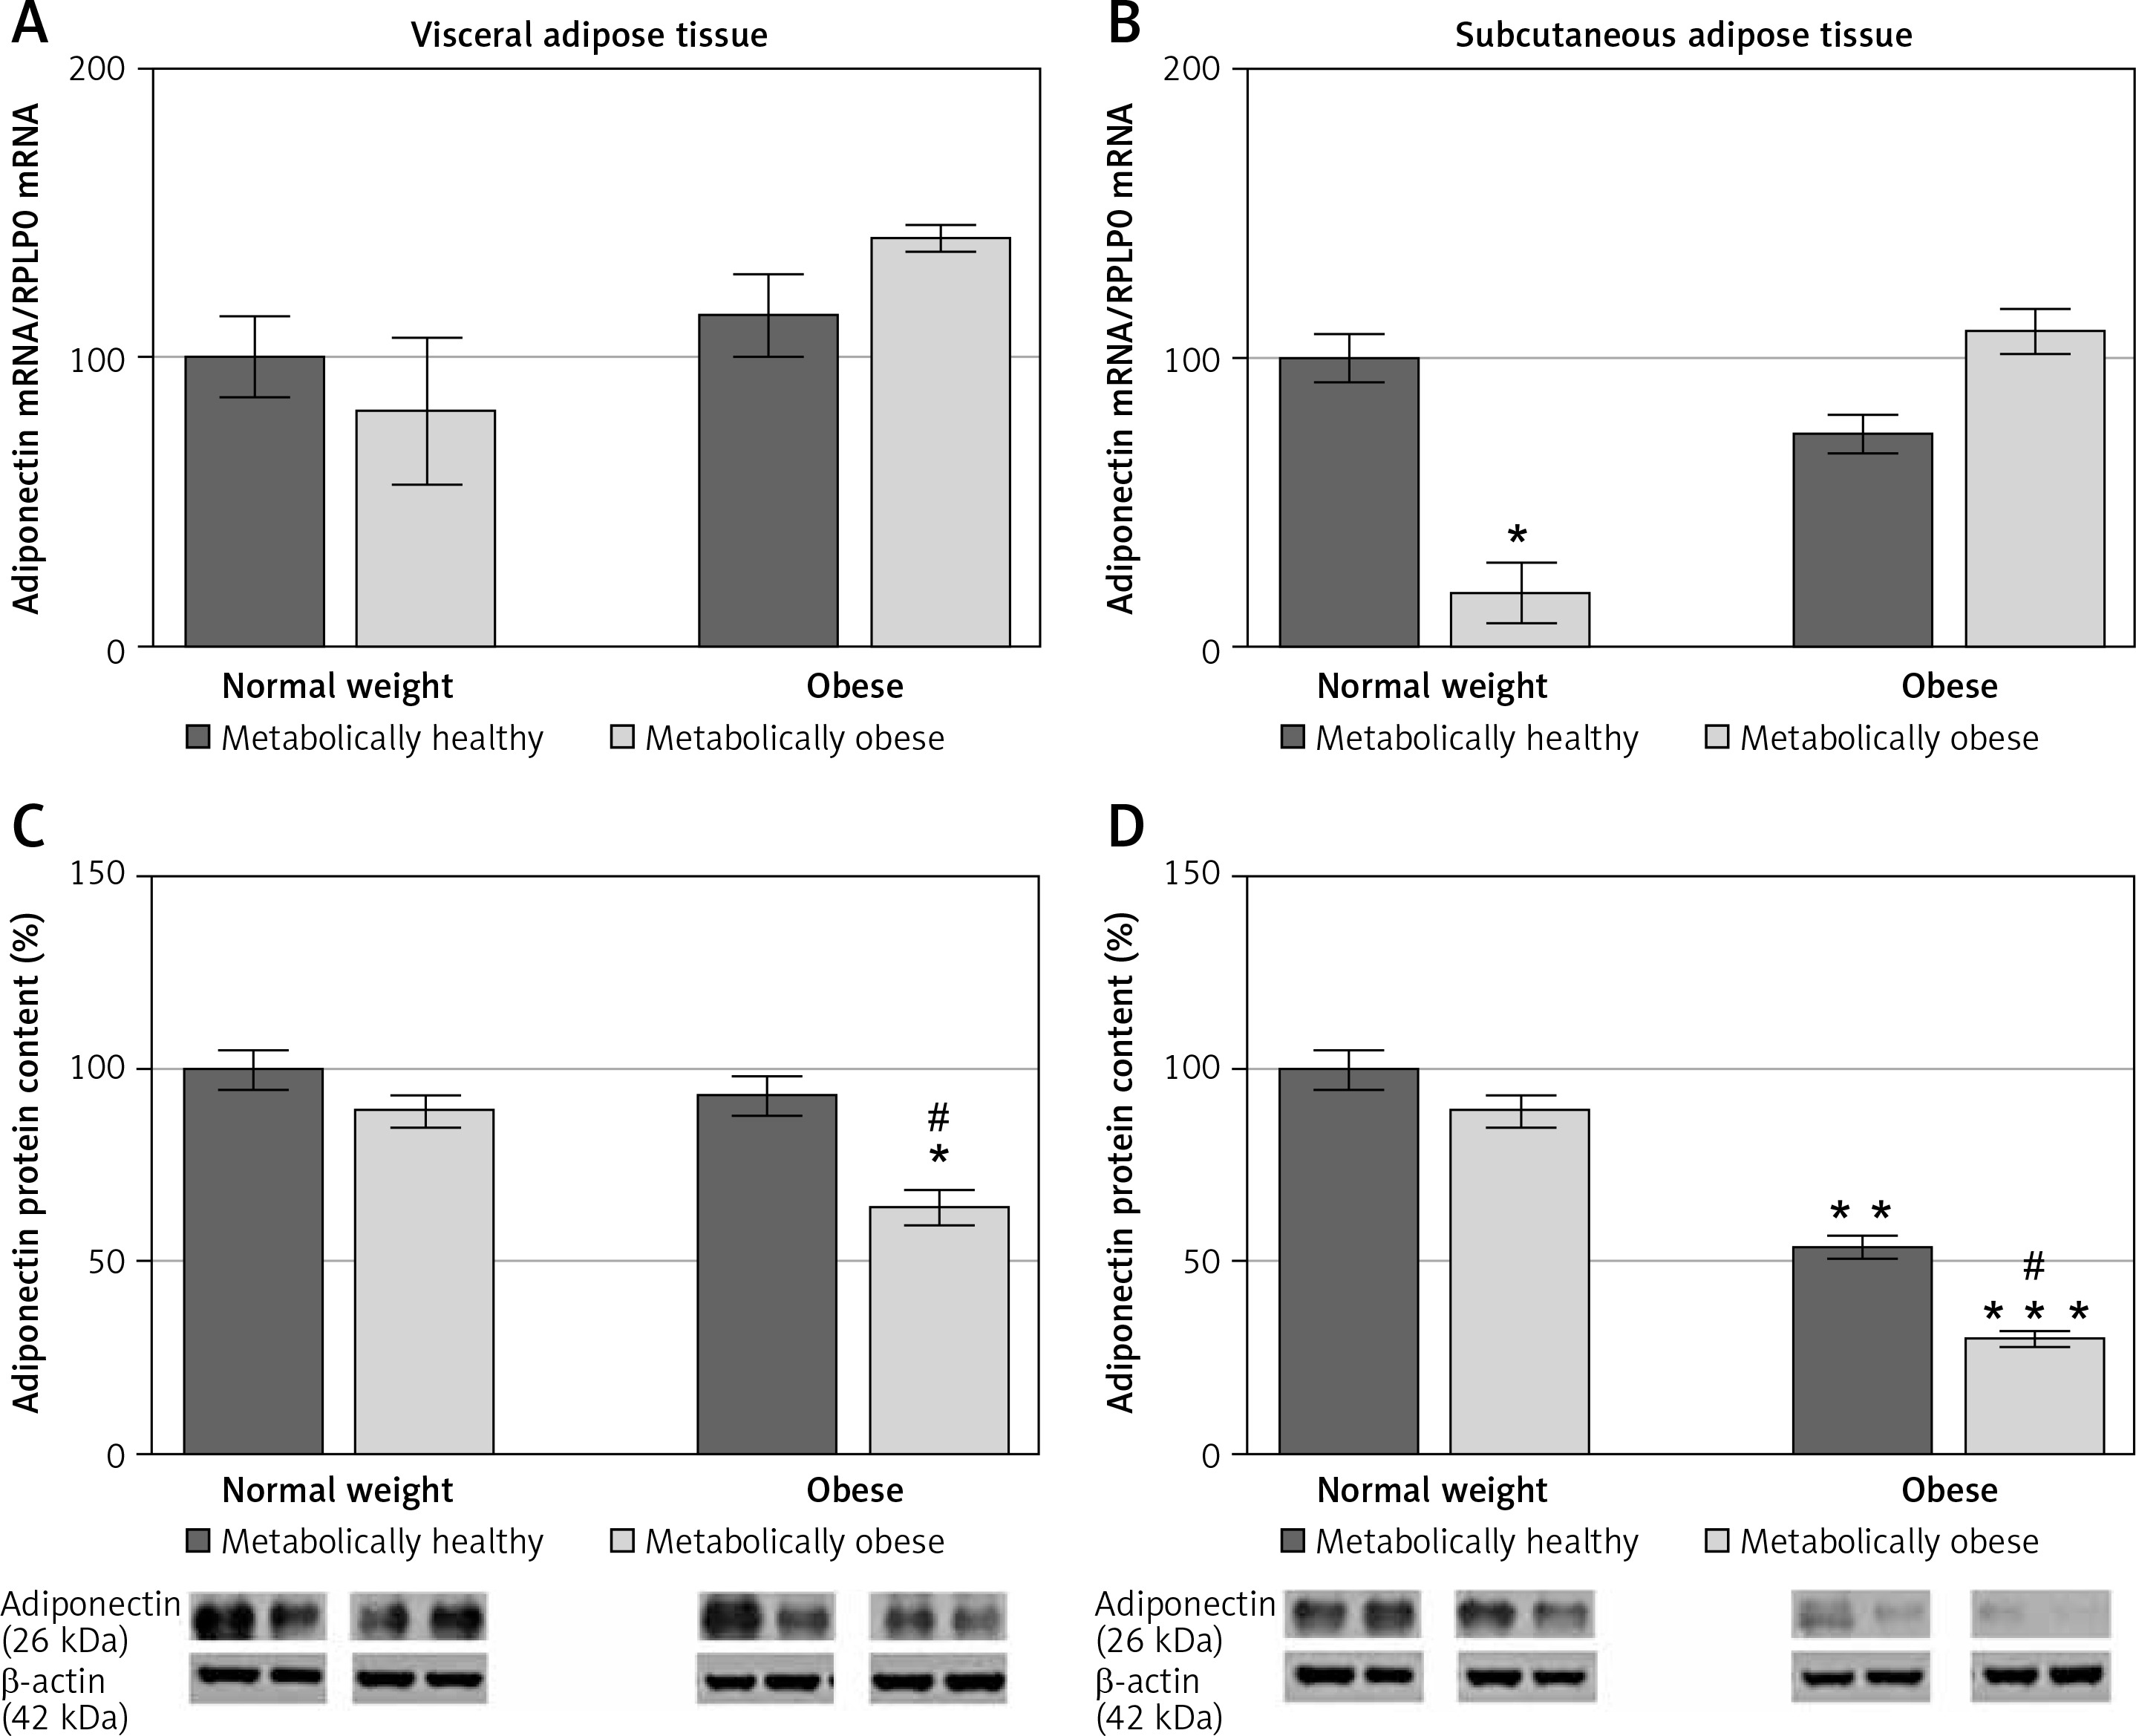
There was a significant main effect of BMI on adiponectin protein levels in VAT (p < < 0.001) and SAT (p < 0.01). There was no significant association of metabolic risk with gene expression of adiponectin in either of the adipose tissues, and there was a main effect of metabolic risk on decrease of protein expression of adiponectin in both VAT (p < 0.01) and SAT (p < 0.001). Compared to MHNW women, lower adiponectin gene expression levels were only observed in the SAT of MONW women (p < 0.01) (Figure 4 B). However, adiponectin protein content in the SAT of the MHO and “at risk” obese women was ~46% (p < 0.01) and ~70% (p < 0.001), respectively, lower compared to the MHNW controls (Figures 4 B, D). In addition, in the SAT of “at risk” obese women, the protein expression of adiponectin was lower compared to the MHO controls (p < 0.05) (Figure 4 D). Also, there was a significantly lower level of adiponectin protein in the VAT (Figure 4 C), but only in “at risk” obese women, compared to MHNW women (64 ±8 vs. 100 ±9; p < 0.05) and MHO women (64 ±8 vs. 93 ±9; p < 0.05). Therefore, lower protein levels of adiponectin in both abdominal adipose depots can discriminate higher metabolic risk among obese women.
Figure 4
mRNA and protein expression levels of adiponectin in the visceral (A, C) and subcutaneous adipose tissues (B, D) of metabolically healthy normal-weight, metabolically obese normal-weight, metabolically healthy obese, and metabolically obese (“at risk”) women. The protein content is expressed relative to that of a metabolically healthy normal-weight control, which was standardised to be 100%. The results of a representative example from three observations are shown. The data were quantified as described in the Material and methods section. The values represent the mean ± SEM
*Comparison with metabolically healthy normal-weight group, *p < 0.05, **p < 0.01, ***p < 0.001. #Comparison with corresponding metabolically healthy group, #p < 0.05.
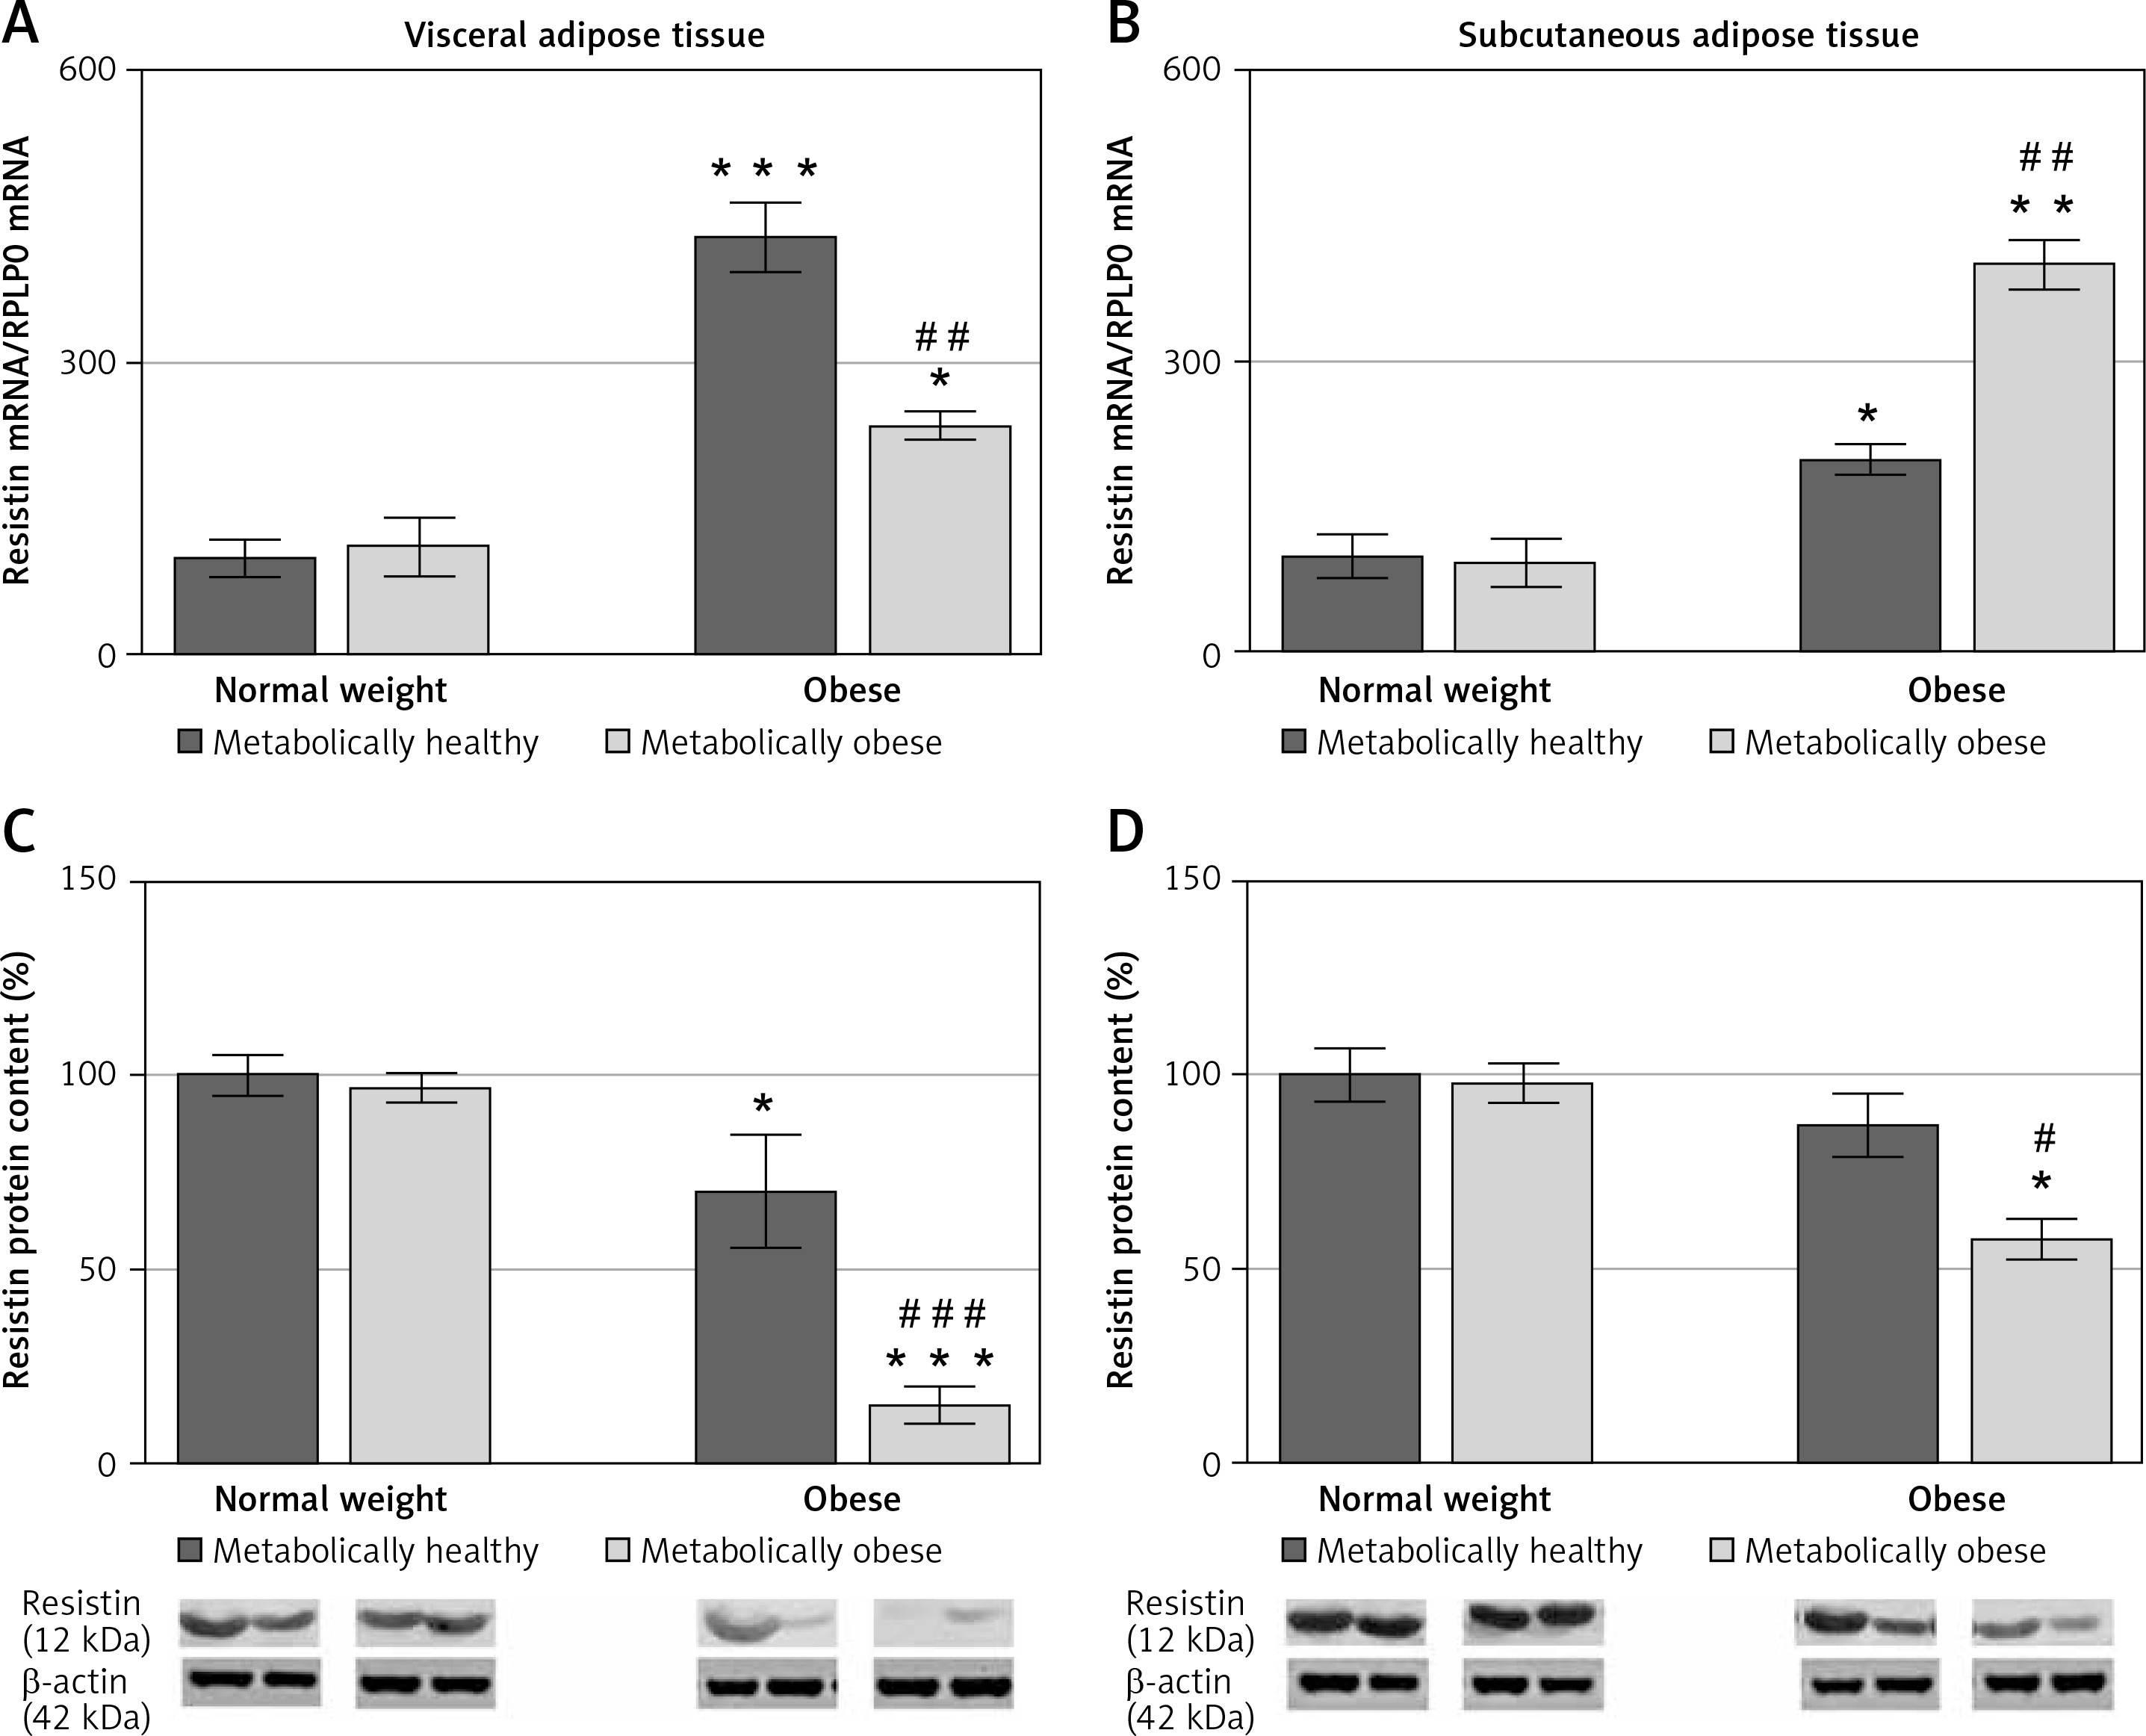
There was a significant interaction effect of BMI and metabolic risk on gene expression of resistin in SAT (p < 0.05) as well on gene and protein expression of resistin in VAT (p < 0.01 for gene and p < 0.001 for protein). Protein levels of resistin decrease with BMI in SAT irrespectively of metabolic risk (p < 0.001), while there was no main effect of metabolic risk. Compared to MHNW women, both obese groups of women had higher levels of resistin mRNA in VAT and SAT (Figures 5 A, B). However, lower resistin protein levels were detected in VAT of MHO women, compared to MHNW controls (p < 0.05) (Figures 5 C). Also, resistin protein expression was significantly lower in VAT and SAT of “at risk” obese women, compared to MHO controls (p < 0.001 and p < 0.05, respectively) (Figures 5 C, D). Therefore, resistin levels in abdominal VAT and SAT cannot discriminate higher metabolic risk among obese women.
Figure 5
mRNA and protein expression levels of resistin in the visceral (A, C) and subcutaneous adipose tissues (B, D) of metabolically healthy normal-weight, metabolically obese normal-weight, metabolically healthy obese, and metabolically obese (“at risk”) women. The protein content is expressed relative to that of a metabolically healthy normal-weight control, which was standardised to be 100%. The results of a representative example from three observations are shown. The data were quantified as described in the Materials and methods section. The values represent the mean ± SEM
*Comparison with metabolically healthy normal weight group, *p < 0.05, **p < 0.01, ***p < 0.001. #Comparison with corresponding metabolically healthy group, #p < 0.05, ##p < 0.01, ###p < 0.001.
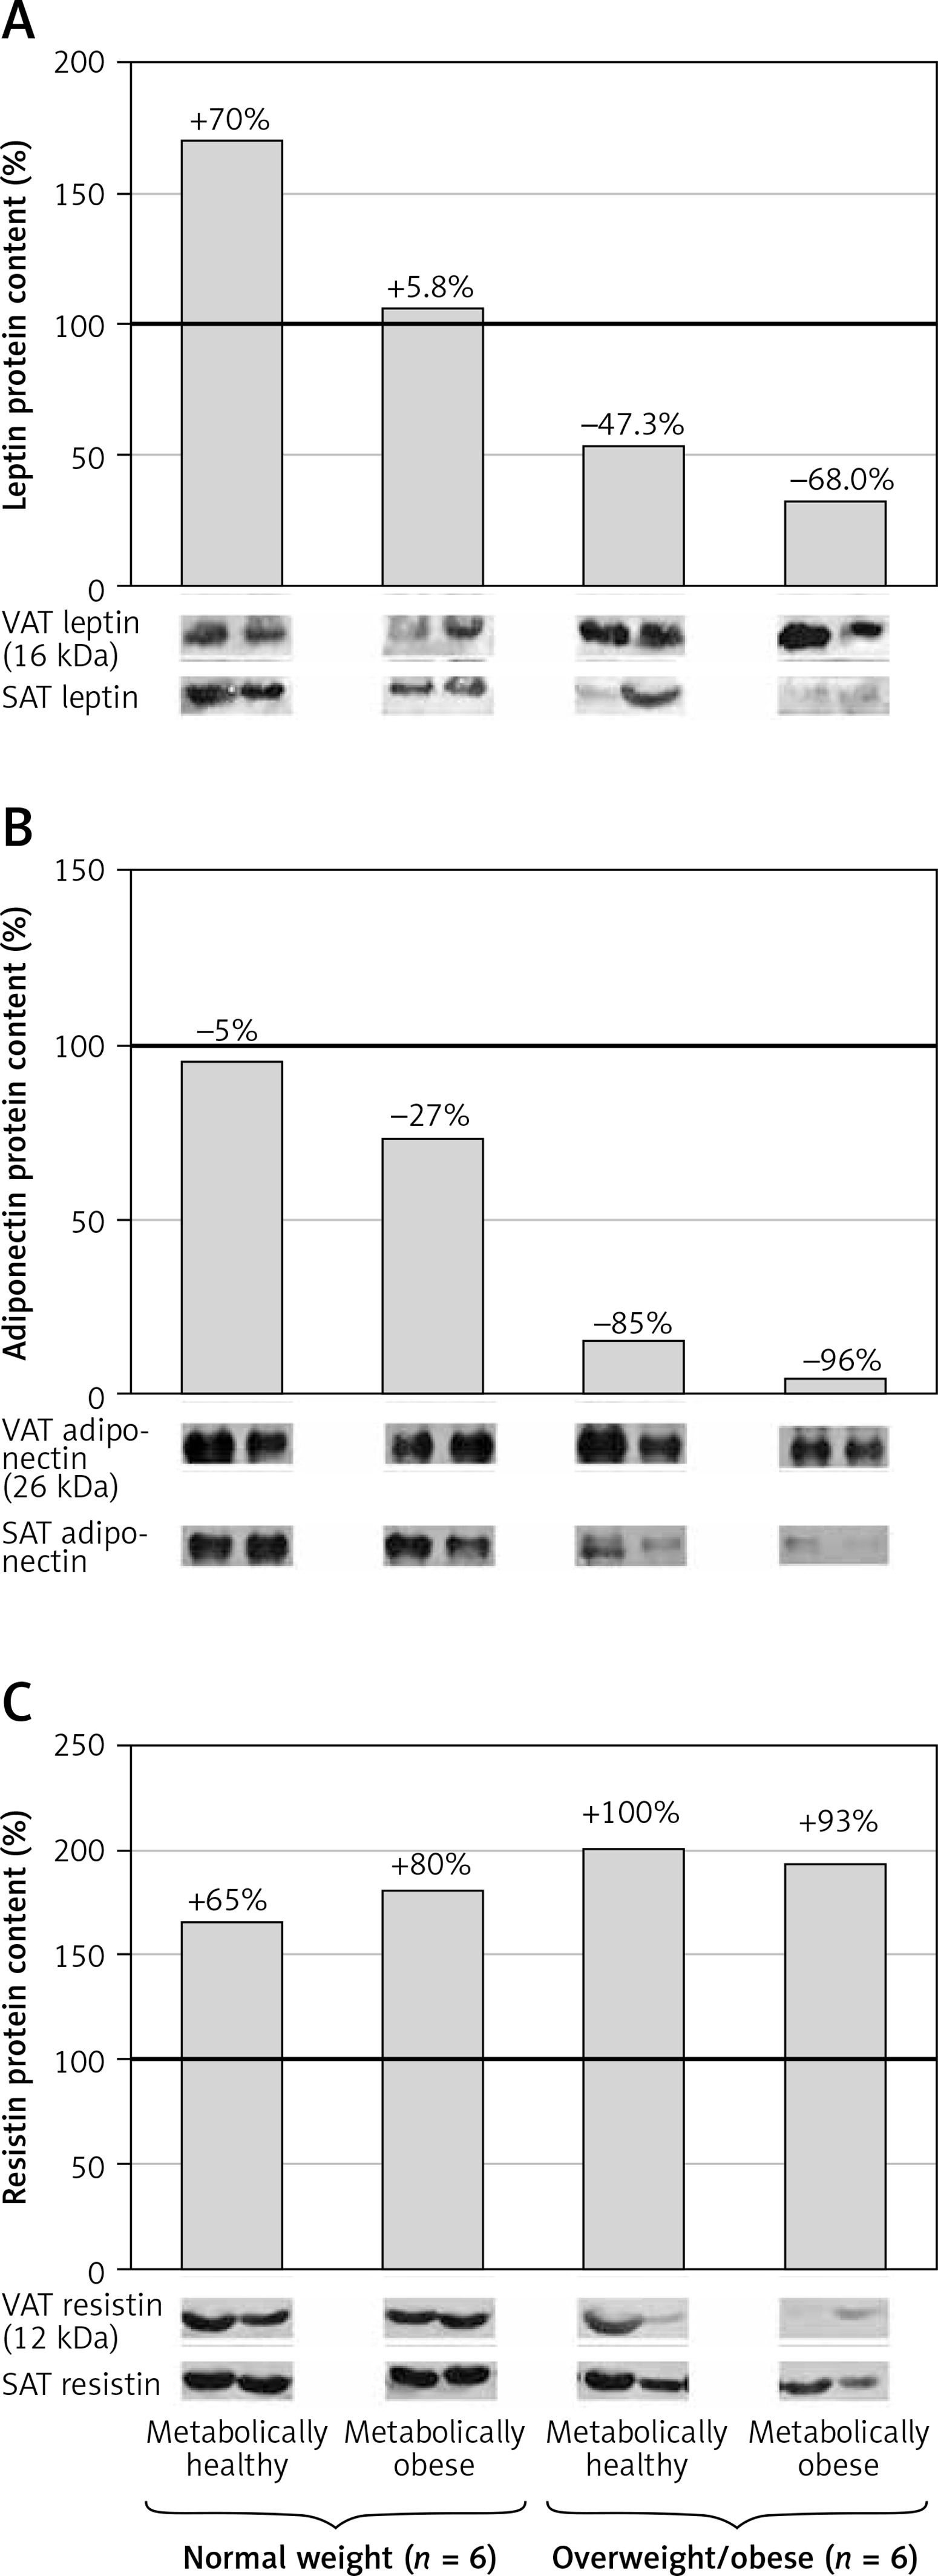
To further examine the adipose tissue adipokines’ synthesis in obese women, leptin, adiponectin and resistin protein expression levels were compared between the VAT and SAT in each group. Compared to VAT, protein expression of leptin in SAT was 70% higher (1.7-fold) in MHNW women, and 5.8% in MONW women (Figure 6 A). However, protein expression of leptin was 47.3% lower in SAT vs. VAT in MHO, i.e. for 68% in “at risk” obese women (Figure 6 A). Protein levels of adiponectin were similar in the SAT and VAT of MHNW women, and 27% lower in SAT vs. VAT of MONW women. In obese women, however, adiponectin levels in SAT were only 15%, i.e. 4% of the values in the VAT of the same, MHO, i.e. “at risk” obese women, respectively (Figure 6 B). In both normal-weight groups, MHNW and MONW, resistin levels were 65% and 80% higher, respectively, in the SAT compared to VAT. Similarly, but more pronounced, resistin levels were 100% and 93% higher in the SAT compared to VAT in MHO and “at risk” obese groups of women, respectively (Figure 6 C).
Figure 6
Relative protein expression levels of leptin (A), adiponectin (B) and resistin (C) in paired biopsies of subcutaneous and visceral adipose tissues in metabolically healthy normal-weight, metabolically obese normal-weight, metabolically healthy obese, and metabolically obese (“at risk”) women. The protein content is expressed relative to that of a visceral adipose tissue, which was standardised to be 100%. The results of a representative example from three observations are shown. The data were quantified as described in the Material and methods section
Discussion
The importance of leptin and other adipokines (adiponectin and resistin of particular) in regulating whole-body and adipose tissue insulin sensitivity and metabolism is well recognized. However, the circulating levels of these adipokines are steadily “masked” by the peripheral SAT amount, especially in women, and do not reflect/explain the higher metabolic risk. This article defines the endocrine status of the visceral and subcutaneous abdominal adipose tissue depots in premenopausal women and clarifies their role in the abdominal obesity and metabolic syndrome development. Low protein expression of adiponectin in both abdominal SAT and VAT and inappropriately low leptin in abdominal SAT appear to be important characteristics of obesity-related metabolic syndrome in premenopausal women. Intriguingly, similar adipokine dysregulation is primarily seen in the SAT of women with “intermediary” types of obesity (obese, still metabolically healthy, and in normal-weight, metabolically obese women), suggesting that endocrine dysfunction of abdominal SAT may be an early risk sign of abdominal obesity and metabolic syndrome development. The observed differences in leptin, adiponectin, and resistin gene/protein expression in abdominal VAT and SAT and their relationship with obesity and metabolic risk merit discussion.
Expectedly, the results of this study clearly confirm a relationship between circulatory leptin levels and leptin gene/protein expression levels in the VAT with BMI (overall obesity), regardless of the metabolic risk. However, it seems that the leptin expression in the abdominal SAT does not correspond to the degree of adipose tissue expansion. Instead, the results of this study showed decreased levels of leptin in the SAT of metabolically obese women, independently of their weight status. These results suggest that low leptin expression in abdominal SAT may be an early sign of metabolic syndrome.
Plasma leptin level increases with increasing adipocyte lipid reserves and total body fat mass [31–33], and it is determined predominantly by peripheral SAT because of its higher inherent expression and secretion rate compared to VAT [23, 34–37], especially in obese women in whom the bulk (> 70%) of total body adipose tissue is localized subcutaneously [38]. Thus, results showing lower levels of leptin mRNA/protein in the abdominal SAT of obese women characterized by hyperleptinaemia seem surprising. Although some studies have shown higher leptin gene expression in the abdominal SAT of obese subjects [35–37], a lack of association or even a negative correlation between levels of leptin expression in abdominal SAT and circulating levels in obesity has also been reported [39–43]. The different characteristics of the populations, the diverse methodologies used to determine leptin gene expression, and the lack of the levels of protein expression in these studies could underline these discrepancies. Even more surprising was the fact that by comparing SAT and VAT we detected higher expression of leptin in SAT of normal-weight women, while in obese ones the VAT contribution was prominent. However, given the total fat tissue amount increase in obese women, especially the SAT, as well as the high secretion rate from this depot, it may be hypothesized that the total level of leptin released from SAT in obesity is lower, but not low enough to affect the higher plasma leptin level characterizing obese women. In accordance with this hypothesis is the fact that we did not detect a correlation between serum leptin and BMI when only the obese group of women was taken into account, although a strong positive correlation was evident when the whole group of patients (both obese and non-obese) was considered. In accordance with our results, no positive correlation between leptin concentration in blood and BMI in non-diabetic obese patients was observed [44]. Lower leptin synthesis per unit of abdominal SAT mass in the obese state may be related to such a discrepancy between the plasma leptin and BMI in various obese women, and finally may clarify the discrepancy between the lower leptin expression levels in the abdominal SAT sample and higher serum leptin in obesity.
It should also be stressed that we screened one time point in women with a long-lasting excess of body mass (women enrolled in the study had a stable body weight for at least 6 months). Accordingly, the results of leptin expression in the abdominal SAT of women with long-lasting obesity might differ from women with recent onset or dynamic obesity. As an energy sensor, leptin expression increases in parallel with lipid reserves and adipocyte size during weight gain [31, 45]; thus the leptin expression levels in the VAT of obese women may reflect a normal tissue reaction, while lower expression levels of leptin observed in the abdominal SAT of obese women could be regarded as a late, (dys)functional response of abdominal SAT adipocytes.
The low leptin levels in the abdominal SAT of MONW women support our assumption that leptin tissue deficiency indicates abdominal SAT lipid storage dysfunction and higher metabolic risk. Leptin deficiency in SAT plays a major role in metabolic complications of lipoatrophy, as only SAT transplantation from wild-type donors (with normal leptin expression) can restore lipid and glucose homeostasis in insulin-resistant lipoatrophic mice [45]. By analogy, normal-weight women may tend to have abdominal obesity and metabolic risk due to the lower autocrine/paracrine effects of leptin in this depot. In fact, low leptin levels in the abdominal SAT of both metabolically obese groups of women (MONW and “at risk” obese) in this study may reflect functional or “acquired lipoatrophy”, abdominal obesity, and metabolic risk.
Low plasma level of adiponectin is an endocrine hallmark of obesity and insulin resistance and it is affected by abdominal obesity [21]. Hypoadiponectinaemia in subjects with abdominal obesity inversely correlates with both VAT and SAT areas and may be associated with down-regulated adiponectin synthesis and secretion in both expanded abdominal adipose tissues [46–48]. The comprehensive approach of this study, however, allowed us to recognize which adipose tissues may contribute to circulatory adiponectin reductions in obesity, as well as the role of each adipose tissue in the emergence of metabolic syndrome. Compared to the normal-weight controls, a reduction in adiponectin protein expression was detected in the abdominal SAT of MHO, and an additional decrease was observed in this depot in “at risk” obese women. In contrast, lower adiponectin protein expression in the VAT was only observed in “at risk” obese women.
Data presented here showing depot-different expression levels of adiponectin reproduce the depot-specific secretory rate from VAT/SAT adipocytes and explant cultures in some [49–51] but not all studies [52]. Consistently however, these studies showed that greater capacity for adiponectin secretion by SAT is lost in obesity and/or in the presence of type II diabetes. Therefore, low adiponectin production by the abdominal SAT, in addition to lower leptin expression in this depot, could be an important early sign/factor of high metabolic risk in obesity.
It is a fact that gene expression levels do not always correlate with protein content and furthermore with secretion of adiponectin [52, 53]. The discordance observed here in adiponectin mRNA and protein levels in VAT and SAT indicates that different mechanisms of regulation (protein synthesis, stability or secretion rate) operate in various groups of women. Precisely, in the SAT of MONW women higher protein synthesis/stability and/or lower release may underlie the unchanged protein level in this depot. Also, lower protein levels (without significant mRNA decrease) observed in VAT and SAT of obese groups of women indicate that the adiponectin amount in the obese state is possibly affected by lower protein synthesis/stability, since that secretion of adiponectin is generally lower in obesity [51–54]. Although some studies with VAT and SAT explants from obese subjects showed that reductions of adiponectin in media do not mirror reductions in adiponectin tissue content, suggesting that changes distal to protein synthesis account for adiponectin secretion [54], the results of our study indicate that translational changes also may play a role. Thus, the secretion rate of adiponectin from adipose tissue explants obtained from women in similar study settings would be useful in the explanation of gene-protein-secretion correlations.
The expression of leptin and adiponectin is regulated by various hormones and factors, extrinsic or from the adipose tissue itself [45, 55–57]. However, the major common long-term regulator of their synthesis is insulin. Decreases in insulin and/or insulin-mediated glucose disposal are associated with decreases in adiponectin and leptin expression [58–62]. On the other hand, these adipokines exert strong autocrine/paracrine effects on adipose tissue lipolysis, fatty acid oxidation, lipid accumulation, and insulin responsiveness, as well as the proliferation and differentiation of preadipocytes [63–65]. Thus, changes of leptin and adiponectin expression could be linked to insulin-induced changes of adipocyte metabolism and reflect/mediate the lipid storage dysfunction and expansion of VAT and SAT in obesity. Notably, lower leptin and adiponectin levels in the abdominal SAT in both obese groups of women, compared to normal-weight controls, may be associated with the insulin refractory response of SAT and its overwhelmed lipogenic capacity, as indicated by the lower levels of lipogenic gene expression in the abdominal SAT of subjects with stable body weight obesity [66], and the higher percentage of hypertrophic, less insulin-sensitive adipocytes (100–150 µm) that we previously observed in the abdominal SAT of obese women [27]. Since the expression levels of the adipokines examined in this study reflect or even mediate lipid storage function and adipose tissue expansion, our results agree with the lipid overflow hypothesis of abdominal obesity and metabolic syndrome development. According to this hypothesis, the lipid storage dysfunction of VAT is common for metabolic syndrome, but secondary to the overwhelmed lipid storage capacity of SAT [11, 67]. Accordingly, low levels of leptin and adiponectin in abdominal SAT may be early endocrine signs/factors of visceral fat accretion and emerging metabolic syndrome.
Similar to adiponectin, significant differences in resistin expression were seen in both adipose depots only in obese women, suggesting its role in obesity development. However, discordant gene and protein levels of expression, as well as the results showing decreased protein expression in both adipose tissues of “at risk” obese women compared to weight-matched control, still complicate the vague understanding of resistin in human insulin resistance development. While resistin is linked to insulin resistance in rats [68], its physiological role in the development of insulin resistance in humans is still unclear. In fact, there are discrepancies in studies regarding the levels of serum resistin in diabetes and obesity, as some studies have shown a positive correlation between serum resistin levels with insulin resistance [69, 70] and some have not [71]. Contrary to its role in rats, resistin in humans may even have positive effects in adipose tissue, particularly in obesity, through the promotion of proliferation of preadipocytes ready for differentiation and the storage of lipids [72]. Also, by increasing lipolysis [73], resistin in humans can convert lipid-overfull adipocytes into heathier, insulin-responsive cells with a lower lipid content. In addition, by the acceleration of so-called “meaningless” cycles in adipocytes (e.g. esterification-reesterification of fatty acids), resistin can increase the metabolic rate and energy expenditure [74]. Overall, resistin may contribute to energy dissipation in obesity and have a positive effect on the level of body fat, and consequently the whole organism. Accordingly, the protein expression of resistin, lower in the VAT and SAT of “at risk” obese women, compared to their MHO counterparts, may contribute to a reduced capacity of abdominal adipose tissues in lipid storage and metabolic homeostasis in obesity.
Finally, since resistin as well as the other adipokines is a secretory protein, its tissue levels may be regulated by its rate of secretion [19]. Thus, a high secretion rate of resistin from adipose tissue in obesity could reduce the tissue protein amount, which in turn may stimulate its gene expression. Thus, measurement of resistin secretion directly and/or in tissue explants would be helpful for understanding the results obtained here and other studies considering resistin synthesis regulation, and resistin’s role in human insulin resistance.
Many recent studies on the pathogenesis of metabolic syndrome correlate plasma/serum levels of leptin, adiponectin, or resistin with specific biomarkers for metabolic risk in subjects with the visceral (or subcutaneous) type of adiposity. The circulatory levels of adipokines are important because they explain the overall obesity link with metabolic syndrome, through its systemic effects. However, circulatory levels of adipokines are secondary to the altered secretory function of adipose tissues, and still unable to explain the higher metabolic risk of subjects with the abdominal type of obesity. The main advantage of this study over other (cross-sectional) studies is its clarification of the pathogenesis of abdominal obesity and metabolic syndrome at its basis – abdominal adipose tissues. Expression levels of adipokines investigated here reflect and possibly mediate the storage (dys)function of the abdominal adipose tissue depots in obesity, and may reveal the endocrine mechanisms of the lipid overflow-ectopic fat hypothesis of abdominal obesity and metabolic syndrome development. Finally, this study may have great translational potential, as we could within normal-weight and obese subjects (even with the same degree of leptinaemia) according to leptin and adiponectin expression profile impairments of VAT and SAT, recognize early those who are more susceptible to metabolic syndrome. However, a larger, population-based study is needed for the final confirmation of these results and its translational and clinical significance.