Introduction
Frailty is a complex syndrome characterized by diminished physiological function, escalating with age and reducing life expectancy at any age [1–4]. Recognized as a critical aging concern, it increases susceptibility to stressors and the likelihood of adverse events such as falls, disabilities, and hospital admissions [5]. Prevalent among intensive care unit patients, frailty has emerged as a significant global health issue. Despite its recognition, standardized assessment criteria for frailty remain elusive. Commonly, frailty is delineated through two methodologies: the frailty phenotype [3] and the frailty index model. Alternative approaches include the simplified frailty phenotype and the prognostic frailty score. The frailty phenotype evaluation encompasses five domains: weight loss, weakness, exhaustion, slowness, and reduced physical activity [3, 6]. In contrast, the frailty index varies in terms of components and counts across studies, and is more effective in differentiating frailty levels [7–9].
Asthma, the most prevalent chronic respiratory disease, is characterized by narrowed, edematous airways obstructed with excessive mucus. It is estimated that over 300 million people globally suffer from asthma; its prevalence continues to rise worldwide, and it is responsible for nearly 250,000 deaths annually [10, 11]. The prevalence of frailty was observed to be the highest in the presence of severe airflow limitation, dyspnea, and frequent exacerbations [12]. However, the causal relationship between asthma and frailty has been minimally explored at the population level. There remains uncertainty about whether a bidirectional causal association truly exists, or the observed co-existence is due to confounding factors or common risk elements such as inflammation. Establishing a definitive causal association between asthma and frailty is critical, as it would enhance our understanding of the disease etiology, guide the creation of effective interventions, and ultimately help to alleviate the growing burden of these conditions.
Establishing a causal association between asthma and frailty is challenging due to potential reverse causation and confounding factors. Mendelian randomization (MR) is an emerging approach in epidemiology that uses genetic variants, such as single nucleotide polymorphisms (SNPs), as instrumental variables (IVs) to evaluate the causal effects of exposures on outcomes [13]. Due to the unique advantages of IVs, MR analysis is not influenced by conventional confounders [14] and aligns with the established causal sequence [15]. Genome-wide association studies (GWAS) have provided robust and reliable IVs for MR research. Therefore, MR analysis can be employed to examine the potential causal association between genetic predisposition to asthma and frailty. Based on this understanding, we conducted a bidirectional MR analysis using recent large-scale GWAS data to investigate the causal relationship between asthma and frailty.
Material and methods
Overall study design
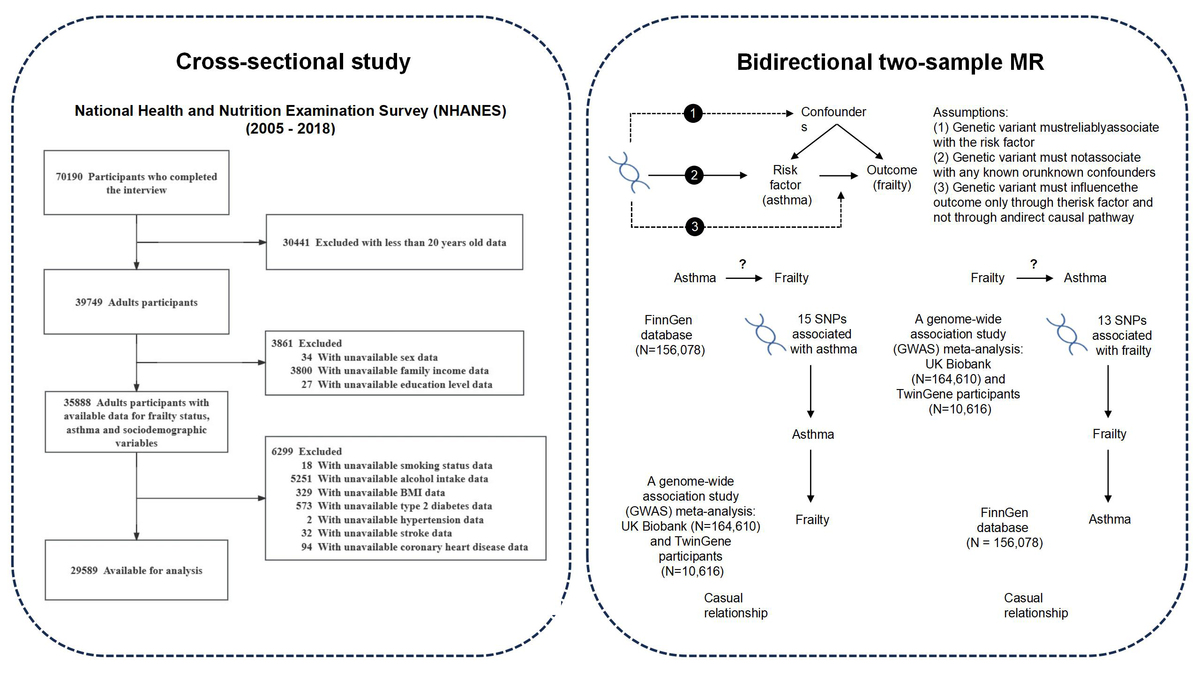
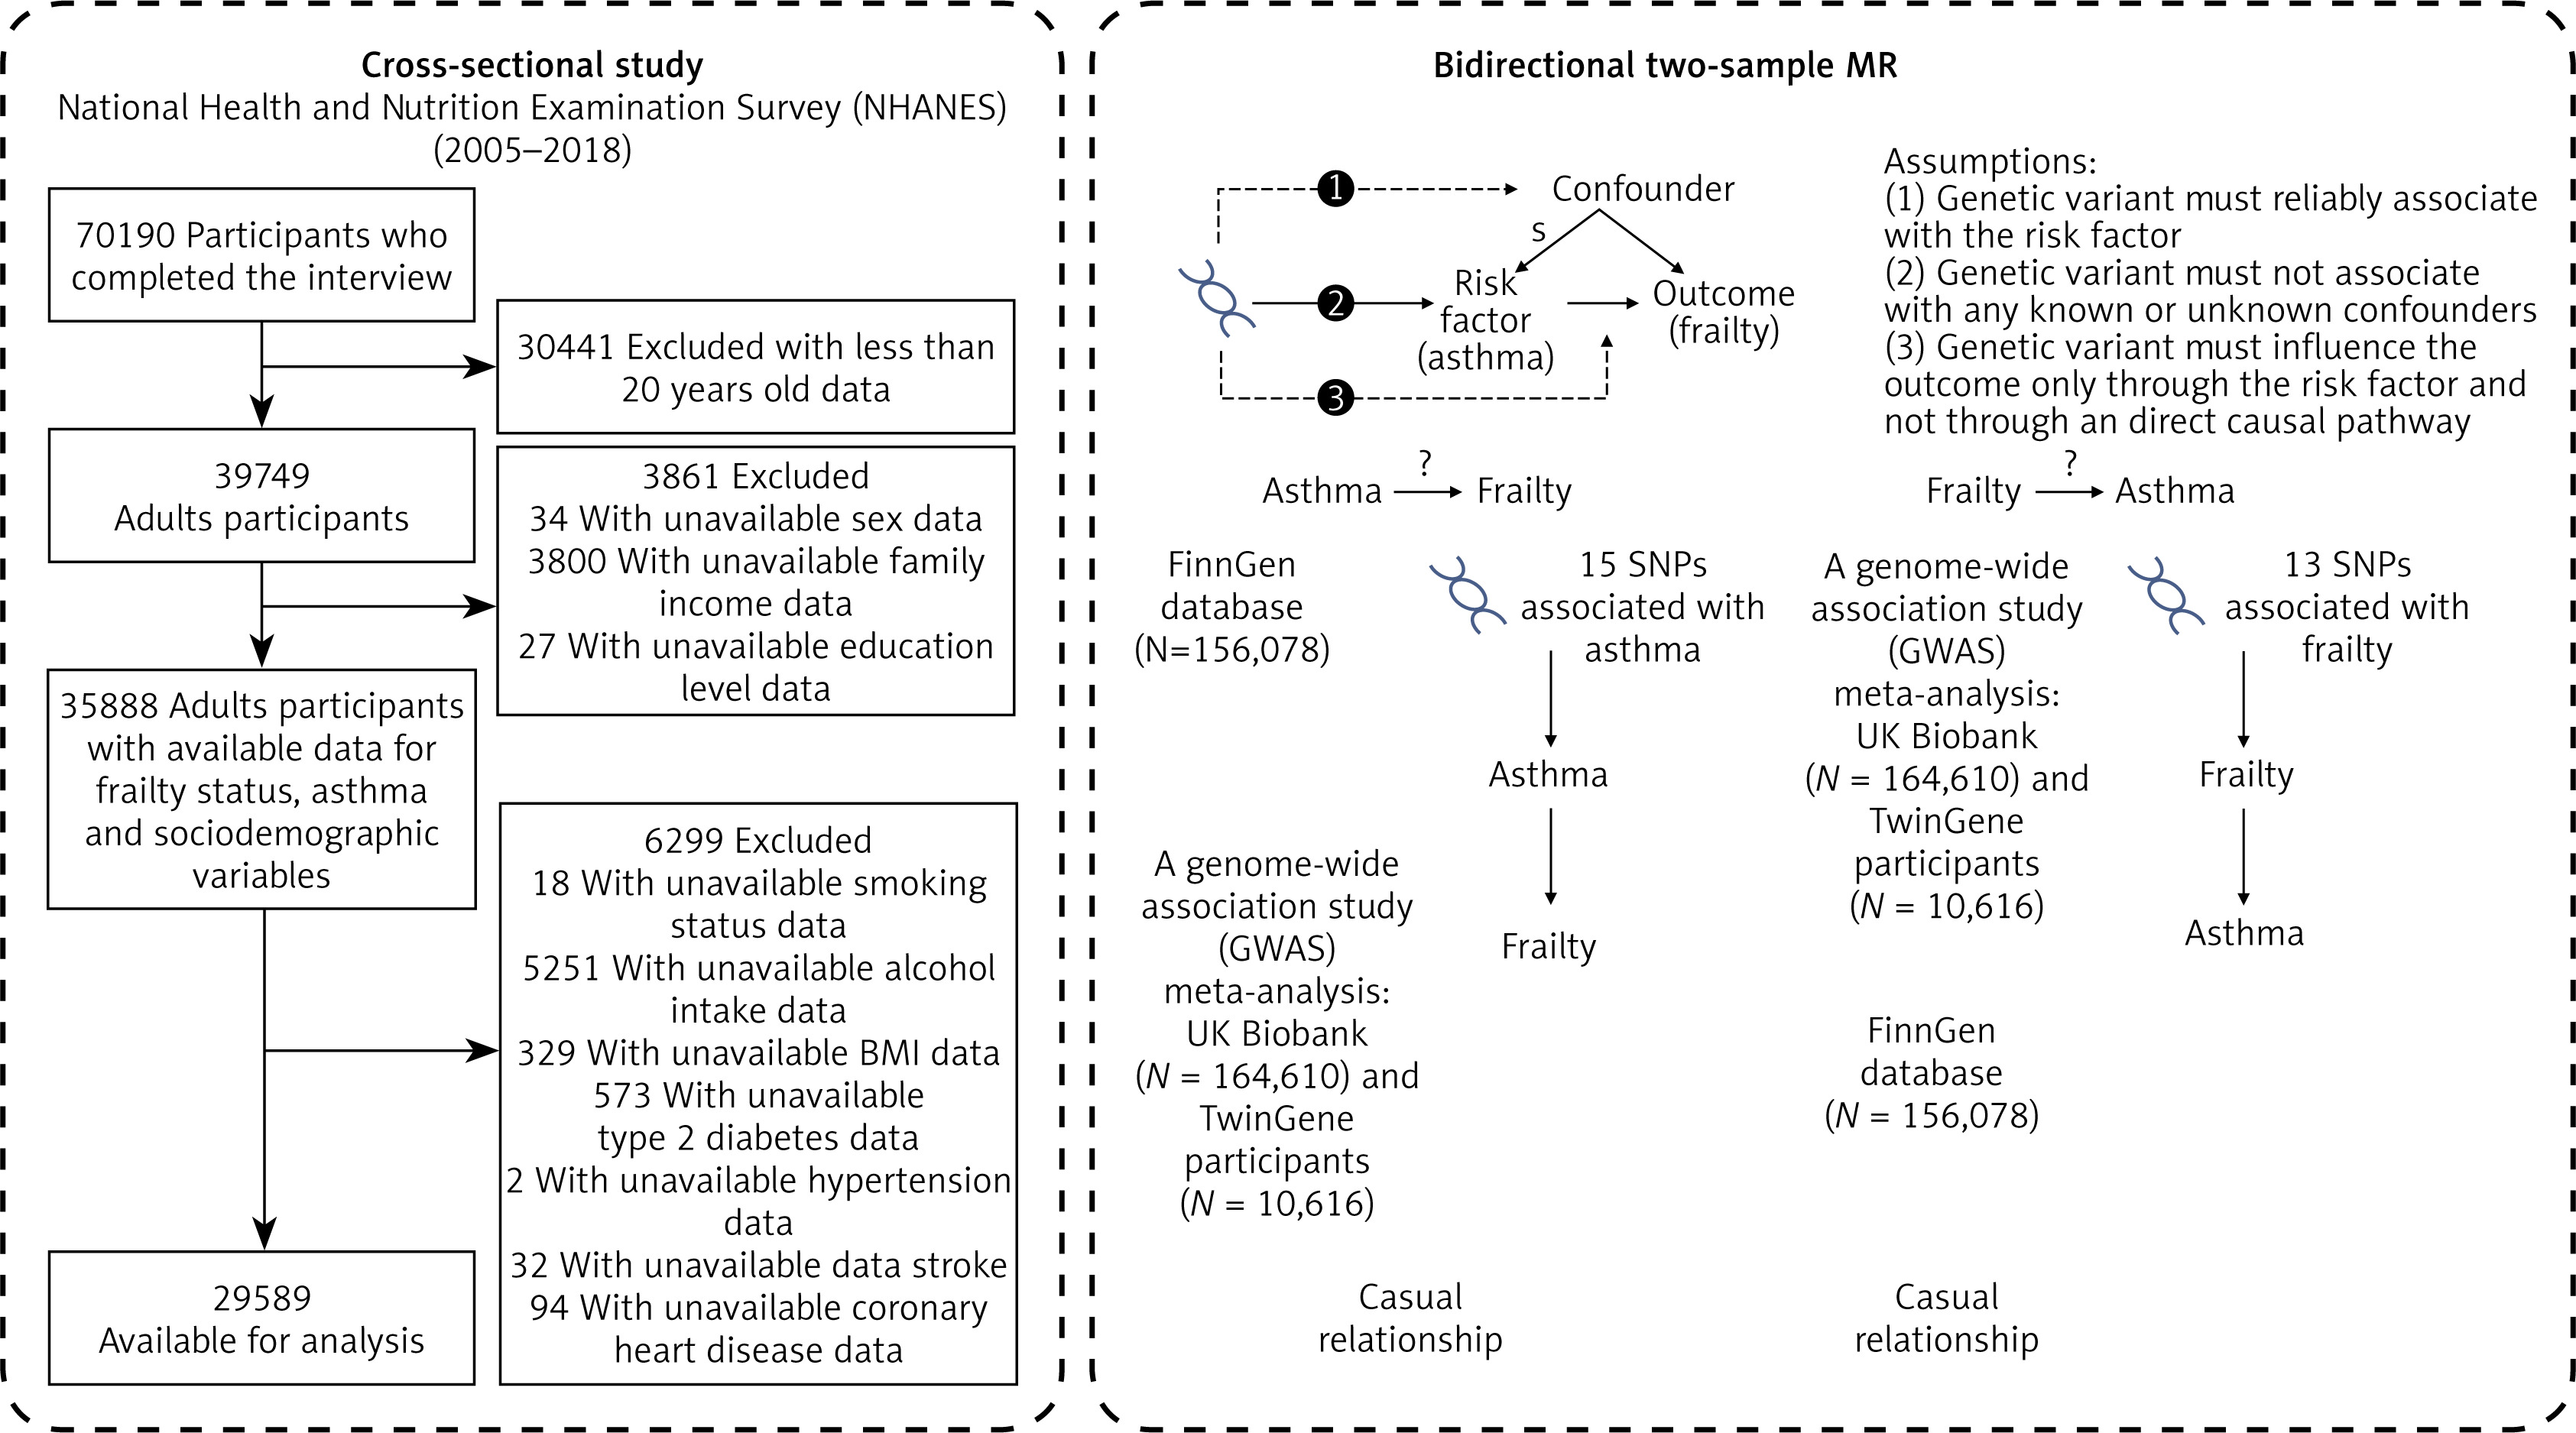
This study was divided into two sections. Initially, we analyzed data from NHANES to examine the association between asthma and frailty, controlling for potential confounders. Propensity score matching (PSM) was used to validate the robustness of our results. Subsequently, bidirectional MR was used to assess the genetic basis of asthma’s impact on frailty, drawing on data from GWAS. A schematic representation of the study is shown in Figure 1.
Cross-sectional analysis
NHANES is an ongoing series of cross-sectional surveys conducted on noninstitutionalized civilians in the United States. The surveys use multistage probability sampling to select a sample that is representative of the nation and evaluate their health and nutritional status. The survey comprises household interviews, physical examinations, and laboratory tests. It was carried out by the National Center for Health Statistics, which is part of the Centers for Disease Control and Prevention (CDC). Details about the sampling method and data collection can be found in a previous publication [16]. The study obtained approval from the Ethics Review Board of the National Center for Health Statistics, and all participants provided written informed consent.
The study used data from the 2005–2018 NHANES a comprehensive health survey by CDC and the National Center for Health Statistics (NCHS). This survey assesses the health and nutritional status of a representative sample of the noninstitutionalized population in the United States. The survey protocol was approved by NCHS Research Ethics Review Board, and all participants gave their written informed consent. In this study, individuals aged 20 years or older with data on asthma and frailty were selected. In the NHANES dataset, key variables such as education level, marital status, and other adult-specific measures are collected only for participants aged 20 or older. To ensure robust analysis, we set an age cutoff of 20 years, consistent with standard NHANES research practices for data consistency and relevance. After excluding those with incomplete information on covariates, the final sample comprised 29,589 participants.
Diagnosis of frailty
Frailty was assessed using a frailty index based on the methodology and principles outlined by Searle et al. [7]. This index incorporates 49 variables across various systems, such as cognitive function, dependency levels, depressive indicators, comorbid conditions, overall health status, hospital usage, physical capability, body measurements, and laboratory test results [8]. These variables represent health deficits that typically escalate with age yet avoid saturating too early. Each deficit, whether ordinal, continuous, or binary, was assigned a value ranging from 0 (absence of deficit) to 1 (maximum presence), reflecting its intensity. The computation of the frailty index involved summing the scores for these deficits and dividing by 49, the total count of deficits. A benchmark frailty index score of 0.21 was determined to identify individuals deemed ‘frail,’ who are at heightened risk of hospital-related complications [17, 18]. Details of the 49 variables and their assigned values are provided in Supplementary Table SI. In this study, a 49-item frailty index derived from the NHANES dataset’s clinical, laboratory, and survey data was used [8, 9].
Definitions of asthma
A diagnosis of asthma was confirmed under any of these conditions: (1) a medical professional diagnosed the participant with asthma; (2) the participant was on medication for asthma; (3) individuals younger than 40 years, without a history of smoking, chronic bronchitis, or emphysema, were taking medications such as selective phosphodiesterase-4 inhibitors, mast cell stabilizers, leukotriene modifiers, or inhaled corticosteroids [19].
Other covariates
Various potential covariates were examined, as identified in the literature [20], including demographic and health-related factors such as age, sex, race/ethnicity, marital status, family income, education level, smoking and alcohol consumption habits, body mass index (BMI), and the presence of certain health conditions such as type 2 diabetes, hypertension, stroke and coronary heart disease. Race/ethnicity was divided into four categories: non-Hispanic White, non-Hispanic Black, Mexican American, and other races. Marital status was categorized as married, living with a partner, or living alone. Family income was classified into low, medium, and high groups based on the poverty income ratio (PIR) as per a US government report, with thresholds set at PIR ≤ 1.3 for low, 1.3 to 3.5 for medium, and > 3.5 for high. Education was segmented into three levels: less than 9 years, 9 to 12 years, and more than 12 years. BMI calculation followed a standardized method using weight and height measurements. Smoking status was defined based on lifetime cigarette consumption, categorizing individuals as never smokers (fewer than 100 cigarettes), current smokers, or former smokers (quit after 100 or more cigarettes). Alcohol consumption was classified as never (less than 12 drinks in a lifetime), former (12 or more drinks in 1 year but none in the last year), or current (12 or more drinks in the last year). For previous diseases such as hypertension, stroke, and coronary heart disease, classification relied on self-reported medical diagnoses. Type 2 diabetes identification adhered to the American Diabetes Association criteria, considering factors such as fasting plasma glucose, glycated hemoglobin, random blood glucose levels, results from an oral glucose tolerance test, physician-diagnosed diabetes, and medication usage for glucose control.
MR analysis – data source
The present study, deploying bidirectional two-sample MR within a European cohort, aimed to delineate the potential causal relationship between asthma and frailty. Genetic variants significantly associated with asthma were derived from FinnGen database (https://gwas.mrcieu.ac.uk/datasets/finn-b-J10_ASTHMA/, accessed on 2024-01-12) comprising 156,078 individuals, including 20,629 cases and 135,449 controls, with a total of 16,380,176 SNPs. Genetic variants significantly associated with the frailty index (p < 5 × 10⁻⁸) were obtained from a genome-wide association study (GWAS) meta-analysis of 164,610 UK Biobank and 10,616 TwinGene participants (https://gwas.mrcieu.ac.uk/datasets/ebi-a-GCST90020053, accessed on 2024-01-12). All participants were of European ancestry. Reporting and analytic processes follow the STROBE-MR guidelines [21].
Statistical analysis
Descriptive analysis was conducted on the participants. Categorical data are presented as frequencies and percentages, and continuous data are presented as means and standard deviations (SD) for normally distributed variables, or medians and interquartile ranges (IQR) for non-normally distributed variables. Different statistical tests were applied based on data characteristics: the χ2 test was used for categorical variables, the independent samples t-test was used for normally distributed continuous variables, and the Mann-Whitney U test or Kruskal-Wallis test was used for non-normally distributed continuous variables. Specifically, the Mann-Whitney U test was applied for comparisons between two independent groups, while the Kruskal-Wallis test was used for comparisons involving more than two groups. These non-parametric tests were chosen because the data did not meet the assumptions required for parametric tests (e.g., normality and homogeneity of variance). This approach supported our comprehensive comparative analysis. Moreover, a multivariable logistic regression model was used to derive propensity scores for asthma and non-asthma participants, aiding in a PSM analysis. Through 1 : 1 nearest neighbor matching with a 0.2 caliper width, baseline characteristic biases were minimized. The PSM efficacy was evaluated via the standardized mean difference, aiming to reduce it, with values under 0.1 indicating effective cohort matching. This study included various methods, such as inverse probability of treatment weighting (IPTW), standardized mortality ratio weighting (SMRW), pairwise algorithmic (PA), and overlap weighting (OW), to establish a weighted cohort [22], refining the assessment of the independent effect of asthma on frailty. The E-value was calculated to assess the influence of unmeasured confounders on the conclusion, thus strengthening the validity [23].
In the bidirectional MR analysis, IVs (SNPs) were selected based on stringent criteria: genome-wide significance (p < 5 × 10⁻⁸) and linkage disequilibrium (r2 < 0.001 within a 10,000 kb window). Weak instruments were excluded if the F-statistic was below 10. The MR-PRESSO test was used before the analysis to identify and remove outliers, enhancing the causal estimate’s reliability. Data harmonization procedures also involved removing palindromic SNPs to maintain consistency between outcome and exposure datasets. After filtering, the remaining SNPs underwent rigorous analysis, with the inverse variance weighting (IVW) method as the primary analysis tool. The stability of results was cross-validated through MR-Egger, weighted median, simple mode, and weighted mode approaches. Heterogeneity was assessed via Cochran’s Q test, and the MR-Egger intercept test was used to evaluate horizontal pleiotropy. Further scrutiny for potential reverse causality was performed through reverse MR analysis. Additionally, scatter plots were created to illustrate the relationships between SNP–exposure and SNP–outcome associations. To assess the potential impact of individual variants on the estimates, a leave-one-out analysis was conducted by sequentially excluding each SNP and then applying the IVW method to the remaining SNPs. Furthermore, the study included a funnel plot analysis to detect directional pleiotropy, analogous to evaluating publication bias in meta-analyses. All statistical analyses were performed using R software (version 4.3.2) with the “TwoSampleMR” package and Free Statistics (version 1.9, http://www.clinicalscientists.cn/freestatistics/). P < 0.05 was considered statistically significant.
Results
Cross-sectional analysis
Participants
This study used NHANES data from 2005 to 2018, initially involving 70,190 participants. Among these, 39,749 adults aged 20 and above completed the interview and Mobile Examination Center (MEC) screening process. Following the initial screening, data on frailty status and asthma were complete for all participants, but 3,861 participants were excluded due to incomplete sociodemographic data, specifically 34 participants for missing sex data, 3,800 for missing family income data, and 27 for missing education level data. Additionally, 6,299 participants were excluded based on missing covariate information. This included 18 participants for missing smoking status data, 5,251 for missing alcohol intake data, 329 for missing BMI data, 573 for missing type 2 diabetes data, 2 for missing hypertension data, 32 for missing stroke data, and 94 for missing coronary heart disease data. Ultimately, 29,589 participants were included in the final analysis. The detailed selection and exclusion process is illustrated in the flow chart presented in Figure 1.
Baseline characteristics
In the 29,589 participants, 4,297 (14.5%) had an asthma diagnosis. Through PSM, we aligned 4,293 patient pairs, ensuring a balanced distribution of covariates across both groups. The baseline variables of unmatched and PSM groups were uniformly comparable, as shown in Table I and Supplementary Table SII. Asthmatic participants tended to be younger and predominantly male, with a higher representation of non-Hispanic White and Black individuals. Compared to non-asthmatic participants, asthmatic participants often had lower household incomes, were more likely to be in a marital or cohabiting relationship, and possessed higher educational levels. Lifestyle analysis showed that asthmatics were more likely to smoke, but less inclined to consume alcohol, and they generally exhibited elevated BMI. Furthermore, the prevalence of severe conditions such as type 2 diabetes, hypertension, stroke, and coronary heart disease was higher in asthmatics.
Table I
Baseline characteristics of participants
Asthma is an independent predictor of frailty
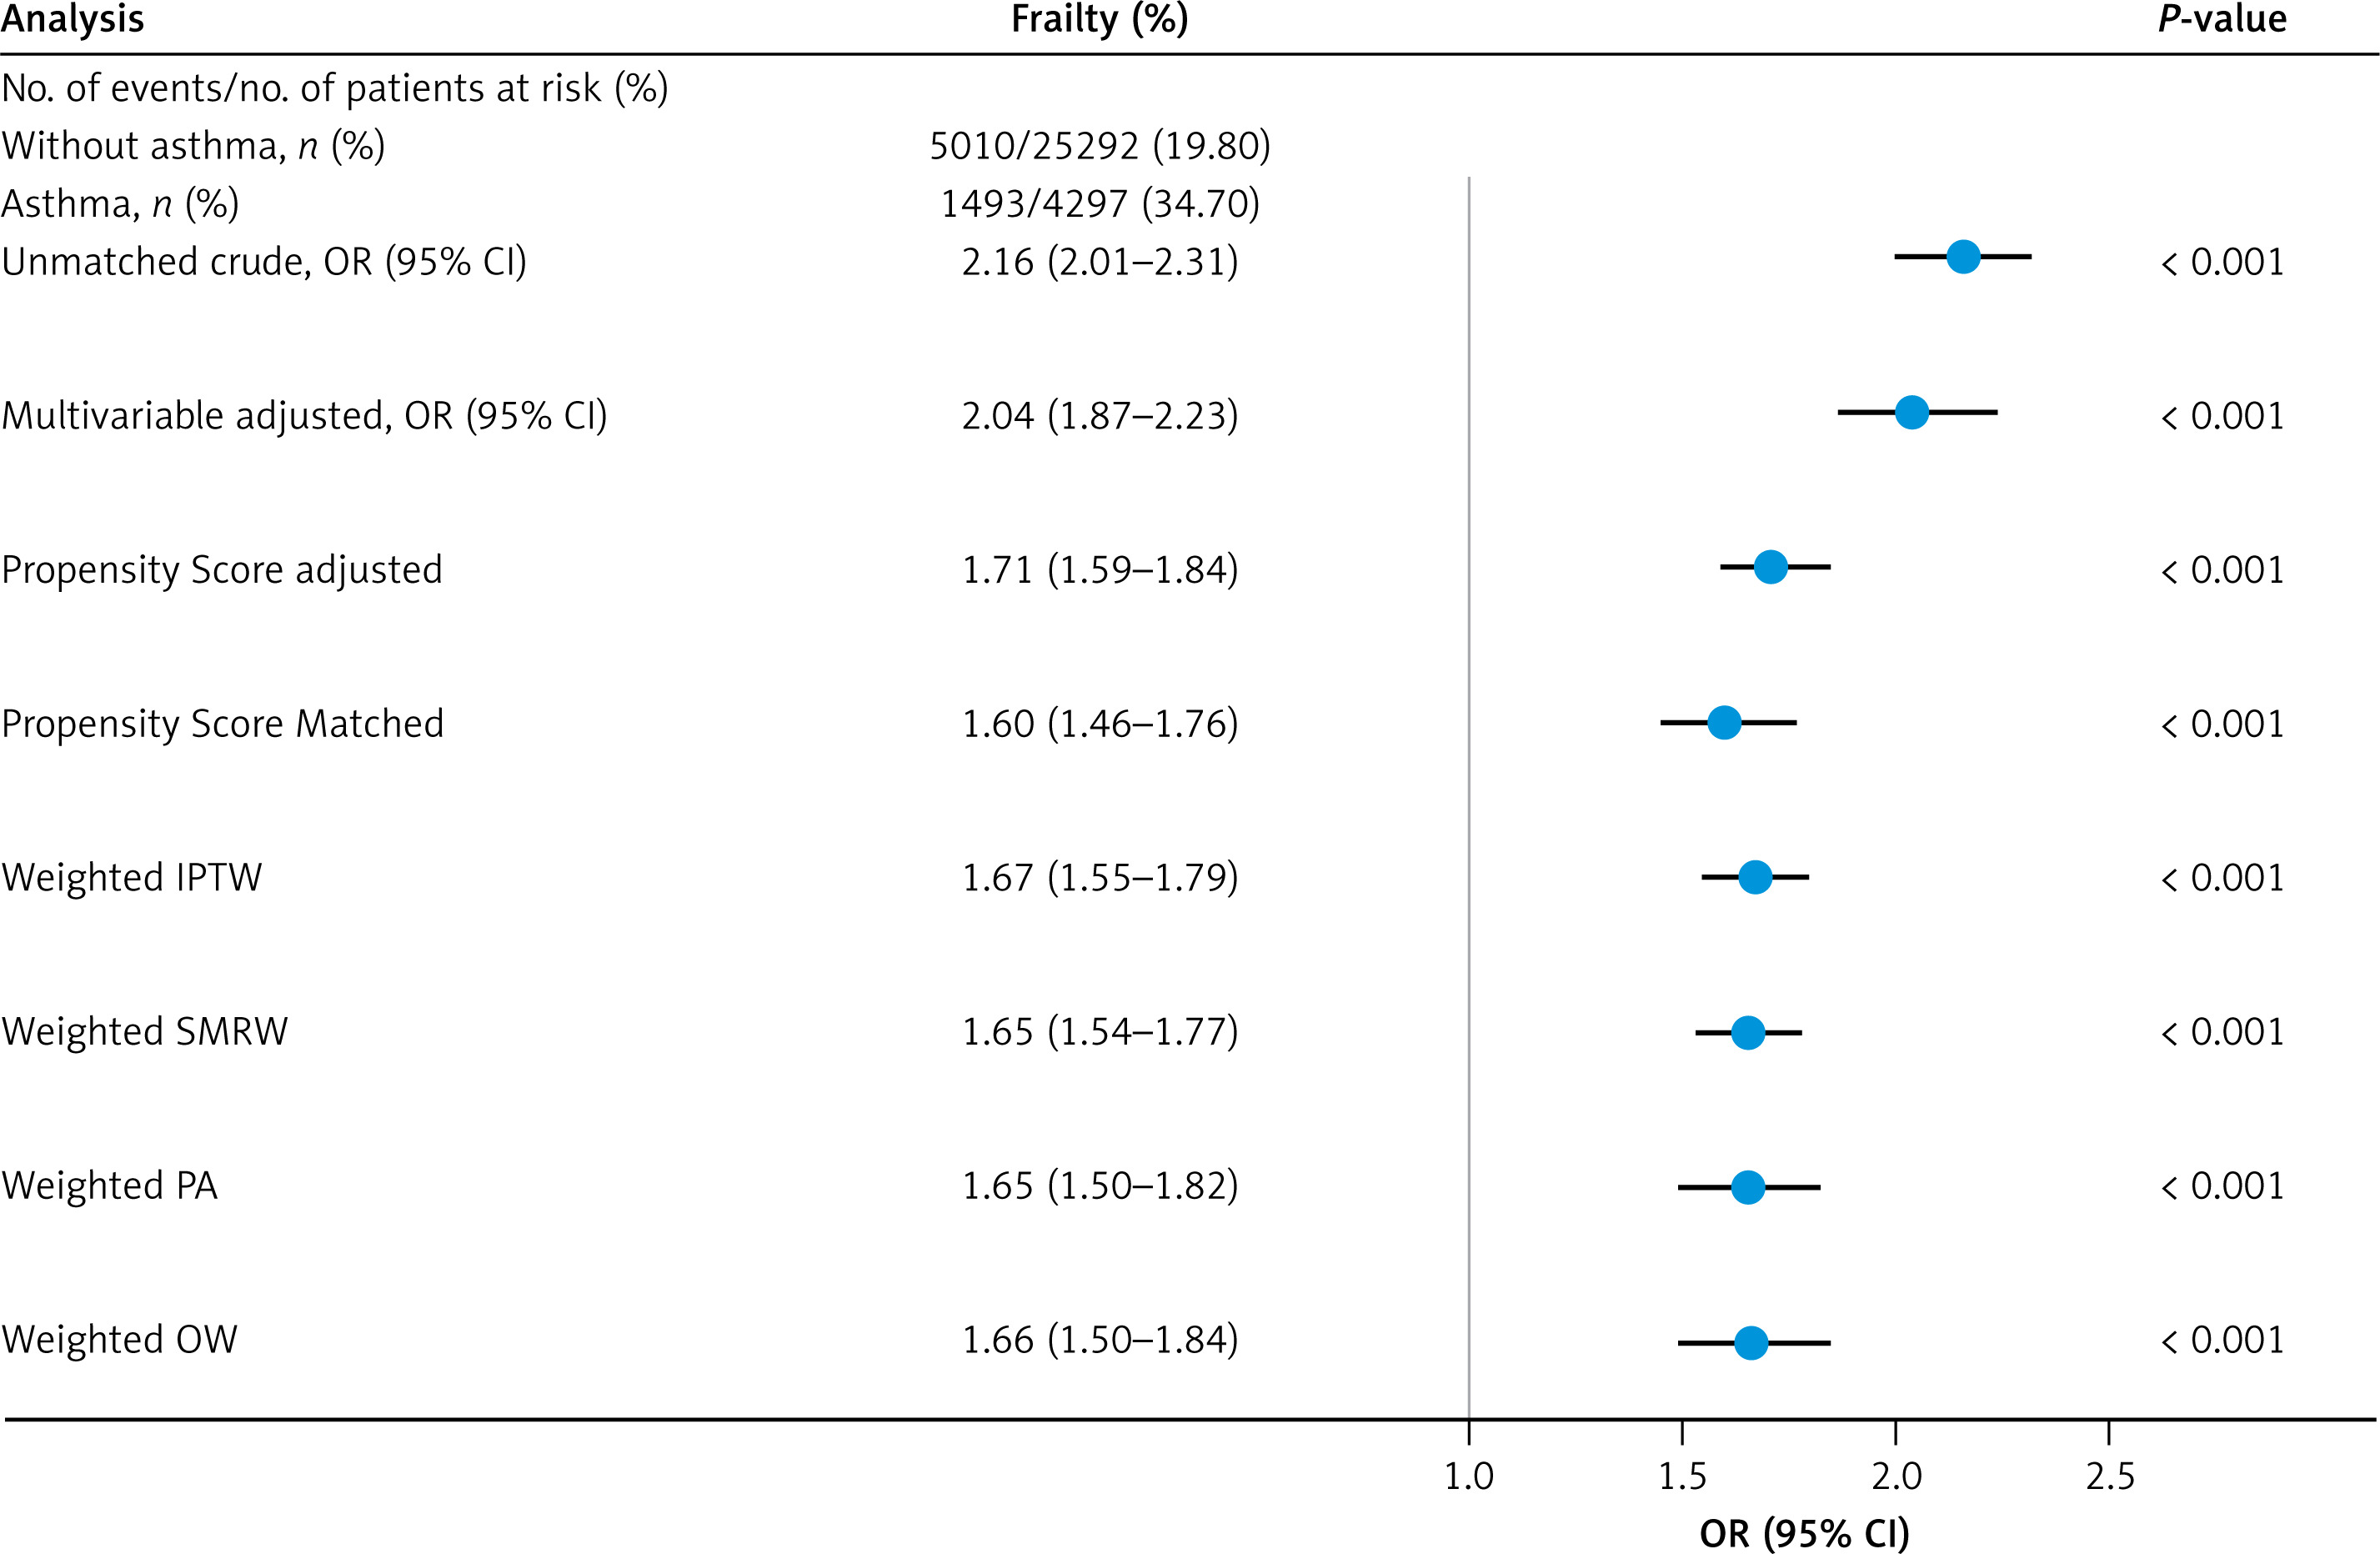
The overall frailty incidence was 22.0% (6,503/29,589), with 34.7% (1,493/4,297) in asthmatics and 19.8% (5,010/25,292) in non-asthmatic participants. The PSM analysis revealed a significant association between asthma and frailty. The crude OR was 2.16 (95% CI: 2.01–2.31), indicating a strong positive association before adjustments. After adjusting for multiple variables, the OR was 2.04 (95% CI: 1.87–2.23), still a significant association. When adjusted for propensity scores, the OR was 1.71 (95% CI: 1.59–1.84), and PSM yielded an OR of 1.60 (95% CI: 1.46–1.76), showing more conservative estimates. Weighted analyses using IPTW and SMRW provided OR of 1.67 (95% CI: 1.55–1.79) and 1.65 (95% CI: 1.54–1.77), respectively, both indicating significant associations. Similarly, PA and OW produced OR of 1.65 (95% CI: 1.50–1.82) and 1.66 (95% CI: 1.50–1.84), respectively, maintaining significant associations. These results suggest that asthma is a significant independent predictor of frailty, with the association strength slightly varying across different methodological approaches (Figure 2). For this analysis, the E-value ranged between 1.71 and 1.84.
Figure 2
Forest plot of frailty incidence among asthma patients. This forest plot illustrates the ORs comparing the incidence of frailty between asthma patients and non-asthma controls across multiple analytical models. Each line represents a different model, including crude unmatched, multivariable-adjusted, propensity score-adjusted, and various weighted models such as IPTW, SMRW, PA, and OW. The plot provides a comprehensive overview of the effect sizes with 95% CIs, assessing the robustness of the association between asthma and frailty
IPTW – inverse probability of treatment weighting, SMRW – standardized mortality ratio weighting, PA – pairwise algorithmic, OW – overlap weighting.
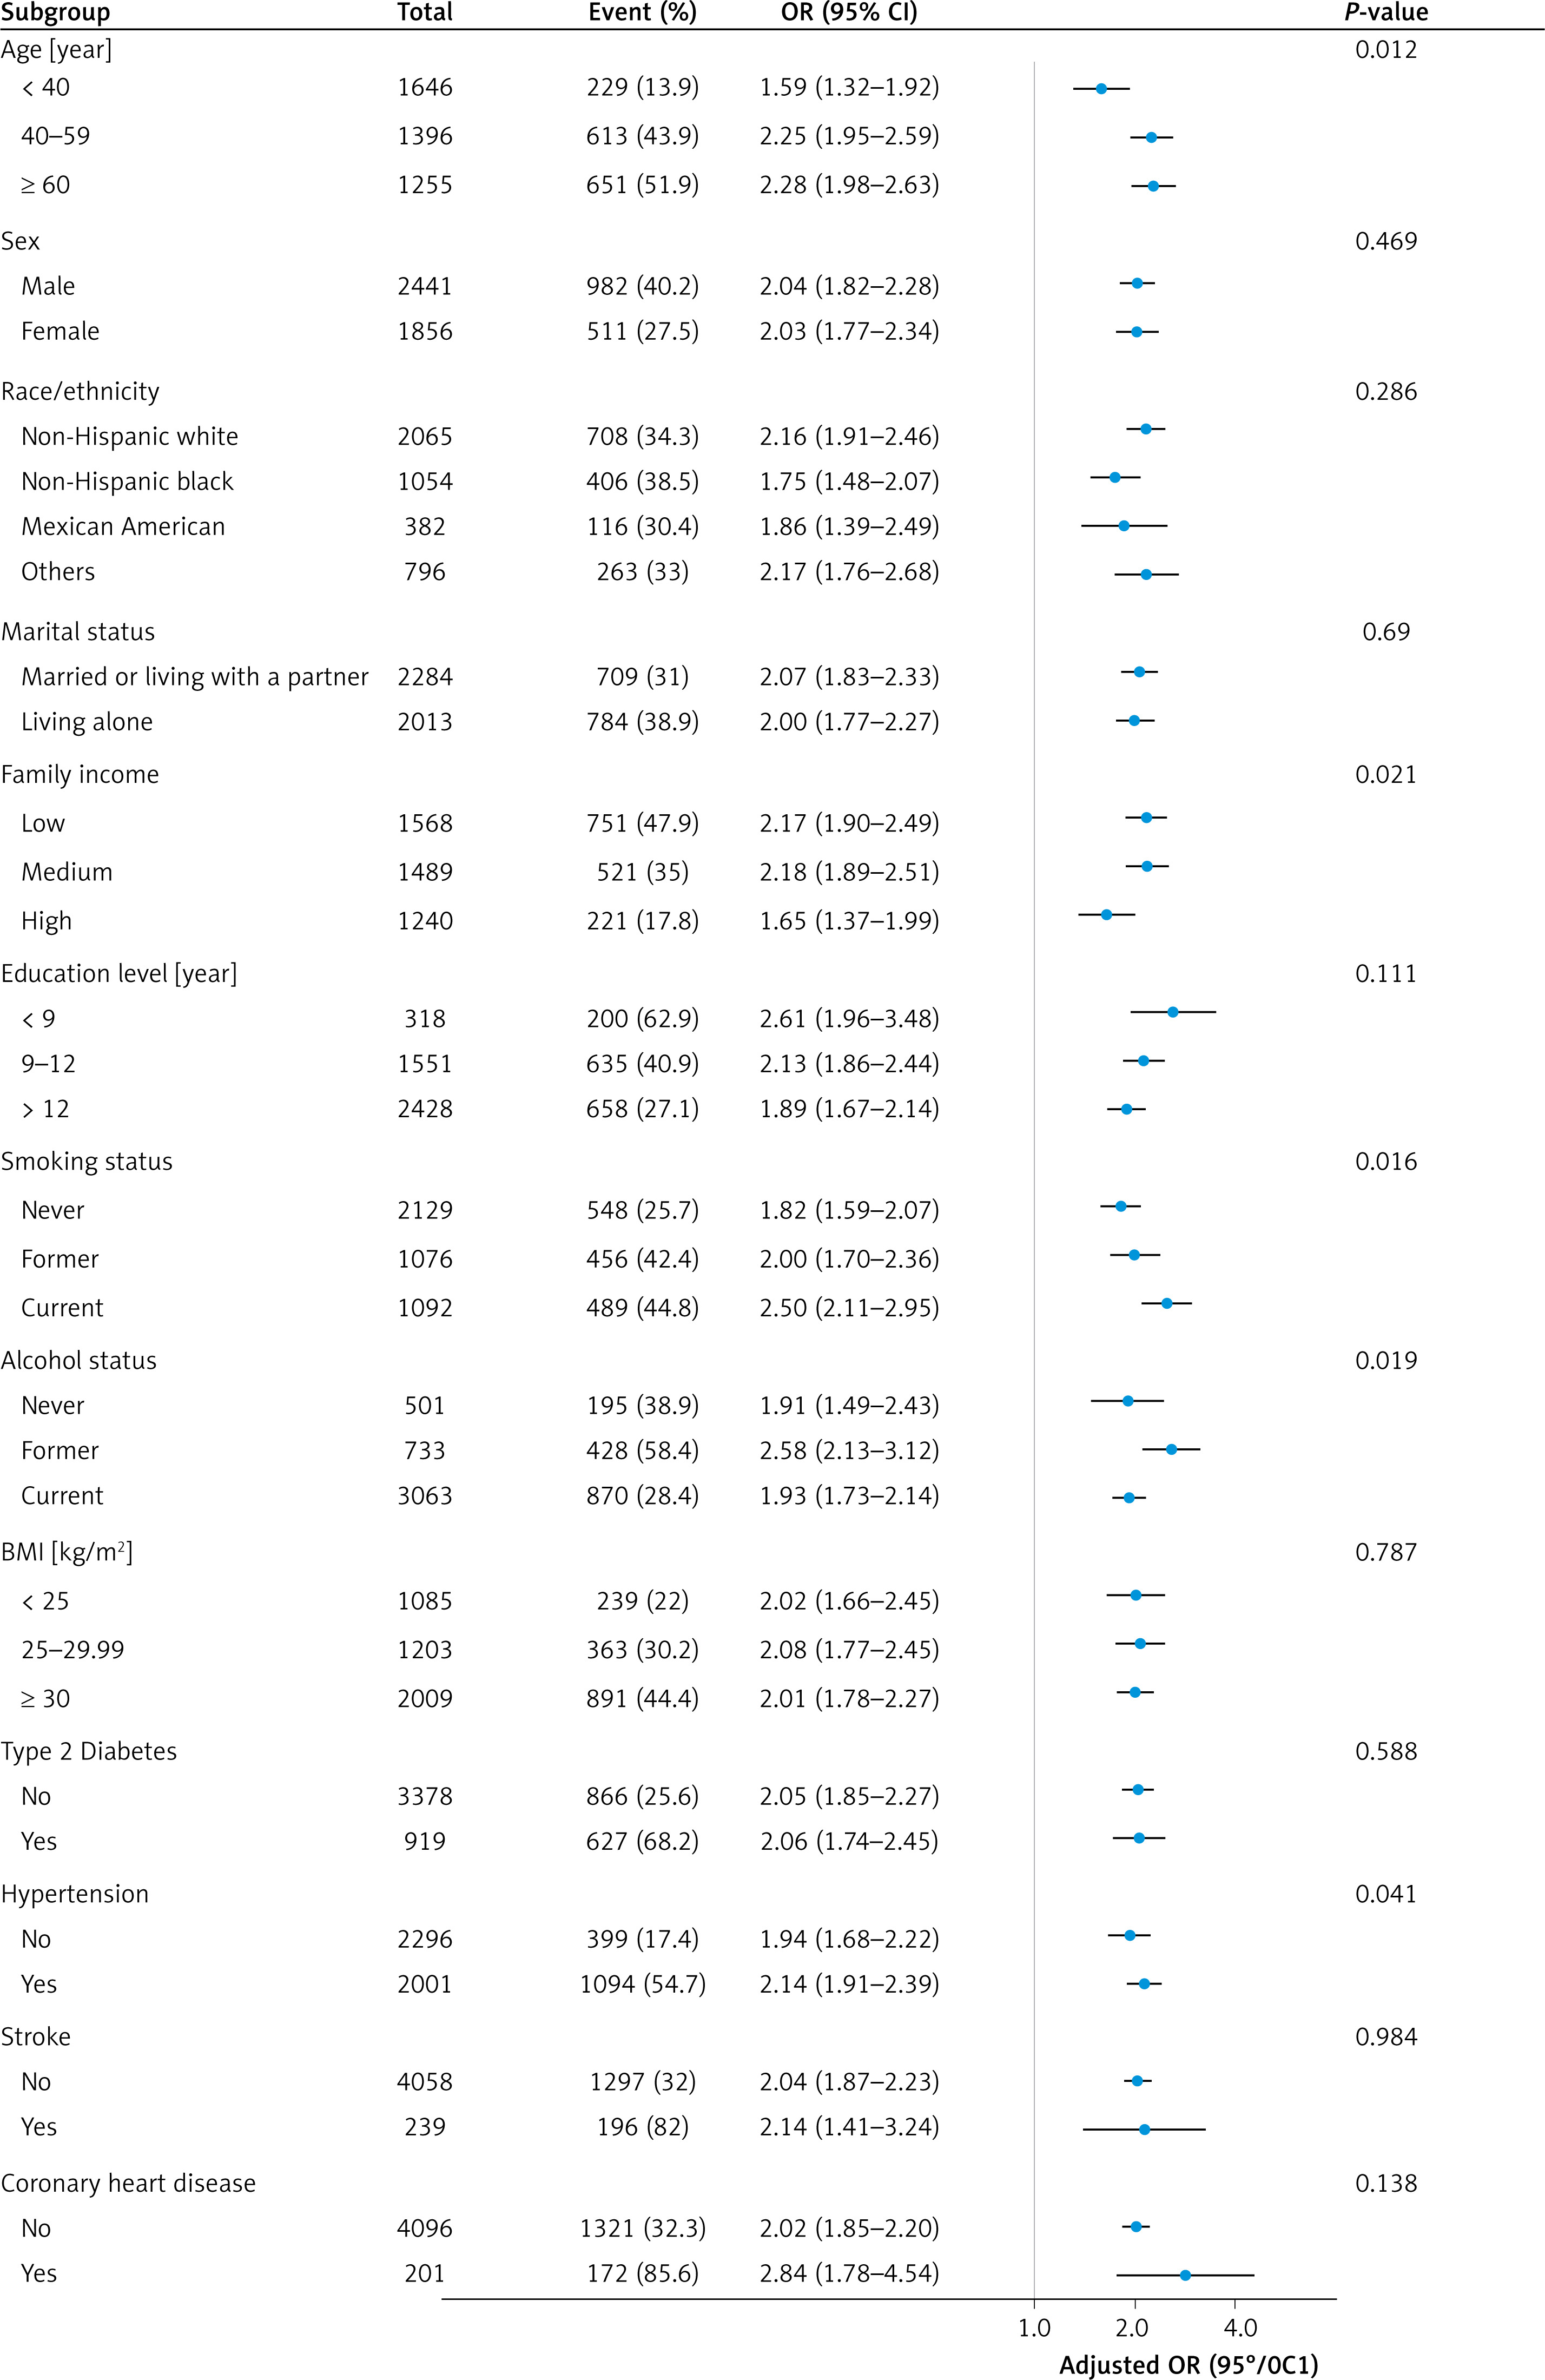
Subgroup analysis showed a robust and consistent association between asthma and increased risk of frailty, with significant interactions observed in relation to age, family income, smoking status, alcohol status, and hypertension (Figure 3). Asthmatic participants aged <40, 40-59, and >60 years experienced frailty incidence of 13.9%, 43.9%, and 51.9%, respectively (p = 0.012). Asthmatic participants with low, medium and high family income experienced frailty incidence of 47.9%, 35.0%, and 17.8% (p = 0.021). Asthmatic participants who had never smoked, former smokers, and current smokers experienced frailty incidence of 25.7%, 42.4%, and 44.8% (p = 0.016). Asthmatic participants who had never drunk, former drinkers, and current drinkers experienced frailty incidence of 38.9%, 58.4%, and 28.4% (p = 0.019). Asthmatic participants with and without hypertension experienced frailty incidences of 54.7% and 17.4% (p = 0.041).
Figure 3
Stratified multivariable analysis of the association between asthma and frailty according to baseline characteristics. Each stratification adjusts for all factors except the stratification factor itself. Adjusted factors include age, sex, race/ethnicity, marital status, family income, education level, smoking status, alcohol status, BMI, type 2 diabetes, hypertension, stroke, and coronary heart disease
MR analysis
Selection of genetic SNP for MR (asthma → frailty)
Following application of SNP selection criteria (P < 5×10⁻⁸, R2 < 0.001, kb = 10,000), 15 asthma-associated SNPs (Supplementary Table SIII) were identified as exposure SNPs (F-statistics > 10). During the selection process, outliers detected with MR-PRESSO analysis were excluded; ambiguous and palindromic ones were removed.
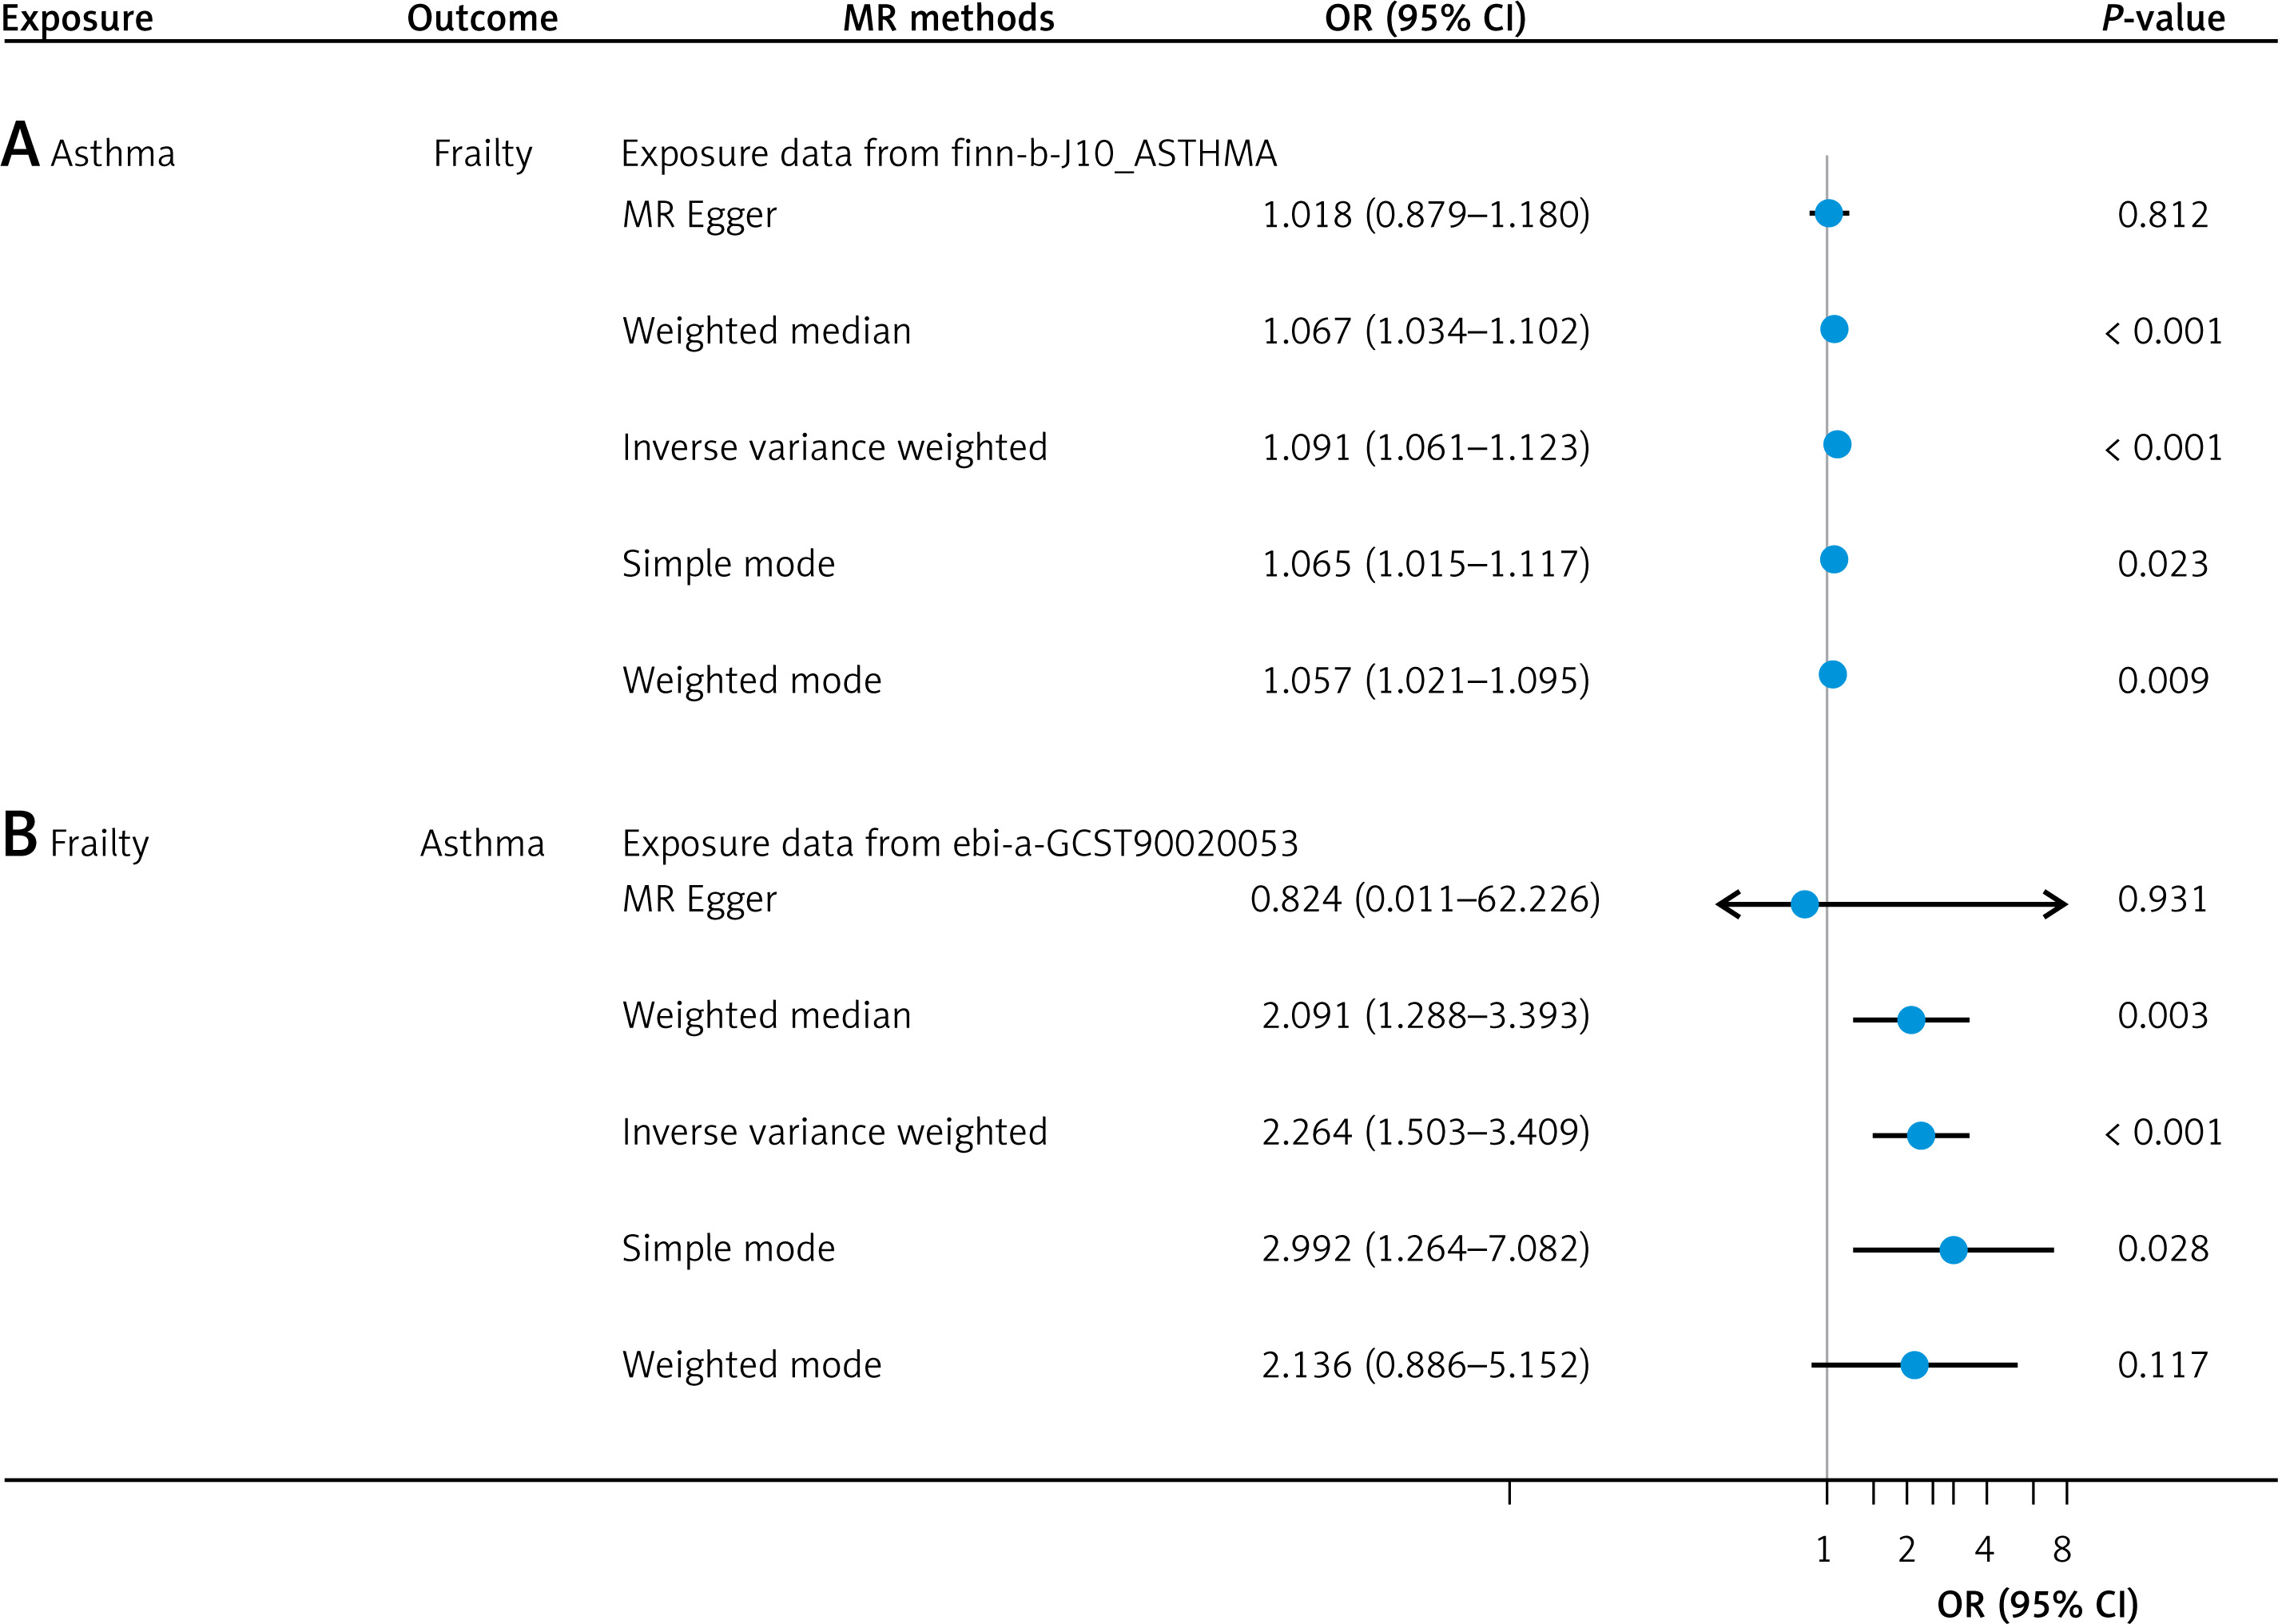
Causal effects of asthma on frailty
The MR analysis (Figure 4 A) showed that asthma was associated with increased risk of frailty (with the IVW method), and asthma patients had 1.091 times the risk of frailty (p < 0.001). Weighted median, simple mode, and weighted mode results were consistent with the IVW results. However, the MR-Egger regression analysis results were inconsistent with the IVW results, indicating the presence of potential biases or effect heterogeneity that needs to be considered. Scatter plots are presented in Supplementary Figure S1 A. The forest plot showed a significant positive effect of asthma on frailty index (with IVW method, Supplementary Figure S1 C). Leave-one-out analyses of the results described above are presented in Supplementary Figure S2 A, showing the minimal influence of individual SNP exclusions on the overall effect estimate.
Sensitivity analysis
Supplementary Figure 2 C shows symmetrical distribution of data, supporting the reliability of the MR analysis results. In the MR-PRESSO global test and MR-Egger intercept test, all p-values exceeded 0.05. Cochran’s Q test indicated heterogeneity in the effects of asthma on frailty (IVW, p = 0.024; MR Egger, p = 0.027).
Selection of SNP for reverse MR (frailty → asthma)
Following the SNP selection criteria, 13 frailty-associated SNPs (F-statistics > 10, Supplementary Table SIV) were used as exposure SNPs in the reverse MR study. Outliers detected through the MR-PRESSO analysis were excluded, and ambiguous and palindromic SNPs were removed.
Causal effects of frailty on asthma
The inverse MR analysis (Figure 4 B) indicated a significant causal effect of frailty on the risk of developing asthma (IVW method, OR = 2.264, p < 0.001). The weighted median and simple mode results were consistent with the IVW result. Inconsistency between the MR-Egger, weighted mode, and IVW results usually suggests the presence of pleiotropy or effect heterogeneity in the instrumental variables, or differences in statistical power among the methods. Scatter plots are presented in Supplementary Figure S1 B. The forest plot supported these results (Supplementary Figure S1 D). The leave-one-out analysis indicated that the relationship between frailty index and asthma risk was not significantly influenced by any single SNP (Supplementary Figure S2 B).
Sensitivity analysis
Supplementary Figure S2 D showed that most SNPs were positively associated with asthma due to higher frailty levels, and both MR methods confirmed the robustness of this causal relationship, with no significant pleiotropic biases. In the MR-PRESSO global test and MR-Egger intercept test, all p-values were above 0.05. Cochran’s Q test indicated no significant heterogeneity in the effects of frailty on asthma (IVW, p = 0.100; MR-Egger, p = 0.077).
Discussion
In this study, using survey data from NHANES, the cross-sectional analysis revealed a significant association between asthma and frailty. The bidirectional MR study showed a positive effect of asthma on the risk of frailty, with consistent results across four methods, excluding the MR-Egger. Reverse analyses indicated that frailty was also positively associated with an increased risk of asthma, with consistent results across three methods, excluding the MR-Egger and weighted mode. These results provide comprehensive evidence for a causal relationship between asthma and frailty by combining data from large-scale observational studies with MR analysis of extensive genetic data.
Asthma is a significant health issue affecting individuals across all age groups. Meanwhile, the rapid aging of populations is emerging as a major public health concern globally, including those with asthma [24]. In a cross-sectional observational study focusing on older adults with asthma, 52 out of 69 outpatient participants aged over 65 (representing 75.4%) were classified as frail [25]. A cross-sectional study involving 224,142 older adults aged 60 years or older revealed that older adults with asthma experienced a 3.3-fold higher prevalence of frailty compared to their counterparts without asthma [26]. Evidence also indicated that frailty was a significant risk factor for the development and progression of asthma [27]. Among the 12,345 community-dwelling adults in the GAZEL cohort, individuals with current asthma had an increased risk of frailty, regardless of the specific questions used to assess asthma status [24]. The observational studies often encountered challenges from confounding variables, making it difficult to establish causality. However, the present two-sample MR analysis used various approaches with data from the GWAS database and revealed a bidirectional causal relationship between asthma and frailty. The OR of 1.091 for the causal effect of asthma on frailty appears modest. However, we believe it may have clinical value for the following reasons. First, given the high global prevalence of asthma, although the increase in risk is relatively small, this association could have significant implications at the population level. Second, frailty is a multifactorial condition, and asthma may contribute to its development alongside other risk factors. Third, existing evidence suggests that chronic inflammatory conditions such as asthma may play a role in the development of frailty [28, 29]. Fourth, identifying asthma as a potential risk factor for frailty could inform preventive strategies and early interventions in clinical practice.
The bidirectional relationship between asthma and frailty could arise from shared pathophysiological mechanisms, particularly dysregulated inflammation [30–33]. Chronic systemic inflammation is strongly associated with the development of frailty, especially among older adults with asthma [34, 35]. Numerous inflammatory markers identified in frail individuals have also been detected in those with asthma, indicating a significant overlap in underlying biological processes [36]. Asthma, characterized by persistent airway inflammation, often coexisted with frailty, further complicating this relationship, yet the precise mechanisms linking frailty and asthma remain unclear [37]. Immunosenescence in frail elderly patients exacerbated this inflammatory state, leading to worsening asthma symptoms, while the inflammation triggered by asthma could also contribute to the onset of frailty [38]. Our subgroup analysis revealed that the incidence of frailty among asthma patients increased with age, highlighting the importance of recognizing this intersection. Additionally, chronic inflammation in asthmatic patients could extend beyond the respiratory system, resulting in elevated levels of peripheral blood eosinophils, total blood IgE, and type 2 cytokines [39]. Beyond inflammation, oxidative stress and mitochondrial dysfunction may further connect asthma and frailty, as excessive reactive oxygen species (ROS) impair lung function, promote muscle degradation, and accelerate cellular aging [40–43]. Additionally, autonomic nervous system dysregulation, characterized by increased bronchoconstriction in asthma and reduced vagal tone in frailty, may exacerbate disease severity in both conditions [44]. Metabolic disturbances, including insulin resistance, sarcopenic obesity, and hypothalamic-pituitary-adrenal (HPA) axis dysregulation, further contribute to frailty progression and poor asthma control [45–47]. Moreover, emerging evidence highlights the role of gut microbiome dysbiosis in both conditions, as disruptions in the gut-lung axis can exacerbate systemic inflammation and immune dysfunction [48–50]. Reduced physical activity in asthma patients due to dyspnea and airway obstruction may lead to muscle atrophy and sarcopenia, reinforcing frailty development, while frail individuals with weakened respiratory muscles and immune dysfunction face greater challenges in asthma management [51, 52]. Sleep disturbances, including nocturnal hypoxia and obstructive sleep apnea, further amplify systemic inflammation, oxidative stress, and metabolic dysfunction, exacerbating both frailty and asthma severity [53]. Given these interconnections, early identification of frailty risk factors and targeted interventions, such as anti-inflammatory and antioxidant therapies, microbiome modulation, structured exercise programs, and sleep optimization, are crucial to mitigating or delaying frailty onset in asthma patients. Further research is warranted to elucidate the precise molecular pathways underlying this bidirectional relationship and develop tailored therapeutic strategies for at-risk populations.
Other factors also contribute to this bidirectional relationship. Individuals with frailty were more susceptible to developing respiratory impairments, while those with respiratory issues were at a higher risk of experiencing frailty [54]. Common risk factors, including tobacco use, aging and endocrine dysfunction, were associated with frailty and respiratory impairment [5, 55, 56]. Reduced physical activity made older adults with asthma more prone to sarcopenia, which was a critical factor in the progression of frailty syndromes [57]. Immune system dysfunction in frail patients [58, 59], combined with reduced physical activity and weakened respiratory muscles, made managing asthma more challenging [3, 38]. Asthma associated airway obstruction and breathing difficulties could restrict physical activity and exacerbate frailty. Frail older adults experienced swallowing dysfunction, which increased the risk of aspiration and choking, potentially leading to respiratory diseases [60]. Gastro-esophageal reflux disease (GORD) is a significant trigger for asthma, driven by mechanisms such as microaspiration of gastric acid into the airways, vagal-mediated reflux, and direct esophageal stimulation by acid [61]. The prevalence of GORD among individuals with asthma was particularly high, with studies reporting rates ranging from 34% to 89% [62–67]. Therefore, it is essential to identify risk factors for frailty and implement early targeted interventions in asthma patients to mitigate or delay the onset of frailty.
This study used a combination of observational analysis and MR study to explore the association between asthma and frailty. By analyzing data from NHANES, we first found a significant association between asthma and frailty. In addition, we further validated this observational result with the MR study, revealing a possible two-way causal relationship between asthma and frailty. The main strengths of this study included the use of NHANES data and a two-way multi-database MR method, which generally reduced susceptibility to causality errors often seen in observational studies due to confounding factors and reverse causality. Additionally, all participants in the GWAS dataset were homozygous and of European ancestry, which minimized population heterogeneity. Due to the potential overlap between the asthma-related genes in the UK Biobank and the frailty-related genes from the same source, we opted to focus exclusively on the FinnGen database for our analysis of asthma genes. However, there are some limitations to acknowledge. First, NHANES data, being self-reported, were inevitably subject to recall bias. Diagnoses of asthma were primarily based on questionnaires without corroborative laboratory data on respiratory function, potentially introducing selection bias. Secondly, identifying all multi-effect SNPs can be challenging, as the complex interactions among certain phenotypes are not yet fully understood. This study used data from the UK Biobank and the FinnGen database, employing various models to validate the MR hypothesis, which produced generally consistent results, though some uncertainties remain. Furthermore, as this study predominantly pertained to individuals of European descent, the findings may not be applicable to other populations. Caution should be exercised in interpreting these results, and further validation in larger, more diverse datasets is necessary.
In conclusion, this study revealed a bidirectional causal relationship between asthma and frailty, both of which are global health concerns. Effective asthma management is crucial for reducing the risk of frailty. Therefore, routine screening for frailty in asthma patients is recommended, along with the implementation of appropriate treatment and management strategies.