Introduction
Osteoarthritis (OA) is a chronic condition impacting joint cartilage, leading to damage of the meniscus, subchondral bones, and ligaments, which frequently affects the hips, knees, feet, and hands [1]. Clinically, OA is characterized by progressive joint swelling, stiffness, pain, and functional impairment. The incidence and prevalence of disability correlated with OA are rising each year, positioning it as the second most common and disabling condition after heart disease [2]. As reported by Cross et al., the number of disability cases attributed to OA increased from 10.5 million in 1990 to 17.1 million in 2010 [3]. Globally, the prevalence of OA is approximately 18% among females and 10% among males aged 60 years old and older. Approximately 80% of these individuals experience restricted mobility, and the conditions significantly impact daily life of one in four affected individuals [4, 5].
Recent research has described OA as a multifaceted disease influenced by various causative factors. Aging, obesity, disruptions in metabolic homeostasis disorders, and genetic predisposition have been identified as potential risk factors for the development of OA [6–8]. Currently, the aging population and increasing prevalence of obesity contribute to an elevated risk of obesity-related conditions, including type 2 diabetes mellitus (T2DM), OA, hypertension, sleep disorders, cardiovascular disease, and premature mortality [9]. Globally, body mass index (BMI) is extensively used to evaluate health risks and weight status correlated with obesity in individuals. Nevertheless, despite BMI being widely used as a simple clinical indicator, it has several limitations and may not be able to comprehensively or accurately assess an individual’s overall health status [10]. Several studies have indicated that there may be considerable variations in the quantity of muscular tissue, visceral adipose tissue (VAT), and metabolic profiles among individuals with identical BMI values [11, 12]. Waist-to-height ratio (WHtR), hip circumference, and waist circumference (WC) are increasingly being used as predictors for obesity in OA [13]. However, akin to BMI, these measures are not without limitations. Meanwhile, MRI is widely recognized as the gold standard for evaluating VAT, but its high cost limits researchers’ exploration of the correlation between OA and visceral adiposity [8]. Consequently, it is imperative to identify more accessible indicators that can accurately reflect visceral adiposity levels for predicting OA.
The visceral adiposity index (VAI) emerges as a viable indicator for assessing VAT, calculated from triglyceride (TG), WC, high-density lipoprotein cholesterol (HDL-C), and BMI levels [14–16]. Clinical investigations have demonstrated that VAI is an effective tool for identifying individuals at elevated risk for metabolic disorders, such as lipid abnormalities, insulin resistance, and cardiovascular risk factors [17–19]. Considering the substantial impact of age on the prevalence of various diseases, VAI has been refined through the incorporation of age-related adjustments, resulting in the development of the age-adjusted VAI (AVAI), and is particularly noteworthy for its efficacy in accurately predicting the risk of all-cause and cardiovascular mortality [20].
Similarly affected by age, OA may have a unique correlation with AVAI. However, the accuracy of using AVAI as a predictor for OA has not been previously explored. To examine the correlation between AVAI and OA, this cross-sectional study was conducted on data from NHANES.
Material and methods
Research population
NHANES, administered by the National Center for Health Statistics (NCHS) [21, 22], is an extensive research initiative aimed at evaluating the correlation among health promotion, disease prevention, and nutrition. This biennial survey is conducted through physical examinations, interviews, and a range of sections that include demographic, dietary, laboratory, and examination data.
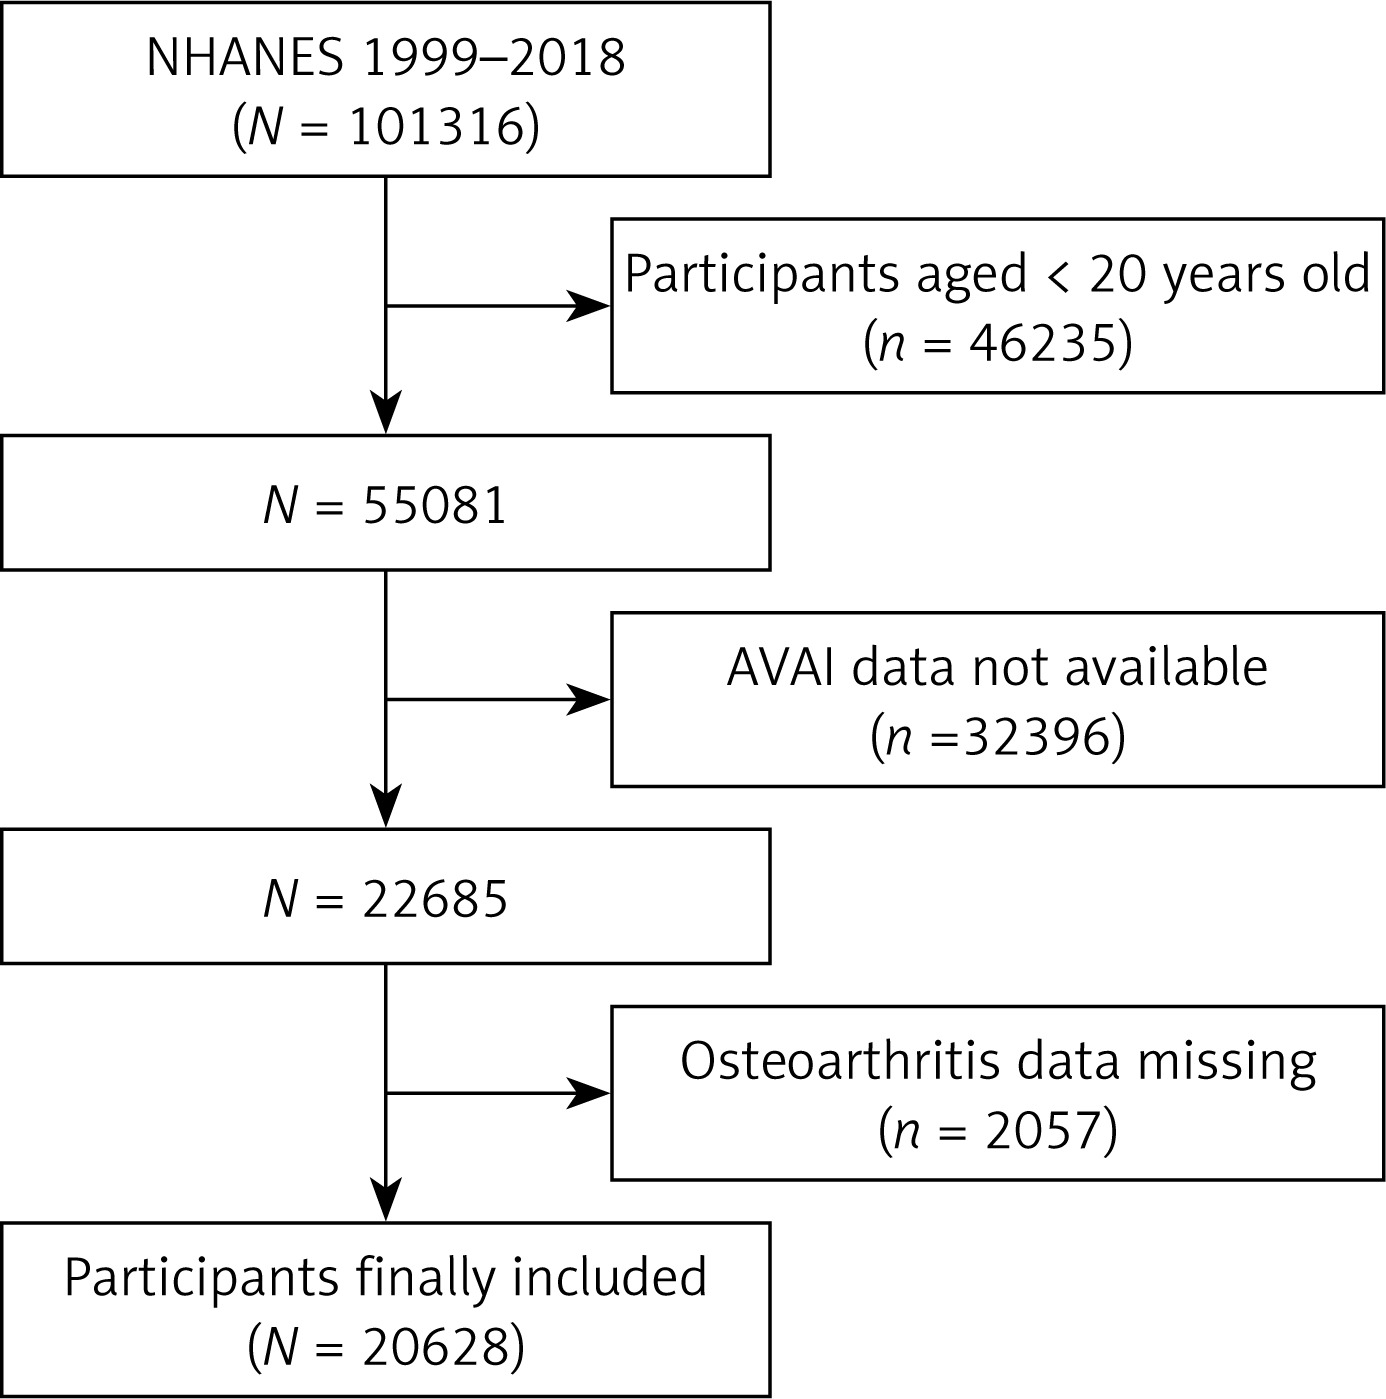
In the present study, data were obtained from NHANES for the period 1999–2018. Subjects aged 20 years old or above were included (n = 46,235). Subjects missing data on AVAI (n = 32,396) and OA (n = 2057) were excluded by the exclusion criteria. Finally, the samples in this study consisted of 20,628 subjects (Figure 1).
Calculation formulae of VAT surrogate markers
The calculation formulae for VAT surrogate markers have been developed with simple anthropometric measurements. These markers include AVAI, VAI, lipid accumulation product (LAP), and WHtR.
LAP (male) = TG × (WC – 65) [23], LAP (female) = TG × (WC – 58) [23], VAI (male) = [WC/[(TG/1.03) × (1.88 × BMI)]) × (1.31/HDL) + 39.68] [24]; VAI (female) = [WC/[(TG/0.81) × (1.89 × BMI)]) × (1.52/HDL) + 36.58] [24], AVAI (female) = –16.186 + 0.144 × age – 0.013 × BMI + 0.038 × WC – 1.369 × HDL-C – 0.151 × TG, AVAI (male) = –10.727 + 0.101 × age – 0.108 × BMI – 0.043 × WC – 1.157 × HDL-C + 0.075 × TG [20]; WHtR = WC/height, where both HDL-C and TG levels were expressed in mmol/l, and WC and height were expressed in cm.
Measurement of covariates
Building upon previous studies [25–27], the final analysis incorporated potential confounding factors correlated with AVAI and OA. These factors included demographic variables such as height, race, age, WC, sex, educational attainment, physical activities, and weight, alongside questionnaire data on smoking status, diabetes, alcohol consumption, hyperlipidemia and hypertension. Blood samples were analyzed for various biomarkers, including TC, ALT, LDL-C, GGT, UA, total calcium, ALP, AST, TG, 25(OH)D, creatinine, HDL-C, and albumin. Detailed methodologies for measurement and data acquisition for each variable are available at www.cdc.gov/nchs/nhanes.
Statistical analysis
AVAI was stratified into quartiles as follows: Q1 (≤ –10.25), Q2 (–10.25 to –8.13), Q3 (–8.13 to –5.81), and Q4 (≥ –5.81). The correlation between OA and AVAI was examined through multiple logistic regression models, yielding odds ratios (ORs) and 95% CIs. Variables deemed significant in the univariate analysis were subsequently incorporated into the multivariate analysis. Three different models were used for this analysis: Model 1 (unadjusted), Model 2 (adjusted solely for sex and age), and Model 3 (comprehensively adjusted for a range of factors including alcohol consumption, sex, smoking status, age, educational attainment, moderate physical activities, race, albumin, diabetes, ALT, hyperlipidemia, hypertension, 25(OH)D, total calcium, AST, creatinine, uric acid, and ALP). The potential influence of covariates on this correlation was further examined through subgroup and interaction analyses. Additionally, the non-linear correlation between OA and AVAI was examined through restricted cubic spline (RCS) curves, with particular attention to potential non-linearity. Subsequently, the diagnostic efficacy of AVAI, VAI, LAP, BMI, WC, and WHtR was evaluated through ROC analyses. Data analyses were performed with Free Statistics software and R software.
Results
Characteristics of research subjects
The study encompassed a total of 20,628 subjects aged between 20 and 80 years old, with a prevalence of OA of 11.1%. Demographic characteristics categorized by AVAI quartiles are detailed in Table I. Subjects in the highest AVAI quartile had a greater prevalence of OA, hypertension, hyperlipidemia, and diabetes mellitus, alongside elevated levels of uric acid, age, BMI, triglycerides, creatinine, WC, 25(OH)D, and ALP, compared to those in the lowest quartile. Conversely, subjects in the highest quartile exhibited reduced levels of albumin and HDL-C (p < 0.01).
Table I
Characteristics of the study population based on AVAI quartiles
[i] Values are mean ± SD or number (%). P < 0.05 was deemed significant. BMI – body mass index, TC – total cholesterol, TG – triglyceride, HDL-C – high-density lipoprotein cholesterol, LDL-C – low-density lipoprotein cholesterol, AVAI – age-adjusted visceral adiposity index, PIR – poverty income ratio.
Correlation between AVAI and OA
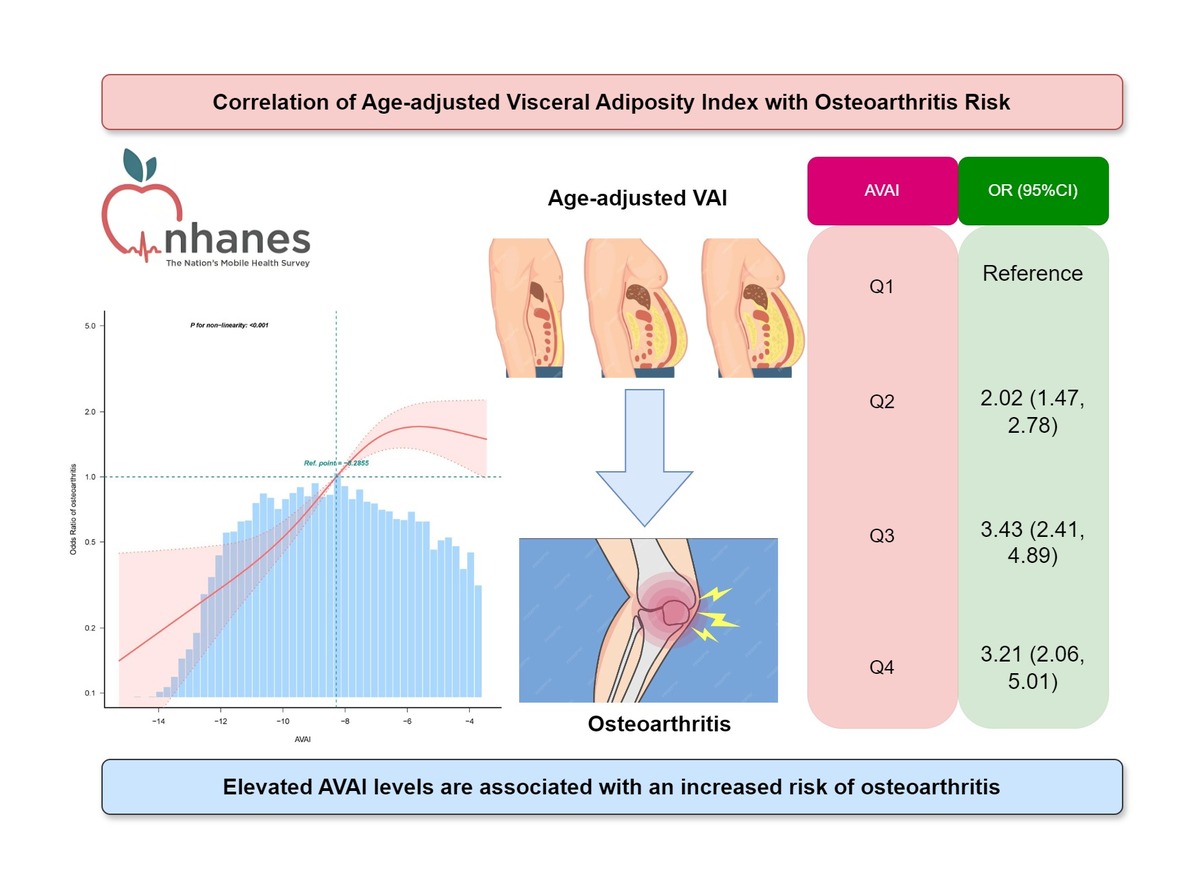
To examine the correlation between AVAI and OA, three multiple regression models were developed, as presented in Table II. The unadjusted Model 1 revealed a statistically significant positive correlation between AVAI and OA, which was significant even after controlling for all covariates in Model 3 (OR = 1.14, 95% CI: 1.06, 1.23, p < 0.001).
Table II
Logistic regression analysis between AVAI and osteoarthritis
[i] Model I: None of the covariates were adjusted; Model II: sex and age were adjusted; Model III: drinking, smoking, sex, educational level, age, race, moderate physical activities, diabetes mellitus, albumin, material hyperlipidemia, hypertension, ALT, 25(OH)D, total calcium, AST, creatinine, ALP, and uric acid were adjusted.
Non-linearity analysis between AVAI and OA
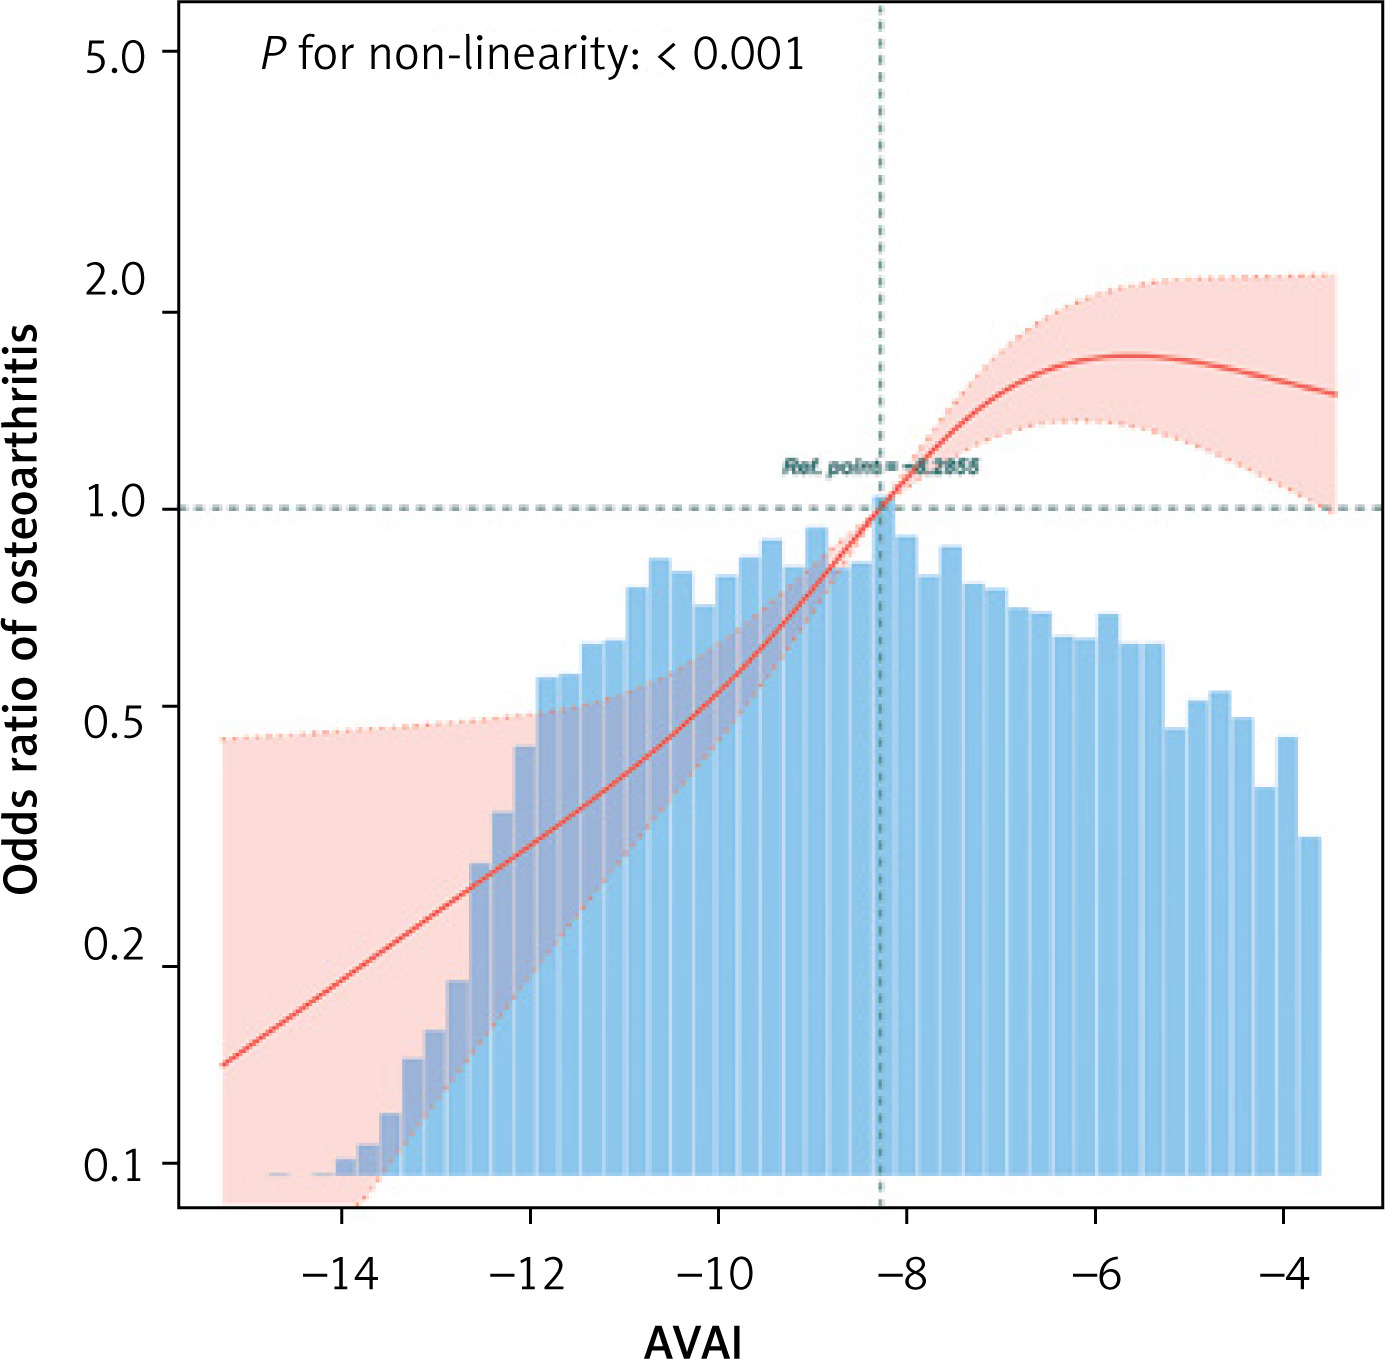
Through RCS analyses on Model 3, the correlation between AVAI and OA was further explored. The findings illustrated in Figure 2 indicated a non-linear correlation between AVAI and OA. Additionally, a subsequent threshold effect analysis as shown in Table III identified an inflection point for AVAI at –6.03, with a log-risk ratio of less than 0.001.
Table III
Threshold effect analysis of AVAI on osteoarthritis: using the two-piecewise linear regression model
Subgroup analysis
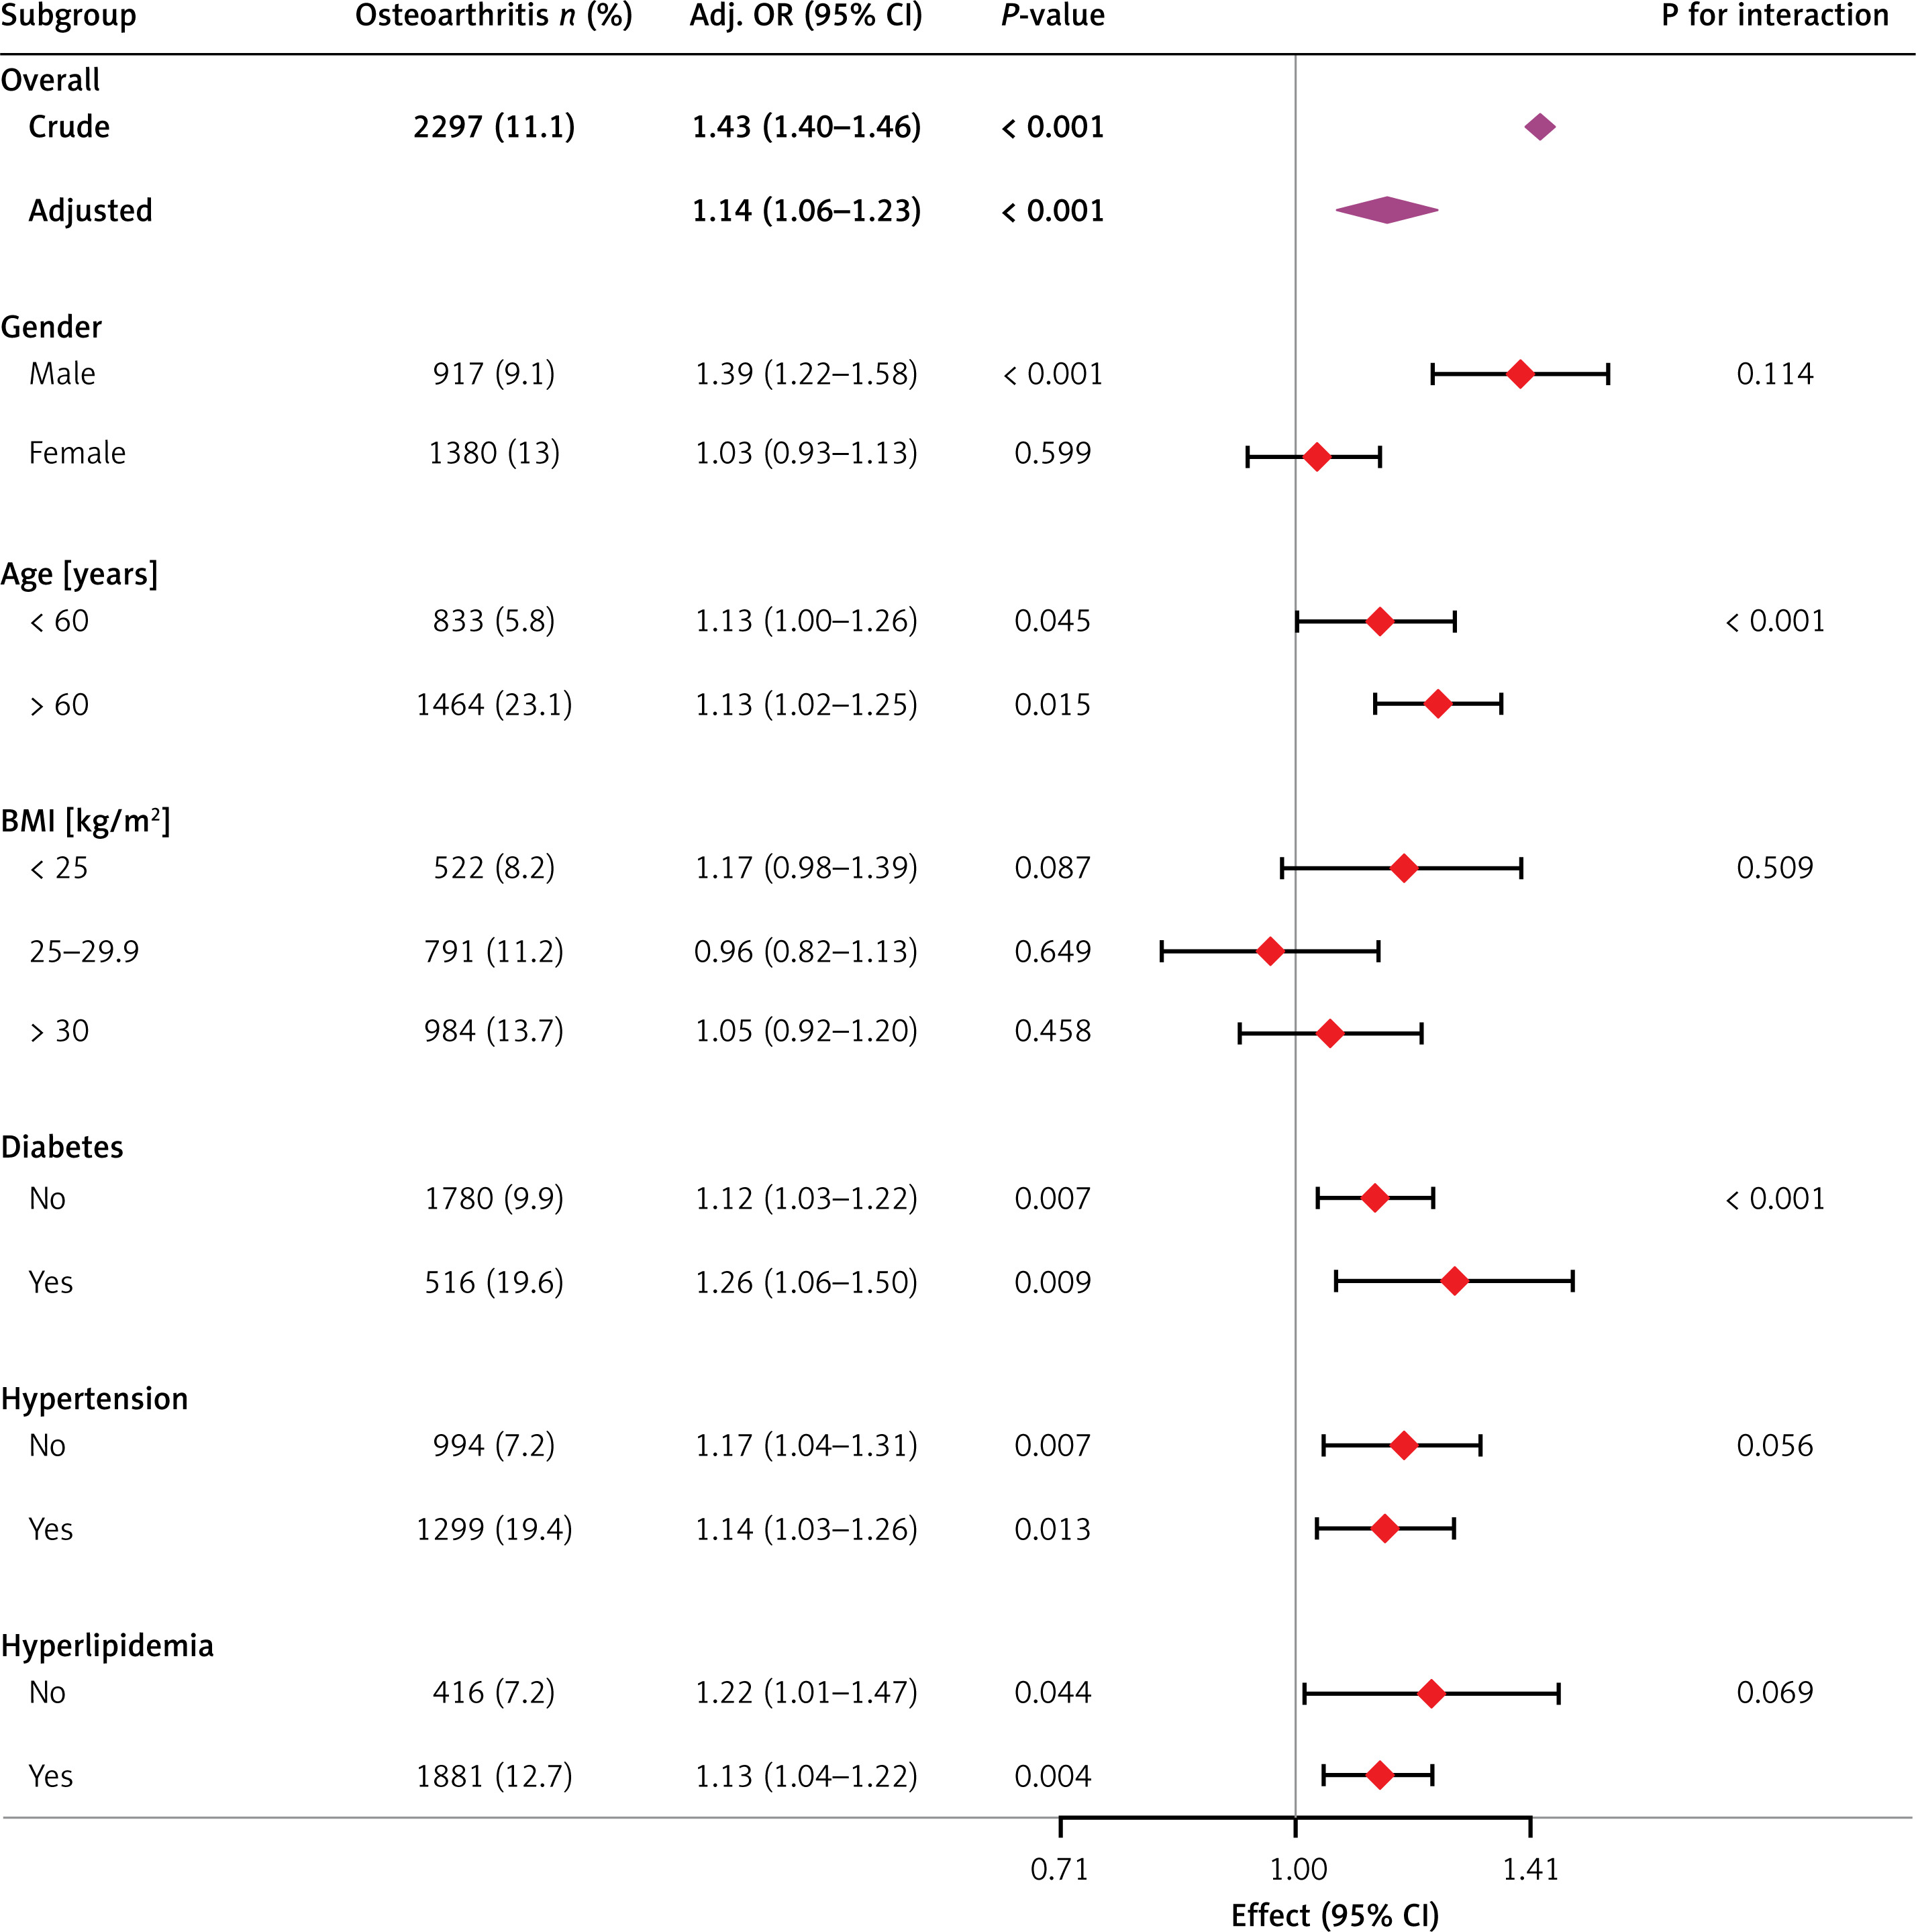
The robustness of the correlation between AVAI and OA was assessed through extensive interaction tests and subgroup analyses to identify potential variation among different populations (Figure 3). The results consistently demonstrated a significant correlation between AVAI and OA among the majority of subgroups. Importantly, this correlation was more pronounced among older individuals and those with diabetes.
Predictive value of AVAI for OA
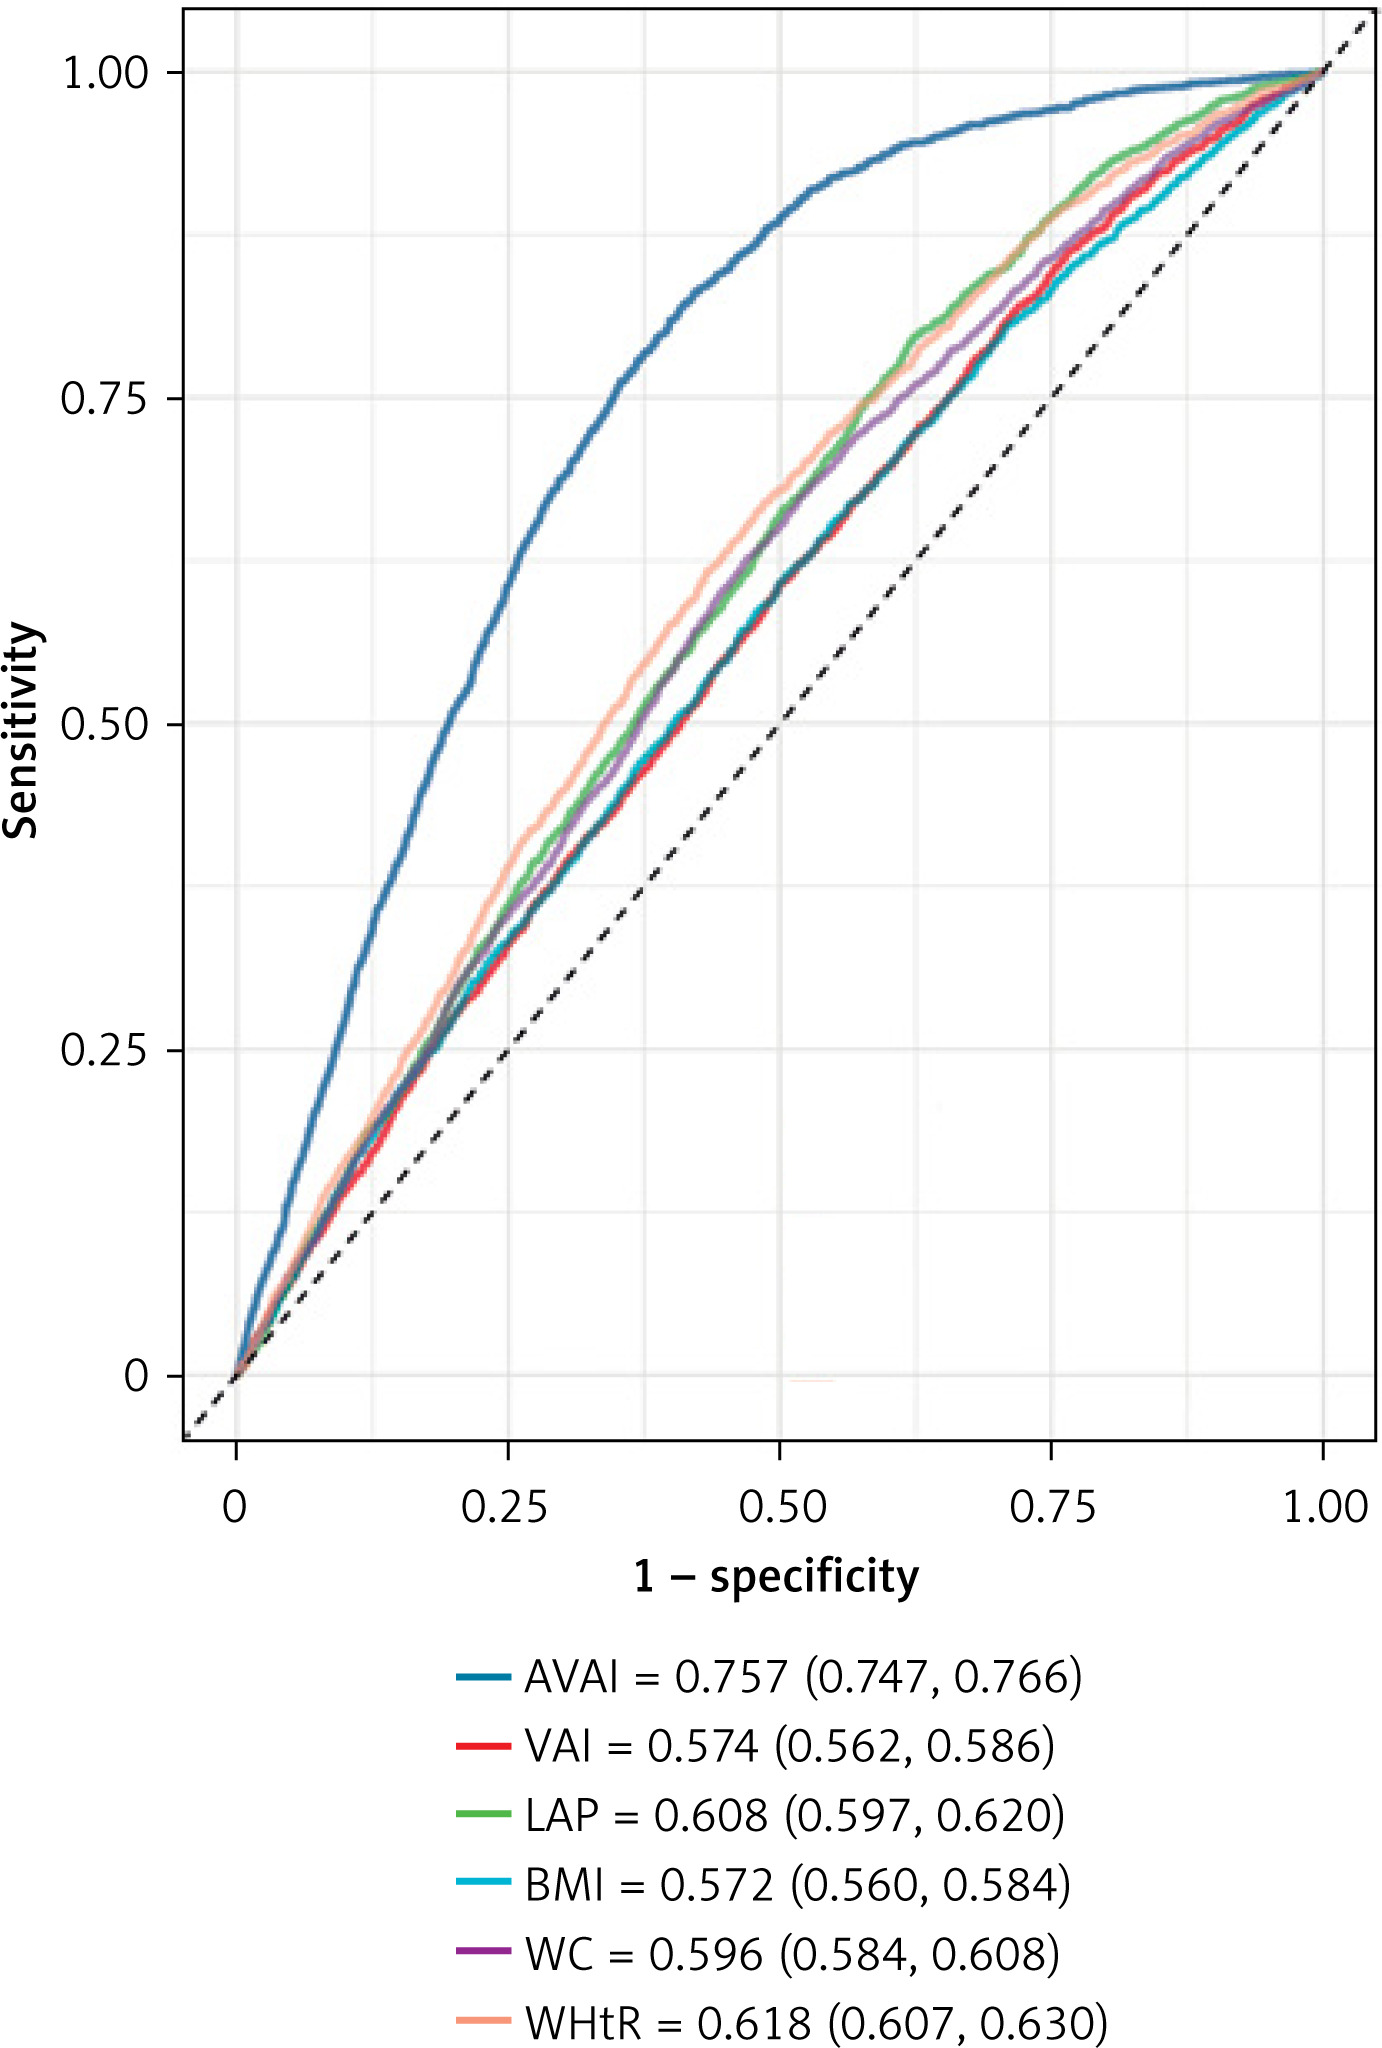
The ROC curve illustrated in Figure 4 evaluated the diagnostic efficacy of AVAI, VAI, LAP, BMI, WC, and WHtR in the identification of OA. According to the data presented in Table IV, AVAI demonstrated the highest diagnostic accuracy for OA, achieving an AUC of 0.757 (95% CI: 0.747–0.766), and significantly outperformed other VAT surrogate markers (p < 0.001).
Table IV
AUC for each index to discriminate osteoarthritis
Discussion
In this cross-sectional study including a representative sample of 20,628 subjects, a significant positive correlation was identified between AVAI and OA, which was especially pronounced among older adults and those with diabetes. Importantly, a non-linear correlation between AVAI and OA was observed, with a saturation point at a value of –6.03. Furthermore, among the six VAT surrogate indices evaluated – AVAI, VAI, LAP, BMI, WC, and WHtR – AVAI exhibited the largest AUC in predicting the risk of OA.
OA is a pathological condition marked by degenerative alterations in joints, typically resulting in deterioration of articular cartilage. Despite substantial advancements in medical technologies enhancing our understanding of etiology and treatment modalities for OA, its prevalence and correlated global health burden continue to escalate annually [28]. Obesity, a significant public health concern worldwide, is considered a critical risk factor for the onset and progression of OA. On an international scale, BMI is frequently employed as a metric for evaluating the risk of obesity and OA. However, an increasing number of researchers have begun to critically evaluate the reliability of BMI as a measure for assessing the risk of OA and its limitations in accurately determining individuals’ true obesity status [19]. This skepticism arises from the fact that BMI fails to accurately represent the proportions of muscles and adipose tissues and does not account for variation in fat distribution across sex and age [29].
VAI has the potential to assess adipose tissue dysfunction and VAT [30]. A few studies have identified a significant correlation between VAI and conditions such as hypertension, diabetes, and cardiovascular diseases [31–34]. Furthermore, existing research indicates that aging plays a crucial role in influencing OA and body fat distribution [35]. AVAI, a novel metric for evaluating visceral obesity, has been shown to potentially surpass BMI and VAI in predicting cardiovascular and all-cause mortality in American adults [20]. This correlation is attributed to the inclusion of age in its calculation, allowing AVAI to offer a more nuanced evaluation of the impact of visceral fat on health compared to the traditional VAI, which does not consider age-related variations in fat function and distribution. The findings in this study are consistent with previous research on AVAI (as shown in Figure 4). To date, this study is the first to explore the correlation between AVAI and OA. AUC for AVAI was significantly greater than that of other surrogate markers for VAT.
Subgroup analysis revealed that the correlation between AVAI and OA was significantly more pronounced in older adults and those with diabetes (p for interaction < 0.001). This finding aligns with results from prior research. For example, Lv et al. reported in a cross-sectional study involving 5620 subjects that the association between VAI and type 2 diabetes was more significant in individuals over the age of 60 [36]. These results may be explained by differences in body fat distribution and metabolic factors between younger and older groups [37]. Furthermore, a substantial body of research has confirmed the contribution of obesity and diabetes mellitus to the initiation and progression of OA [35]. Consequently, AVAI should be considered a critical determinant in the identification of OA, particularly within the aforementioned population.
Furthermore, a noteworthy discovery was reported regarding the non-linear correlation between AVAI and OA. It was found that a saturating effect of OA can occur when AVAI reaches –6.03. Previous studies have identified a curvilinear positive correlation between LAP and OA [19], which aligns with the findings of this study. This phenomenon can be attributed to the elevated prevalence of OA in those with high AVAI, resulting in a plateau in its changes. These findings have the potential to offer new insights into the prevention and treatment of OA.
While the exact mechanisms connecting AVAI to the onset of OA have not been fully elucidated yet, they are likely to be categorized into three primary areas: inflammatory, mechanical, and metabolic factors. The accumulation of VAT leads to increased mechanical loading, especially on weight-bearing joints, which exacerbates stress on articular cartilage, which can accelerate cartilage degradation and wear and stimulate sub-chondral bone sclerosis and proliferation [38]. Moreover, excessive mechanical loading has been shown to elevate the levels of inflammatory mediators such as TNF-α and IL-1β, and activate related pathways [39], which can be further corroborated by biomechanical evidence. Additionally, research has demonstrated that VAT is metabolically active and can influence the progression of metabolic disorders, including T2DM, thereby affecting OA. This phenomenon is attributed to the elevation of blood glucose levels, which can increase oxidative stress in chondrocytes and facilitate the formation of advanced AGEs within cartilage tissues [40]. Furthermore, VAT demonstrates a higher susceptibility to infiltration by inflammatory cells and can exhibit an augmented ability to produce proteins such as CRP, TNF-α, and IL-6 [41, 42]. Additionally, the reactive adipokines generated by abnormal VAT may influence OA by impairing insulin sensitivity, exacerbating inflammation, and activating cartilage degradation mechanisms [43, 44].
This study exhibits notable strengths and limitations. Firstly, the selection of the NHANES database, known for its representative and adequate sample size, enhances the statistical validity and reliability of these findings. Secondly, the identification of a nonlinear correlation between AVAI and the risk of OA offers further evidence supporting a threshold effect. However, certain study limitations remain. Firstly, the cross-sectional design, precluding the establishment of causality and limiting its ability to fully account for potential bias arising from confounding factors, represents a significant limitation. Consequently, future cohort studies are necessary to validate these findings. Secondly, while the study incorporated a comprehensive range of relevant covariates, the influence of additional potential covariates could not be entirely ruled out. Furthermore, several key variables, including OA, were assessed through questionnaires, which may introduce recall bias into the results. Moreover, there is a paucity of imaging materials facilitating the assessment of visceral fat and OA. Consequently, additional validation of the findings through imaging modalities such as MRI and CT is necessary.
Based on the above discussion, we can conclude that AVAI has certain guiding significance, especially for geriatric patients. Firstly, geriatric patients often have insufficient awareness of changes in their body composition, making it difficult for them to adhere to the detection of such changes, especially with time-consuming and laborious examinations such as CT scans. AVAI, as a simple indicator, can be calculated using routine biochemical and physical examination data. This is very helpful for geriatric patients to understand the changes in their body composition, particularly abdominal fat, and to manage it by changing dietary habits and increasing physical exercise. AVAI can serve as an indicator for assessing the metabolic health status of geriatric patients. Secondly, our study found that AVAI outperforms other indicators in predicting OA risk, which helps doctors assess the risk of OA and take appropriate intervention measures in a timely manner.
In conclusion, the present study demonstrated a significant correlation between elevated AVAI and the increased prevalence of OA. Compared to other VAT indices, AVAI emerges as a more effective and convenient surrogate marker for assessing VAT. This finding may facilitate healthcare providers in identifying individuals at higher risk for developing OA, thereby enabling earlier implementation of preventive strategies and potentially slowing disease progression.