Introduction
Osteoarthritis (OA) is the most common degenerative joint disorder worldwide and a prevalent chronic clinical condition [1]. Based on the Global Burden of Disease Study 2019, it is estimated that there are approximately 527 million cases of the disorder worldwide. The prevalence of OA is about 3% of the elderly population worldwide [2]. After the age of 50, OA is more prevalent in females than males, with an estimated occurrence of 10% in males and 18% in females [2, 3]. Knee osteoarthritis (KOA) and hip osteoarthritis (HOA) are the most commonly encountered manifestations [4], with KOA accounting for approximately 60.6% of the total prevalent cases and HOA at 5.5% [5]. OA predominantly manifests as morning stiffness, joint pain, tenderness, joint swelling, or deformity, collectively resulting in a diminished quality of life for affected individuals and an increased economic burden on both households and society at large [3, 6]. OA is a systemic ailment involving bone, cartilage, synovium, ligaments, and joint capsules [1]. Moreover, factors such as obesity, prior joint injuries, mechanical characteristics, and genetic predisposition can contribute to osteoarthritis development in both young and older populations [7].
Research suggests that easily measurable human body composition indices such as fat mass, lean mass, waist circumference, and waist-to-hip ratio can be valuable predictive indicators for OA [8]. Thus, it is worth considering whether other variations in body composition could also be indicative of OA. One such measure is whole-body water mass (BWM), which can be obtained through bioimpedance analysis. Water is a significant constituent of the human body, accounting for approximately 50% to 55% of adult female body weight. Muscle tissue, in particular, comprises about 76% water content, indicating that water loss may impact muscle function [9]. Water emerges as an ideal biomarker for the early diagnosis of OA, with measurements of water content offering insights into cartilage mass status and early OA detection. The gradual and age-associated loss of water content may partially contribute to functional impairments over time [10]. Recent studies have established causal relationships between BWM and atrial fibrillation [11] and its association with sleep apnea [12]. However, to date, no research has employed Mendelian randomization (MR) methodology to assess the relationship between BWM and OA.
MR is widely used to evaluate the causal relationship between exposures and clinical outcomes based on summary data from genome-wide association studies (GWAS), using single nucleotide polymorphisms (SNPs) as instrumental variables [13]. MR is an epidemiological method that uses genetic variants to serve as proxies for exposure, allowing for the prediction of its causal association with an outcome. The fundamental principle of MR analysis is that genetic variants are randomly inherited at conception. Because their distribution in a population is natural, it is presumed that the results of MR analyses are less susceptible to environmental influence and confounding factors [13]. In the present study, we utilized validated SNPs and summary statistics from publicly available GWAS datasets to investigate the causal association between BWM and OA development using the MR method. These provide valuable insights for the detection, prediction, and prevention of OA.
Material and methods
Data sources
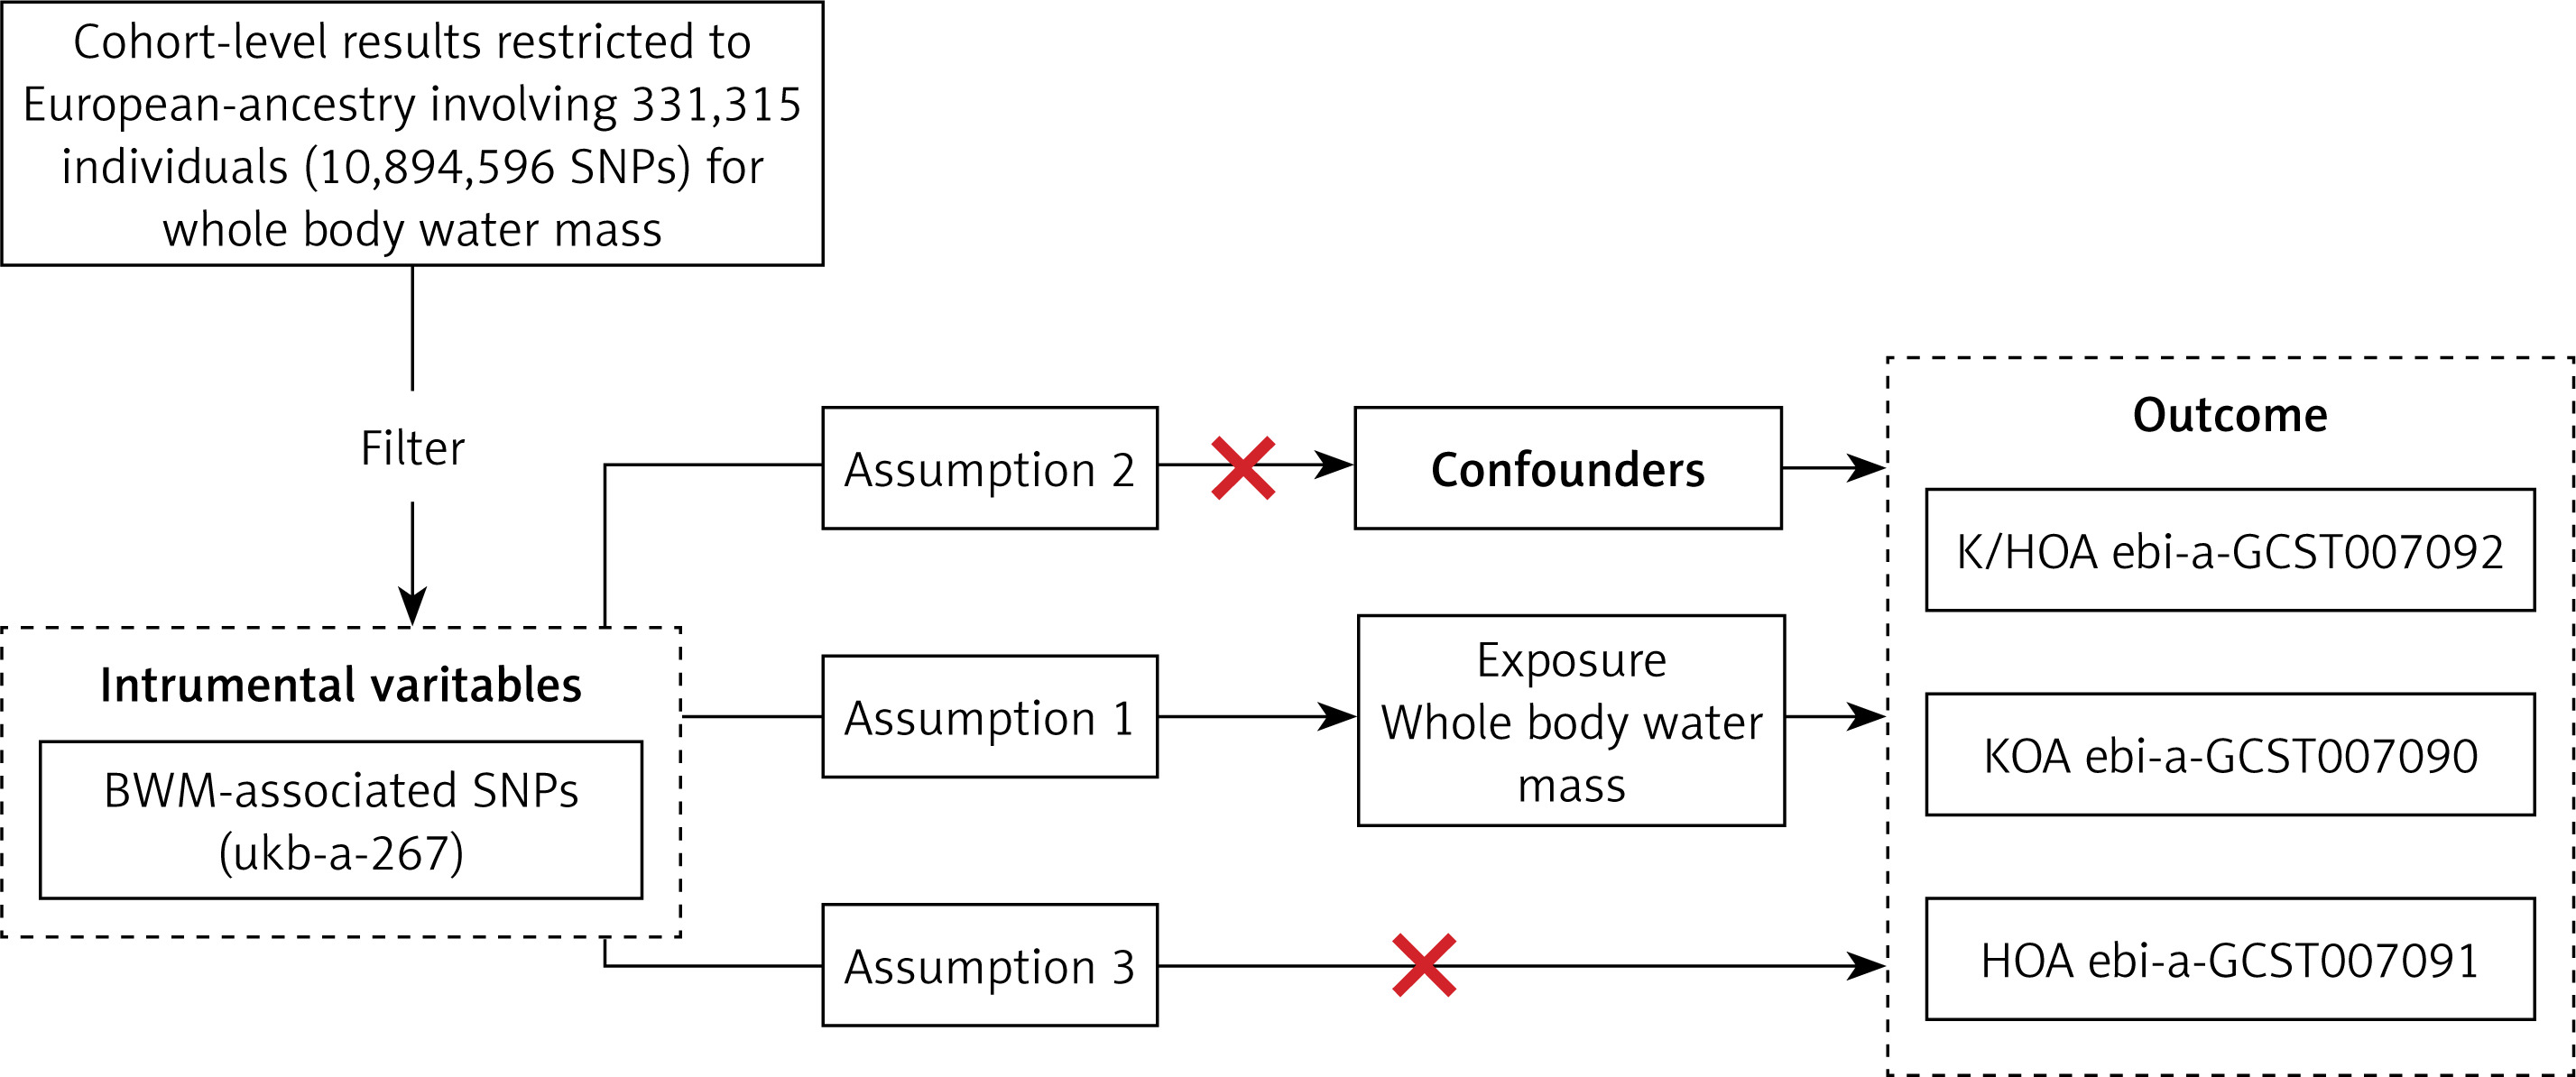
Databases from GWAS, including GWAS Catalog, Integrative Epidemiology Unit (IEU) open GWAS, and NealE Lab, were searched, and eligible datasets were extracted [14]. Since all data used were already in the public domain, no additional ethical approval was required. The study population’s genetic background was limited to individuals of European ancestry to minimize potential bias from ethnically related confounding factors. The BWM-related GWAS data (ukb-a-267) were sourced from Neale Lab (http://www.nealelab.is/). Neale Lab conducted a GWAS analysis involving thousands of human characteristics in 331 315 unrelated European individuals using data from the UKB (http://www.nealelab.is/uk-biobank). Participant BWM was assessed using impedance technique and recorded in kilograms, with a precision of 0.1 kg. This study utilized OA data from three sources: knee and hip osteoarthritis (K/HOA), KOA, and HOA, all derived from the IEU GWAS database (https://gwas.mrcieu.ac.uk). The sample sizes for K/HOA (ebi-a-GCST007092), KOA (ebi-a-GCST007090), and HOA (ebi-a-GCST007091) are 417 596, 403 124, and 393 873, with SNP counts of 30 265 359, 29 999 696 and 29 771 219. It is important to note that all the above GWAS data are derived from European populations (Supplementary Table SI).
Instrumental variable selection
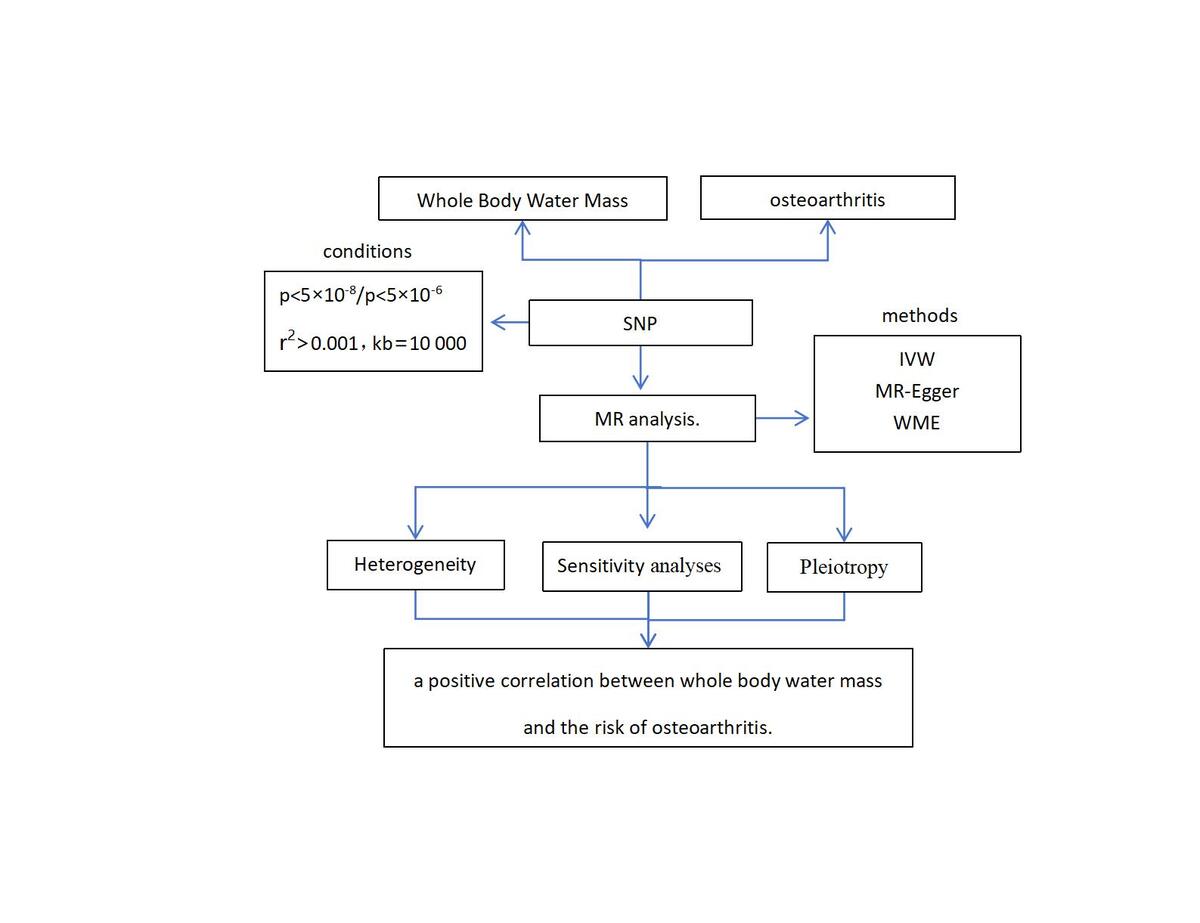
To ensure effective IVs, the three basic model assumptions of MR analysis should be met. First, we established uniform filtering criteria (p < 5 × 10⁻⁸) for the instrumental variables to ensure statistical significance. For each corresponding SNP of each instrumental variable, we conducted a linkage disequilibrium analysis, considering the linkage disequilibrium correlation coefficient (r2 < 0.001) and base pair distance between the two SNPs (kb > 10,000) [15]. Then, among the selected instrumental SNPs, we excluded those with intermediate allele frequencies, palindrome SNPs, and incompatible SNPs. We summarized and examined the p-values in the data, eliminating SNPs highly correlated with OA [16]. Confounder-related SNPs refer to SNPs that are related to the outcome (OA in our study) or its risk factors except the selected exposure (BWM in our study). In this study, we retrieved previously published OA-related MR studies from PubMed and identified risk factors causally associated with OA. These risk factors might be the potential confounding factors of this MR study. Therefore, we further conducted a comprehensive search in the GWAS Catalog for whether any SNP in this study was associated with these confounders. These factors include BMI [17] or obesity or fat mass, bone density [18], smoking [19], alcohol consumption [20], and coffee intake [21]. If any instrumental variables associated with potential confounding factors were observed, they were manually discarded, and MR analysis was recomputed to validate the consistency of the results. Finally, to ensure the robustness of our analysis, we set a stringent threshold for statistical strength, with F > 10 as the criterion for strong correlation, minimizing the potential for weak instrument bias [22]. The F-statistic was calculated utilizing the following formula:
R2 is the proportion of variability in the exposure explained by the IVs, k represents the number of IVs (6) used in the model, and n represents the sample size.
MR analysis method
In this study, we employed a two-sample MR approach to assess the causal relationship between BWM and the risk of OA. MR analysis is predicated on three key assumptions [13]: (1) SNPs are strongly associated with the exposure (BWM); (2) there is no association between SNPs and confounding factors; (3) SNPs can only affect the outcome (OA) through the exposure (BWM), i.e., there is no gene pleiotropy (Figure 1).
Figure 1
Schematic representation of the MR study
SNPs – single-nucleotide polymorphisms, K/HOA – knee and hip osteoarthritis, KOA – knee osteoarthritis, HOA – hip osteoarthritis.
We conducted three primary methods in a two-sample MR analysis, namely the inverse variance weighted method (IVW), weighted median estimation (WME), and MR-Egger regression. We used the IVW method as the primary estimate. The WME estimator provides a robust result, requiring that at least half of the SNPs used in the analysis are valid [23]. In addition, we also applied other MR estimates, including simple mode and weighted mode, as complementary tools to explore the causality.
Statistical analysis
To meet MR assumptions, we conducted multiple sensitivity analyses to assess heterogeneity and pleiotropy within the genetic instruments. Pleiotropy refers to a locus affecting multiple phenotypes, and a genetic variant is associated with more than one phenotype, which is a violation of MR assumption 3. We applied MR-PRESSO and MR-Egger regression tests to monitor the potential horizontal pleiotropy effect. For each SNP, the MR-PRESSO outlier test calculated a p-value for its pleiotropy significance, whereas the MR-PRESSO global test calculated a p-value for overall horizontal pleiotropy [24]. The MR-Egger regression model provided a relatively robust estimate independent of IV validity and an adjusted result by existing horizontal pleiotropy via the regression slope and intercept [25]. The list of SNPs remaining after removing pleiotropic SNPs was used for the subsequent MR analysis. The asymmetry of the funnel plot can also be considered an indicator of horizontal pleiotropy [26]. To find heterogeneity, we employed the IVW approach and MR-Egger regression; the heterogeneities were quantified by Cochran’s Q statistic [27]. Finally, several sensitivity analyses, such as leave-one-out analysis, were applied to identify whether a single SNP influenced the main causal relationship [28].
All two-sample MR analyses and related sensitivity analyses were conducted using the R package Two Sample MR. MR-PRESSO analysis was performed using the R package MR-PRESSO. All analyses were carried out in R version 4.1.2. P-values < 0.05 were considered statistically significant.
Results
Selection of the tool variables
Following the IV selection criteria in this study, after removing IVs exhibiting linkage disequilibrium, the study incorporated a total of 418 SNPs for K/HOA analysis (p < 5 × 10⁻⁸, R2 < 0.01). Additionally, 61 palindrome SNPs were excluded, along with 118 SNPs associated with outcome-related confounding factors (Supplementary Table SII). Consequently, 239 SNPs were included in the analysis. For KOA, the dataset comprised 418 SNPs after excluding 61 palindrome SNPs, along with 126 SNPs associated with outcome-related confounding factors (Supplementary Table SIII). Consequently, 231 SNPs were included in the analysis. In the case of HOA, a total of 417 SNPs were incorporated after excluding 61 palindrome SNPs. Simultaneously, 121 SNPs linked to outcome-related confounding factors were eliminated (Supplementary Table SIV), leading to the inclusion of 235 SNPs for analysis. Based on the above selection criteria, we included 239, 231 and 235 SNPs for K/HOA, KOA, and HOA, respectively. The F-values of these instrumental variables were all > 10 (ranging from 25.3969 to 94.8889 for K/HOA, 11.7123 to 94.8889 for KOA, and 11.7123 to 94.8889 for HOA), suggesting that there was no weak IV bias (Supplementary Tables SII–SIV).
Causation and effect of exposure (BWM) on outcome (K/HOA)
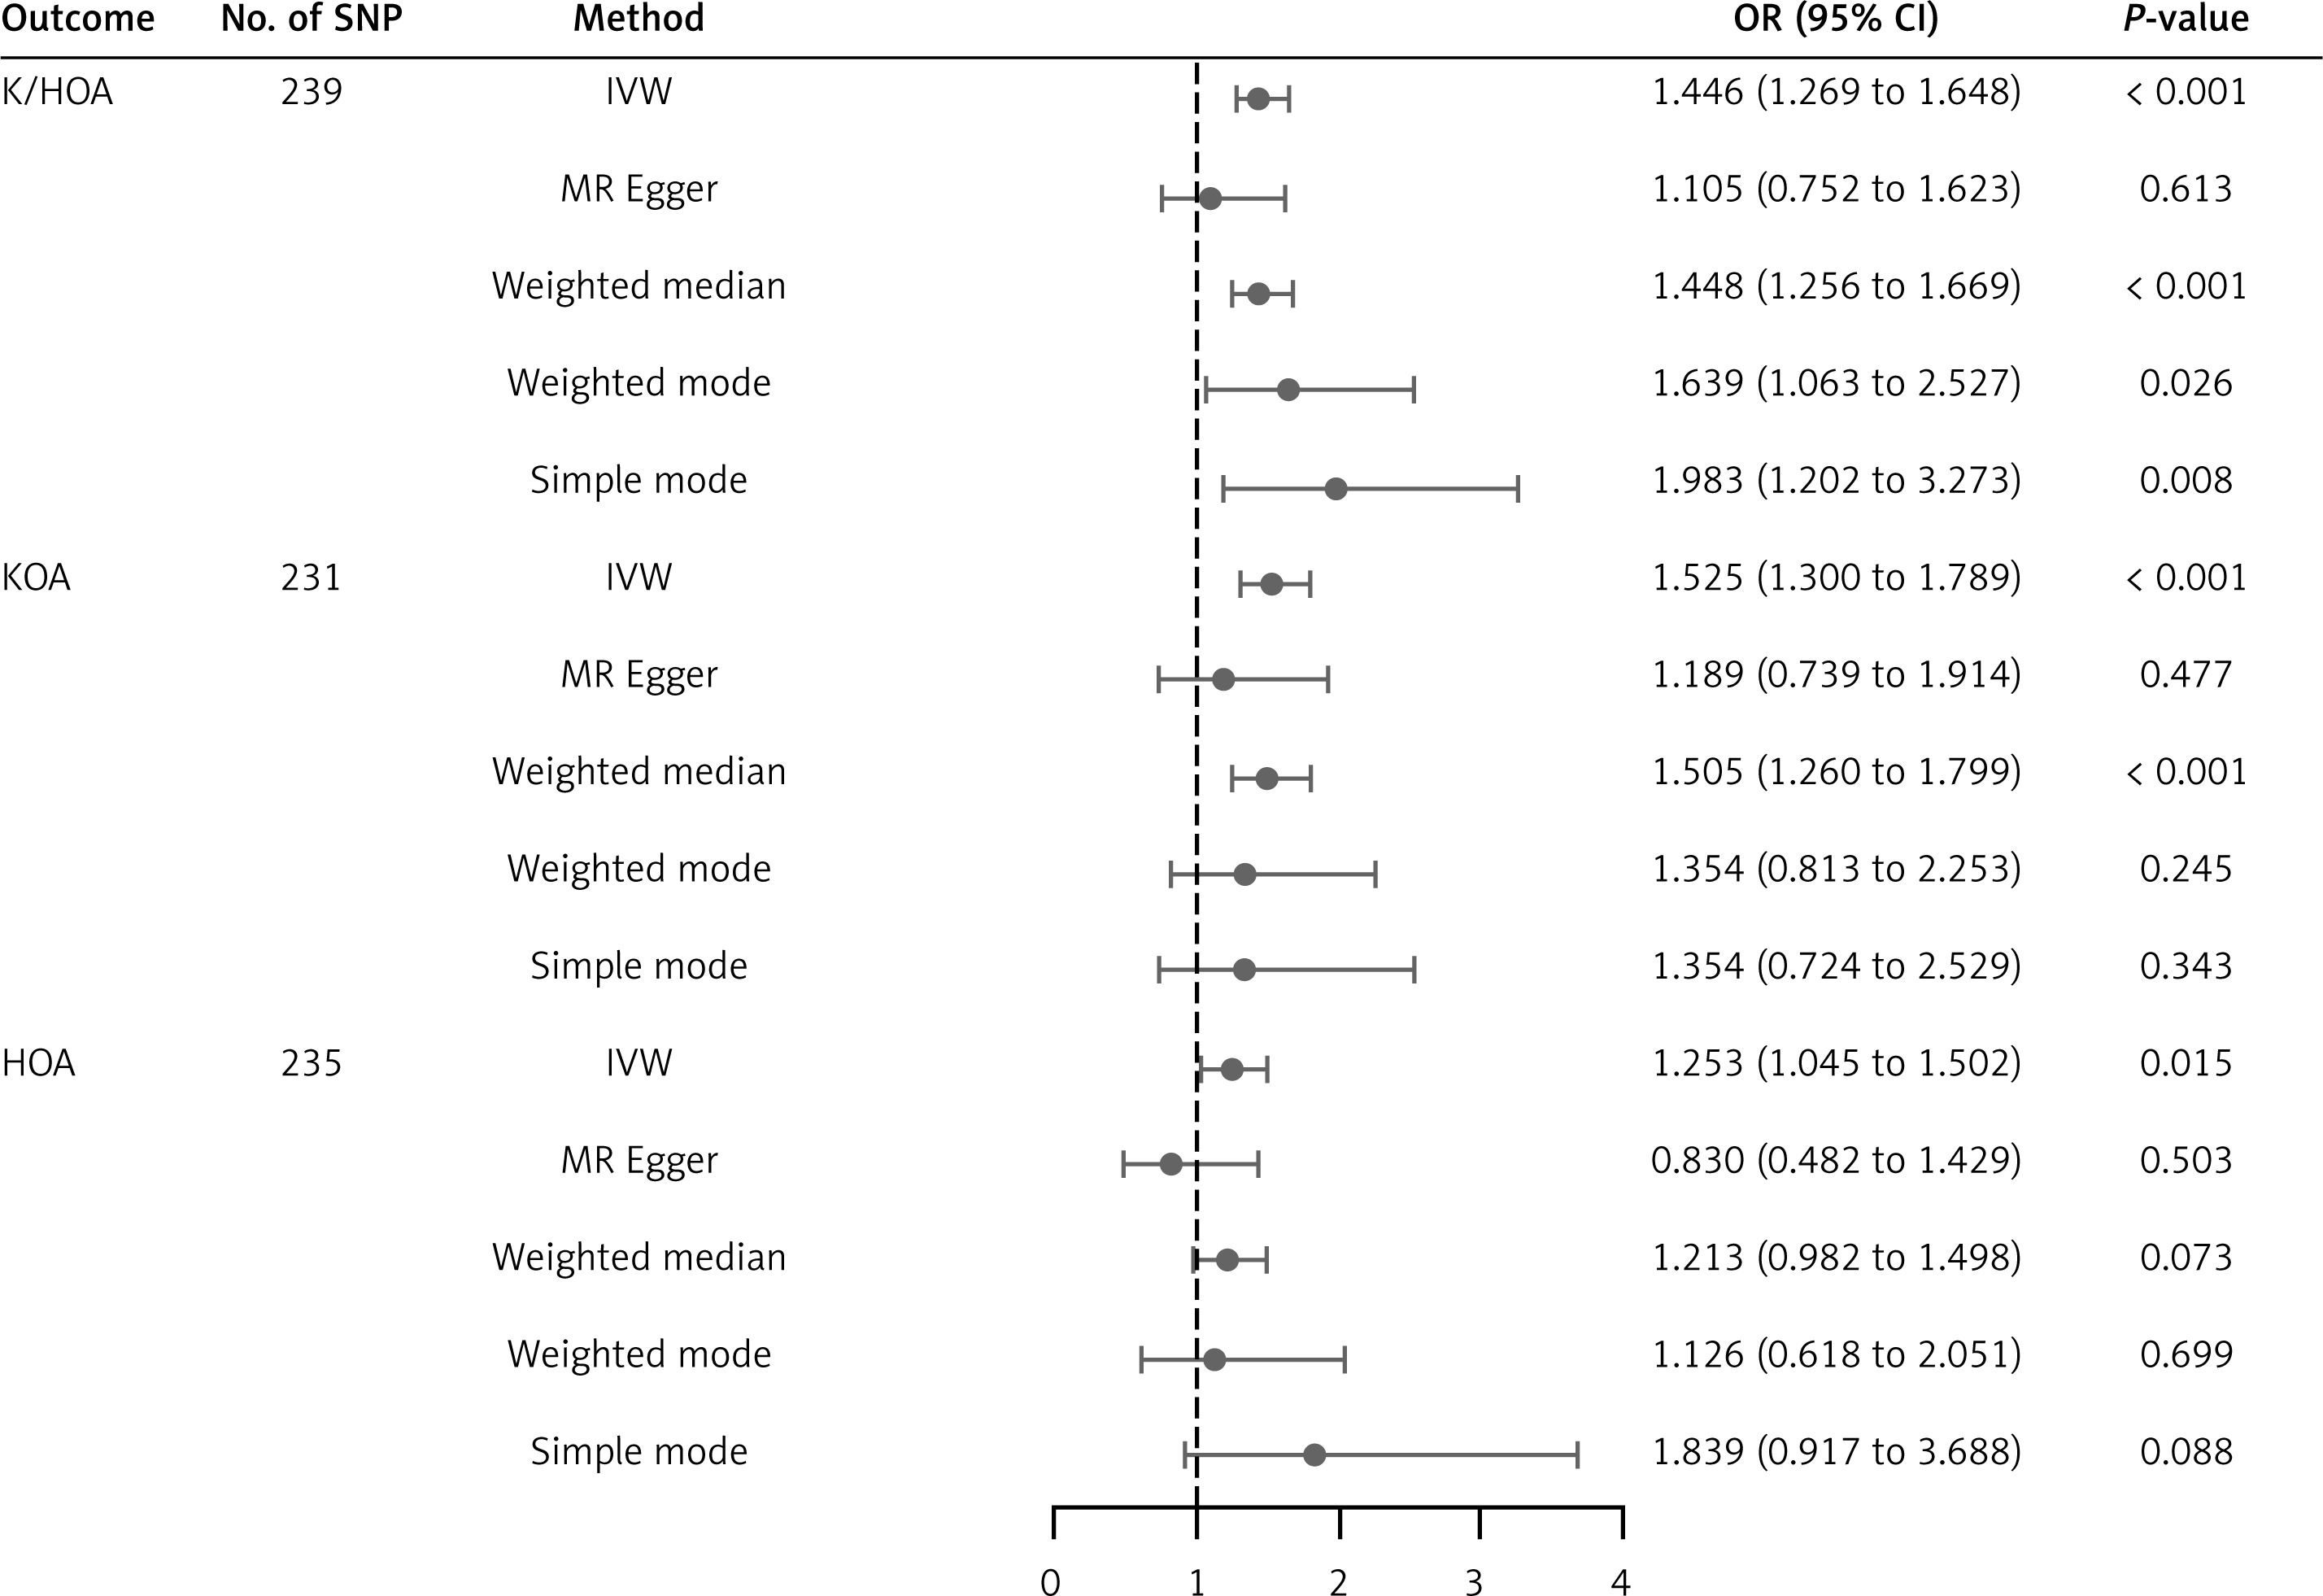
The result of the IVW method suggested that there was a positive association between BWM and higher genetic predictability for the risk of K/HOA (OR = 1.45, 95% CI: 1.27–1.65, p = 3.24 × 10⁻⁸). The WME, weighted mode and simple mode methods showed consistent results (WME: OR = 1.45, 95% CI: 1.26–1.67, p = 3.38 × 10⁻⁷; weighted mode: OR = 1.64, 95% CI: 1.06–2.53, p = 2.62 × 10⁻²; simple mode method: OR = 1.98, 95% CI: 1.20–3.27, p = 7.87 × 10⁻³). However, the MR-Egger method did not show a significant association between BWM and K/HOA (OR = 1.10, 95% CI: 0.75–1.62, p = 0.613). Because the IVW method has higher accuracy than the MR-Egger method and is consistent with WME estimates, we conclude that BWM has a positive causal effect on total osteoarthritis (Supplementary Table SV, Figure 2).
Figure 2
Forest plots of Mendelian randomization analyses of the causal effects of BWM on OA at various anatomical locations before MR-PRESSO
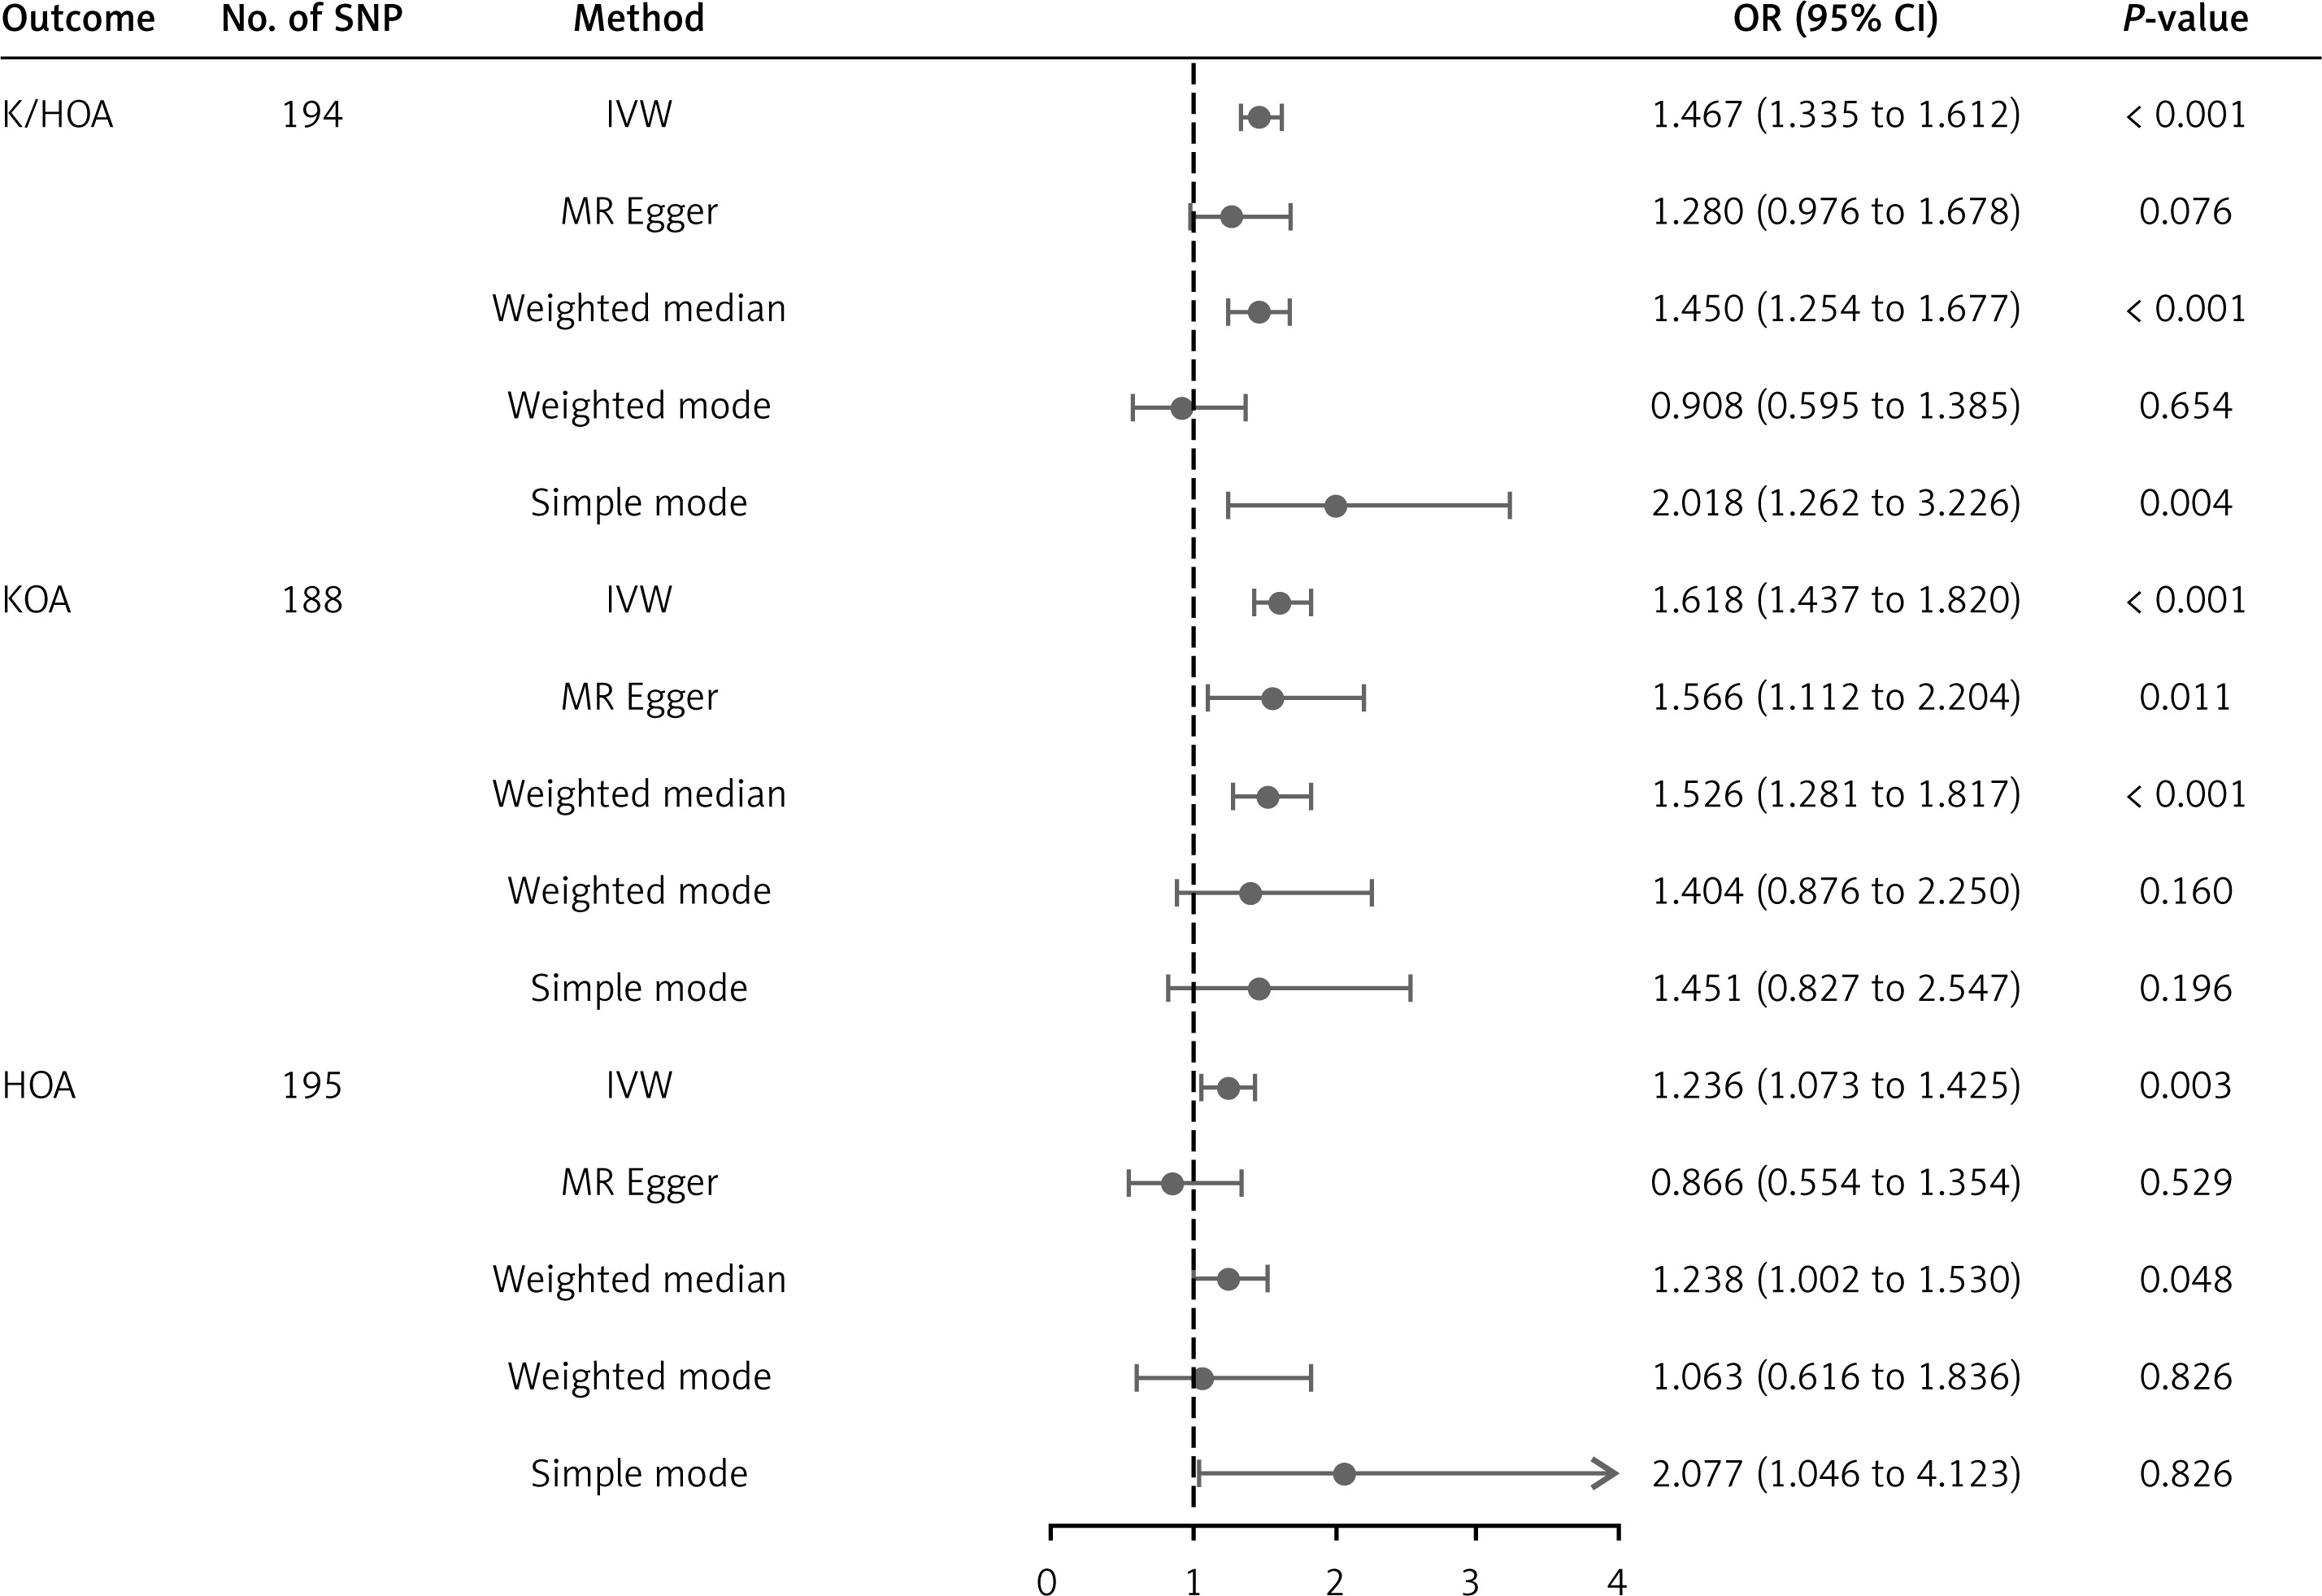
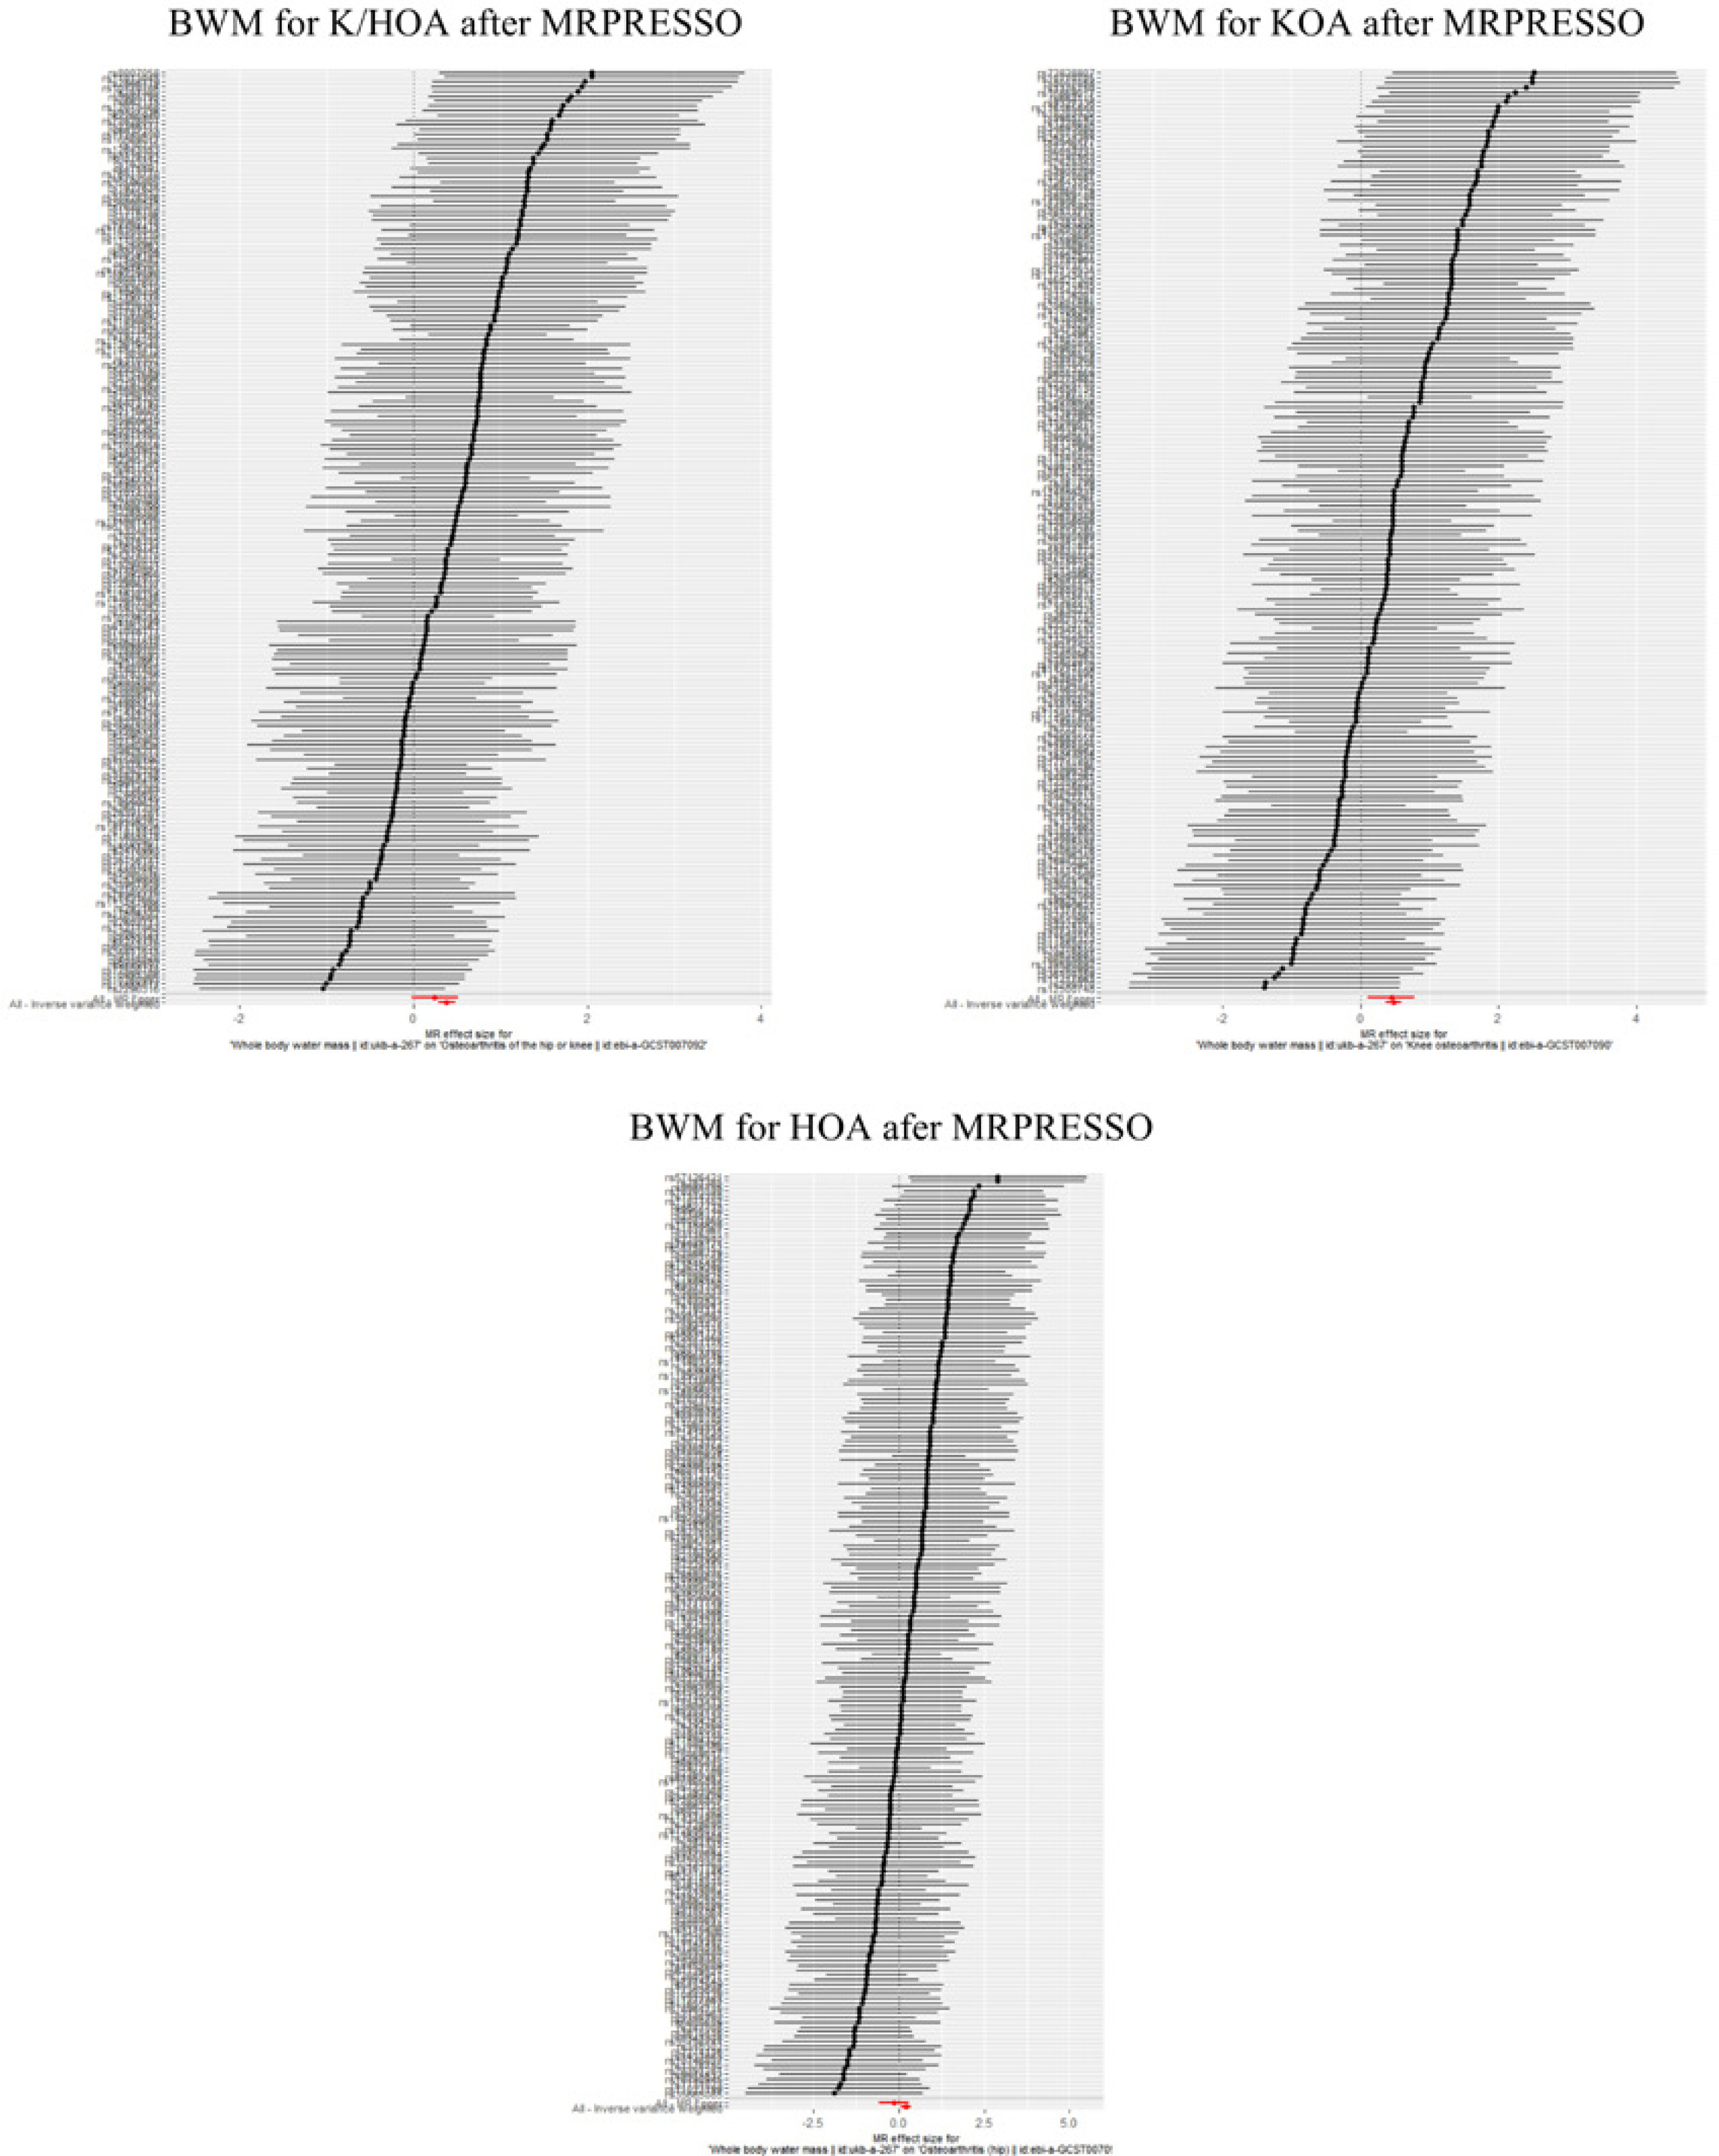
In this study, there was no indication of pleiotropy using the intercept derived from the MR-Egger regression (Egger intercept = 0.004, p = 0.15) (Supplementary Table SVI). After the removal of 45 distorted outliers (Supplementary Table SVII), the MR-PRESSO global test was utilized to test for horizontal pleiotropy (p < 0.05), indicating no significant directional horizontal pleiotropy (Supplementary Table SVI). In addition, the results of Cochran’s Q test revealed no significant heterogeneity (MR-Egger: Q value = 197.41, p = 0.36; IVW: Q value = 198.56, p = 0.36) (Supplementary Table SVIII). With the removal of these genetic variants, the IVW analysis was finally performed (OR = 1.47, 95% CI: 1.33–1.61, p = 1.74 × 10⁻¹⁵), and the correlation remained significant (Supplementary Table SIX, Figure 3). Scatter plots and funnel plots for K/HOA are presented in Supplementary Figures S1–S4, showing a comparison before and after MR-PRESSO analysis. Leave-one-out analysis (Figure 4 and Supplementary Figures S5) did not reveal any individual SNPs altering the overall impact of BWM on K/HOA.
Causation and effect of exposure (BWM) on outcome (KOA)
The result of the IVW method suggested that there was a positive association between BWM and higher genetic predictability for the risk of KOA (OR = 1.53, 95% CI: 1.30–1.79, p = 2.18 × 10⁻⁷). The WME showed consistent results (OR = 1.51, 95% CI: 1.26–1.79, p = 6.89 × 10⁻⁶). However, the MR-Egger method, simple mode and weighted mode did not show a significant link between BWM and KOA (MR-Egger: OR = 1.19, 95% CI: 0.74–1.91, p = 4.77 × 10⁻¹; OR = 1.35, 95% CI: 0.72–2.53, p = 3.43 × 10⁻¹; weighted mode: (OR = 1.35, 95% CI: 0.81–2.25, p = 2.45 × 10⁻¹). Because the IVW method has higher accuracy than the MR-Egger method and is consistent with WME estimates, we conclude that BWM has a positive causal effect on KOA (Supplementary Table SV, Figure 2).
In this study, there was no indication of pleiotropy using the intercept derived from the MR-Egger regression (Egger intercept = 0.004, p = 0.23) (Supplementary Table SVI). Subsequent analysis using the MR-PRESSO method identified and removed potential outliers, eliminating 43 outliers (Supplementary Table SX). Post-outlier removal analysis using MR-PRESSO showed a significant correlation (p = 0.38), as presented in Supplementary Table SVI. These results indicated the absence of horizontal pleiotropy and potential causal effect violations in the instrumental variables (p > 0.05). In addition, the results of Cochran’s Q test revealed no significant heterogeneity (MR-Egger: Q value = 192.87, p = 0.33; IVW: Q value = 192.91, p = 0.35) (Supplementary Table SVIII). With the removal of these genetic variants, the IVW analysis was finally performed (OR = 1.62, 95% CI: 1.44–1.82, p = 1.41 × 10⁻¹⁵), and the correlation remained significant (Supplementary Table SIX, Figure 3). Scatter plots and funnel plots for KOA are presented in Supplementary Figures S1–S4, showing a comparison before and after MR-PRESSO analysis. Leave-one-out analysis (Figure 4 and Supplementary Figures S5) did not reveal any individual SNPs altering the overall impact of BWM on KOA.
Causation and effect of exposure (BWM) on outcome (HOA)
The IVW results showed that the per unit increase in the log odds of having BWM was significantly associated with an increased risk of having HOA at p < 0.05 (OR = 1.25, 95% CI: 1.04–1.50, p = 0.02), while the MR-Egger, WME, weighted mode and simple mode did not reveal a significant association between BWM and HOA (MR-Egger: OR = 0.83, 95% CI: 0.48–1.43, p = 0.50; WME: OR = 1.21, 95% CI: 0.98–1.50, p = 0.07; weighted mode: OR = 1.13, 95% CI: 0.61–2.05, p = 0.70; simple mode: OR = 1.84, 95% CI: 0.91–3.69, p = 0.09) (Supplementary Table SV, Figure 2). Because the IVW method has higher accuracy than the MR-Egger method [29], we conclude that BWM has a positive causal effect on HOA.
In this study, there was no indication of pleiotropy using the intercept derived from the MR-Egger regression (Egger intercept = 0.006, p = 0.12) (Supplementary Table SVI). After the removal of 39 distorted outliers (Supplementary Table SXI), post-outlier removal analysis using MR-PRESSO showed a significant correlation (p = 0.94), indicating no significant directional horizontal pleiotropy (Supplementary Table SVI). In addition, the results of Cochran’s Q test revealed no significant heterogeneity (MR-Egger: Q value = 164.76, p = 0.94; IVW: Q value = 162.06, p = 0.95) (Supplementary Table SVIII). With the removal of these genetic variants, the IVW analysis was finally performed (OR = 1.24, 95% CI: 1.07–1.42, p = 0.003), and the correlation remained significant (Supplementary Table SIX, Figure 3). Scatter plots and funnel plots for HOA are presented in Supplementary Figures S1–S4, showing a comparison before and after MR-PRESSO analysis. Leave-one-out analysis (Figure 4 and Supplementary Figures S5) did not reveal any individual SNPs altering the overall impact of BWM on HOA.
Discussion
This study aimed to investigate the relationship between BWM and the risk of OA through a two-sample MR study based on GWAS. The primary method employed was the IVW approach, which revealed a significant association between genetically increased BWM and OA in K/HOA, KOA, and HOA (OR = 1.45, 95% CI: 1.27–1.65, p = 3.24 × 10⁻⁸; OR = 1.53, 95% CI: 1.30–1.79, p = 2.18 × 10⁻⁷; OR = 1.25, 95% CI: 1.04–1.50, p = 0.02) (Supplementary Table SV). These results suggest a causal relationship between BWM and an increased risk of OA.
As the prevalence of OA continues to rise, understanding various risk factors for OA becomes crucial. This study provides evidence that higher genetic susceptibility to elevated BWM may contribute to OA onset. Utilizing the MR framework and employing five MR models (IVW, MR-Egger, weighted median, weighted mode, and simple mode), the study consistently estimated causal relationships, thereby corroborating the main MR findings. The analysis of SNP data related to BWM and OA always indicated a positive correlation, suggesting that increasing BWM is associated with an elevated risk of OA. Water distribution within the body consists of intracellular water (ICW) and extracellular water (ECW), including plasma and tissue fluid. Water flows according to changes in extracellular fluid osmotic pressure [9]. The ECW/ICW ratio is a recognized biomarker for muscle mass [30]. Studies have shown that knee OA patients have higher ECW/ICW ratios than healthy individuals [31]. Muscle dysfunction in the thigh is a well-established risk factor for knee OA and functional loss [32]. Higher ECW/ICW ratios are associated with deterioration in the quadriceps femoris muscle in knee OA patients, leading to functional impairment, and elevated ECW/ICW ratios are related to worse knee joint scores [30, 33]. Skeletal muscle contains a substantial amount of water, and a higher ECW/ICW ratio indicates a higher level of non-contractile tissue relative to strength [34, 35]. Therefore, monitoring the expansion of extracellular water content within the skeletal muscle is essential for evaluating muscle degradation in OA patients. Joint effusion is a significant finding in OA, associated with pain signaling, disease activity, and prognosis [36, 37]. Studies have demonstrated that bone marrow edema is related to pain in knee OA, and there is a dose-response relationship, with more pain accompanying more extensive edema [38]. The study indicates that bone marrow edema is a significant factor causing pain in OA patients. The extracellular matrix of cartilage contains approximately 70–80% water, and the pathological result of joint fluid entering the medullary cavity due to cartilage injury is local edema [39]. With the volume of the medullary cavity remaining constant, the increased content (local exudate, tissue fluid accumulation) leads to higher local bone pressure, resulting in severe local joint pain [40]. This suggests that as the area of bone marrow edema increases, joint pain becomes more powerful. The research indicates that in early OA canine models induced by anterior cruciate ligament (ACL) transection, although histological changes are minimal, an increase in water content in the superficial zone is observed as early as 3 weeks after surgery [41]. Additionally, clinical studies have also found a 10–15% increase in water content in the cartilage of osteoarthritic human joints compared to healthy controls [42]. Therefore, it is necessary to predict the prognosis of patients with KOA by means of BWM to provide clinical value. Additional studies are needed to elucidate the biological mechanisms linking BWM and KOA.
This MR study is the first to assess the causal relationship between BWM and OA, providing evidence for a causal link between genetically determined BWM and OA risk. These findings may have a positive impact on OA prevention, diagnosis, and treatment strategies. MR analysis offers advantages over observational studies, as it helps avoid reverse causation and confounding factors while saving time and resources. However, certain aspects of this analysis could be improved: Firstly, the study focused on European populations, limiting the generalizability of the results to other ethnic groups. Secondly, despite excluding several common confounders in sensitivity analysis, unidentified potential confounders may still exist. Thirdly, this study only analyzed the causal effect of BWM on OA risk, and further research is needed to explore the mechanisms underlying the impact of BWM on OA risk. Finally, being the first study to assess the relationship between BWM and OA, there may be limitations on the conclusions that can be drawn, and future research is encouraged to explore this subject in greater depth.
In conclusion, this study investigated the relationship between BWM and OA, identifying a strong association between the quantity of BWM and the onset of OA. The pivotal finding of the study was a significant positive correlation between BWM and OA, having substantial implications for clinical application. Monitoring and regulating fluid levels in this demographic may emerge as a key strategy in OA prevention, thereby enhancing the quality of life for individuals affected by this condition.