Mild cognitive impairment (MCI) is defined as a condition characterized by subjective memory disorder; memory deficit documented by cognitive tests; normal ability in daily activities; and absence of dementia. The construct of MCI is included in the new diagnostic criteria for dementia by the National Institute of Aging (NIA) [1].
Depression in the elderly often mimics a cognitive impairment. Mild cognitive deficits in memory, processing speed and executive functioning are particularly common in late-life depression [2]. Major depressive disorder in the elderly may even be associated with structural and functional abnormalities in the frontal lobes and their connections with limbic and striatal systems [3].
A significant association was observed between an abnormal position emission tomography/Computed tomography (PET/CT) scan with fluorodeoxy-glucose (FDG-PET/CT) and depressive and anxiety symptoms. Moreover the presence of regional glucose hypometabolism and depression showed a more than threefold increased risk of incident MCI as compared to the reference group [4–6]. The hypothesis underlying the study is that different patterns of metabolic alterations in MCI are influenced by the co-occurrence of depression and/or the evolution to dementia.
Methods
A retrospective analysis was performed on 69 consecutive subjects with amnesic MCI who underwent FDG-PET/CT to ascertain the presence and distribution of any metabolic alterations, in the period between January 2016 and December 2020 at the Alzheimer’s Unit of Circolo Hospital of Varese; 11 additional patients were not considered because they refused to complete the standard diagnostic work-up or were lost to follow-up.
The diagnosis of amnesic MCI was made in accordance with acknowledged criteria [1], and included the absence of comorbidities possibly affecting the cognitive functions or significant psychiatric disorders, a normal neurological examination, a Mini Mental State Examination (MMSE) score ≥ 27, a Clinical Dementia Rating scale (CDR) score of 0.5 in the memory sub-item, and normal ability in daily activities on the ADL-IADL scales. The presence of depressive symptoms was identified by a score > to 5 on the Geriatric Depression Scale – GDS-15 [7–9].
A brain CT or magnetic resonance imaging (MRI) had to rule out the presence of focal abnormalities responsible for the occurrence of memory deficits, or for secondary forms of dementia.
The subjects included in the study were followed up yearly and checked for the possible evolution to Alzheimer’s disease (AD); the mean observation time of the entire case series was 24.1 months (range: 12–48 months).
Written informed consent was acquired for the execution of imaging examinations.
FDG-PET/CT
3.3 MBq/kg of 18FDG were injected intravenously to all patients, fasting for 6 h, followed by an uptake period of 45 min. The scan time was 10 min. PET images were reconstructed with an algorithm comprehensive of CT based attenuation correction and a manual reorientation based on a transverse slicing along the bicommissural plane. Semi-quantitative analysis was performed using automated software based on the computation of normalized-ROI uptake ratios standard deviation (SUVr SD) using as a reference database a healthy, sex- and age-matched control group (Siemens Scenium).
Statistical analysis
The normal distribution of all the variables was checked by the Kolmogorov-Smirnov test.
The mean values of SUVr SD from different brain regions were compared by multivariate analyses of variance by considering two 2-level factors (evolution to dementia; presence of depression) and their interaction. In a given subject, a SUVr SD value from a given brain area of less than – 2.5 was rated as abnormal. For each brain area, we evaluated by chi-square test the association of abnormal SUVr SD values in different groups of subjects: not evolved/not depressed, not evolved/depressed; evolved/not depressed, evolved/depressed. In all cases, the chosen level of significance was p = 0.05 (SPSS).
Results
We considered 69 patients with amnesic MCI: their mean age was 73.46 ±6.77 years (range: 56–88), the M/F distribution was 30/39 (43% and 57% respectively), and the mean years of education: 9.1 ±3.6 (range: 3–17).
The onset of memory disturbance ranged from 6 to 12 months before our first clinical examination.
The presence of mild-to-moderate depressive symptoms was detectable in 23/69 patients (33.3%) (GDS score 7.3 ±1.1 vs. 1.17 ±1.3).
Subjects without and with depressive symptoms did not differ in terms of age (73.92 vs. 74.35 years; p = 0.44) and level of education (8.91 vs. 9.43 years; p = 0.57), but they did in terms of gender (26.1% in the male group vs 47.8% in the female group, p = 0.03).
We detected the evolution to dementia of Alzheimer type (CDR 1) in 37/69 cases (53.6%).The mean time to evolution was 24 ±1.91 months (range: 12–48). The evolution to dementia occurred in 59.5% of not depressed and in 40.5% of depressed patients, but these figures did not prove to be statistically significant (Fisher’s exact test p = 0.13).
The subjects who converted to dementia did not differ in years of education (8.75 vs. 9.46 years; p = 0.42) or male/female distribution, which was the same in evolved and not-evolved patients (21/18 vs. 16/14, p = 0.58), but they were slightly older than those who did not convert (75.8 vs. 71.6 years; p = 0.03).
All patients, after neuropsychological evaluation and imaging investigations, underwent FDG-PET/CT.
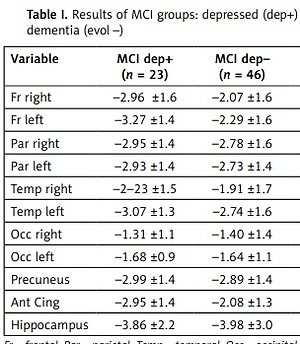
The effects of the evolution and of the depression factors and of their interactions on mean SUVr SD from different brain regions are reported in Table I.
Table I
Results of MCI groups: depressed (dep+) vs. not depressed (dep–) and evolved (evol+) vs. non-evolved to dementia (evol –)
The evolution factor proved to be significant, or showed a borderline significance value, for the following brain regions: parietal and temporal lobes bilaterally, precuneus. Invariably the SUVr SD values were lower in the converted than in the not-converted groups.
The patients suffering from depression showed significantly lower SUVr SD values in both the frontal lobes and in the anterior cingulate cortex.
The interaction between evolution and depression factors was never significant for all the SUVr SD; namely, the effects of these factors did not influence each other.
We performed two additional multivariate analyses of variance in which we considered age and years of education as covariates, but the covariates did not show a significant effect and the results reported above were the same.
We also compared the occurrence of subjects with abnormal SUVr SD values, which proved to be larger in the evolved/depressed groups in the left frontal lobe and in the evolved groups (regardless the co-occurrence of depression) groups in the left parietal lobe in the precuneus (Table II).
Table II
Percentage of abnormal SUVr values in different brain areas in MCI patients depending on the occurrence of evolution to dementia (– no, + yes) and of depression (– no, + yes)
The time to evolution did not correlate with the SUVr SD in any of the areas that we considered, and the mean time to evolution did not depend on whether a given area showed an SUVr SD value below the normal limits.
Discussion
Neuropsychiatric disturbances are common in MCI. Previous studies showed that MCI patients with behavioral and psychiatric symptoms had a faster evolution rate to dementia [10, 11]. In a systematic review of 57 studies that enrolled 20 892 people with MCI, the overall prevalence of depression was calculated to be 32% [12]. Our results, where depressive symptoms were present in 35% of the case series, are therefore comparable to the literature data.
The relationship between depression and cognitive impairment, and the etiopathogenetic mechanisms to explain this relationship, are not always clear, since they probably reflect a complex interaction between biological and psychosocial factors.
In MCI we considered depression and cognitive impairment progression, and we found limited overlap between the metabolic pattern abnormalities shown by FDG-PET/CT associated with the two conditions. More specifically, in depression we detected hypometabolism involving the frontal and anterior cingulate structures, whereas in the subjects who evolved to dementia in the follow-up the abnormal metabolism involved the parietal, temporal and pre-cuneus regions.
Our results confirm the usefulness of FDG-PET/CT in identifying metabolic processes consistent with the evolution to dementia in MCI, but also the presence of specific alterations in subjects with depressive symptoms. The retrospective study design is, in our opinion, the principal limitation of our work. Finally, it is necessary to consider for future studies the presence of immunological factors in depression and the possible interaction with markers of peripheral type [13–15].
Our data confirm that depressive symptoms are frequent within mild cognitive disorder. However, the relationship between depression and dementia is certainly complex and cannot always be explained by a single reason or interpreted with the classic psychiatric grammar.