

Introduction
Cyclophosphamide (CP) is an anticancer and immunosuppressant alkylating agent [1] used in the treatment of metastatic breast cancer and certain types of leukemia [2]. However, several side effects have been reported due to the use of CP. Most reported side effects affecting the urinary system include dysuria, frequency of micturition, urgency, microscopic hematuria, and hemorrhagic cystitis (HC) [3]. Other side effects reported include urinary bladder fibrosis, necrosis, and contracture [4].
One of the most serious and difficult to treat side effects of CP administration is HC, which is characterized by diffuse inflammation and hemorrhage of the bladder mucosa [5]. Different treatments have been tried, such as oral or intravesical pentosane polysulfate [6], cystoProtek treatment [7], and cyclosporine therapy [8], all of which had several side effects. However, researchers still need to discover natural agents that could ameliorate CP-induced oxidative injury of the urinary bladder [9].
The anti-inflammatory [10, 11], antioxidant [10], antiapoptotic [12], and anticancer activity [12, 13] pharmacological properties of TQ have been investigated. The radical scavenging properties of TQ against oxidative damage produced by a variety of agents have also been investigated [14].
The aim of this study was to determine whether TQ had a protective effect against CP-induced oxidative injury in the rat urinary bladder.
Material and methods
Design of the study
Sixty male adult albino rats weighing 150–160 g were housed in the animal house at the Faculty of Medicine, Cairo University in Cairo, Egypt. Rats were allowed ad libitum food and water during the study. The study protocol was approved by the animal care and local ethics committees at the Faculty of Medicine, Cairo University, Cairo, Egypt. All procedures including animal handling, sampling, and euthanasia followed the Guide for the Care and Use of Laboratory Animals, 8th edition (National Research Council 2011). Rats were acclimatized in their metal cages for 1 week before the start of the study. Only male rats were used to exclude possible confounding variables related to sex differences.
Rats were divided into 6 equal groups of 10 rats. Group A was a normal control group, and the included rats received no medications. Group B1 was a TQ-treated group, where 10 mg/kg/day TQ was administered for 10 consecutive days using gastric gavage [12]. Group B2 was also a TQ-treated group with an increased dosage of TQ,100 mg/kg/day, administered for 5 consecutive days using gastric gavage [15]. Thymoquinone (99% 2-isopropyl-5-methyl-1,4-benzoquinone) was obtained from Sigma-Aldrich (St. Louis, MO, USA) as 1 g dissolved in 100 ml of distilled water.
Group C was a CP-treated group. Rats were injected intraperitoneally with 100 mg/kg/day CP for 2 consecutive days [16]. Cyclophosphamide (Endoxan) was obtained from Baxter Oncology GmbH (Westfalen, Germany) as 200 mg dissolved in 20 mL of distilled water.
Group D1 was a CP + TQ-treated group, where 10 mg/kg/day TQ was administered for 10 consecutive days using gastric gavage and 100 mg/kg/day, and CP was injected intraperitoneally for the first 2 days [16] 20 min after the administration of TQ. Group D2 was also a CP + TQ-treated group, where 100 mg/kg/day TQ was administered for 5 consecutive days using gastric gavage and 100 mg/kg/day, and CP was injected intraperitoneally for the first 2 days, 20 min after TQ administration.
Sample preparation for histopathological examination
After 10 days, all rats were euthanized by cervical dislocation and their body weights were measured. Blood samples were collected by cardiac puncture, centrifuged to separate the serum, and then stored at –80°C until further use. Urine was evacuated from the rats’ bladders, and each bladder was dissected. The specimens were washed with normal saline solution, split longitudinally, and fixed in 10% formal saline for 24 h. Specimens were then dehydrated in ascending grades of ethyl alcohol (70%, 90%, and 100%), cleared in xylol for 2 h, and embedded in pure soft paraffin for 3 h at 55°C and in hard paraffin for 1 h at 60°C and paraffin blocks were set. Sections of 5 µm thickness were cut by microtomes and stained with H&E and Masson’s trichrome stains to study the general histological features and pathological changes.
Histopathological examination
The histopathological examination was conducted using Leica Qwin 500 image analysis software (Leica Microsystems Imaging Solutions, Wetzlar, Germany). Images were captured live on the screen from sections under a light microscope (Olympus Bx-40, Olympus Optical, Japan) with an affixed video camera (Panasonic color CCTV camera, Matsushita Communication Industrial, Japan).
For the H&E-stained and the Masson’s trichrome-stained sections, histopathological examination of the urinary bladder architecture was performed. The examined parameters included the epithelial layer, lamina propria, and musculosa. Total objective lens magnification of 100 was used to assess mucosal ulceration. Magnification of 200 was used to assess perivascular cellular infiltration, hemorrhage, epithelial cellular proliferation, and fibrosis. Magnification of 400 was used to assess intermuscular edema, congested blood vessels, and cellular vacuolations.
Grading for the severity of inflammation
Grading of the histopathological findings for the severity of inflammation was reported [17, 18] where absence of edema was reported as (–), mild edema without changes in the width of the submucosa was reported as (+), moderate edema with an increase in the width of the submucosa by less than double (++), and severe edema with an increase in the width of the submucosa by more than double (+++).
Measurement of glutathione reductase (GR) to detect antioxidant capacity preparation of bladder tissue homogenates
Bladder tissue samples were transferred into ice-cold phosphate buffer saline (pH 7.4) then cut into tiny slices with a surgical scalpel. The tissue samples were then suspended in chilled sucrose solution (0.25 M) and blotted on filter paper. Finally, the tissue samples were minced and homogenized in 10% (w/v) ice cold Tris-HCl buffer (5 mmol/l comprising 2 mmol/l ethylenediaminetetraacetic acid at pH 7.4) to release the soluble proteins. Bladder tissue homogenates were centrifuged at 1000 rpm for 10 min at 4°C.
The supernatants were used to determine the oxidant-antioxidant status. Glutathione reductase (GR) concentration, malondialdehyde (MDA) content, and protein carbonylation (PC) were used to measure oxidative stress, and caspase-3 activity was used to measure cell death. Assays, calibrations, and quality controls were performed by calorimetry according to the manufacturer’s instructions. One calibration lot and one reagent lot were used for each tested parameter using a spectrophotometer at different wave lengths (DTN 402, DIALAB Diagnostics, Wiener Neudorf, Austria).
Measurement of glutathione reductase (GR) to detect antioxidant capacity
The glutathione system reflects the antioxidant capacity of the bladder tissues. Assay kits for GR were obtained from Sigma-Aldrich (St. Louis, MO, USA). The glutathione concentration was determined by spectrophotometry using enzymatic reaction. GR was assayed based on the reduction of glutathione (GSSG) by reduced nicotinamide adenine dinucleotide phosphate (NADPH) in the presence of GR. The reduced glutathione (GSH) produced reacted spontaneously with 5,5’-dithiobis-(2-nitrobenzoic acid) (DTNB). The concentration of GR was detected by spectrophotometry at 412 nm, and GR results were expressed as units/ml [18].
Measurement of malondialdehyde (MDA) to detect oxidative damage
MDA reflects oxidative damage to the bladder tissues via lipid peroxidation. MDA is the end product of oxidative damage to polyunsaturated lipids, typically by ROS. Assay kits for MDA were obtained from Sigma-Aldrich (St. Louis, MO, USA). MDA was assayed based on the fact that MDA reacted with thiobarbituric acid (TBA) to form a product whose absorbance is proportional to the concentration of MDA. A red color of MDA was detected by spectrophotometry at 523 nm, and MDA results were expressed as nmol/µl [19].
Measurement of protein carbonylation (PC) to detect oxidative damage
PC is another marker of oxidative damage to the bladder tissues. The concentration of carbonyl groups was measured in oxidatively modified proteins. The PC spectrophotometry assay kit was obtained from Cayman Chemical (Ann Arbor, MI, USA). PC was assayed based on the reaction between 2,4-dinitrophenylhydrazine (2,4-DNPH) and protein carbonyls, creating a Schiff base. The resulting protein-hydrazone produced was quantified and detected by the spectrophotometer at 385 nm. Finally, the protein concentration was obtained by standardizing the carbonyl content and the results were expressed in nmol/ml [20].
Measurement of caspase-3 activity to detect apoptosis
Caspases (cysteine-requiring aspartate protease) are proteases that mediate cell death and are imperative for the apoptotic process. Assay kits for caspase-3 were obtained from Sigma-Aldrich (St. Louis, MO, USA). In this assay, caspase-3 hydrolyzes acetyl-Asp-Glu-ValAsp p-nitroanilide (Ac-DEVD-pNA), which is a peptide substrate, to produce the p-nitroaniline (pNA) moiety. The yellow color of caspase-3 activity was detected by spectrophotometry at 405 nm, and caspase-3 activity was expressed as mU [21].
Statistical analysis
SPSS version 24 (IBM Corporation, Armonk, NY, USA) for Macintosh was used for all analyses. P ≤ 0.05 was considered statistically significant. Means, SD, and medians were calculated for body weight, oxidative stress, and cell death markers: GR, MDA, PC, and caspase-3 activity. The Shapiro-Wilk test was used to test for normality and Levene’s test was used to test for equal variance. As not all treatment groups passed assumption tests for normality and variance, the Kruskal-Wallis test was used to determine whether differences existed between treatment groups for oxidative stress and the cell death marker. If a difference was found, Dunn’s method was used to test for significance between groups. Bonferroni correction for multiple tests was then used to adjust computed significance levels.
Results
Histopathological examination
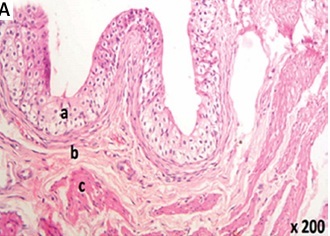
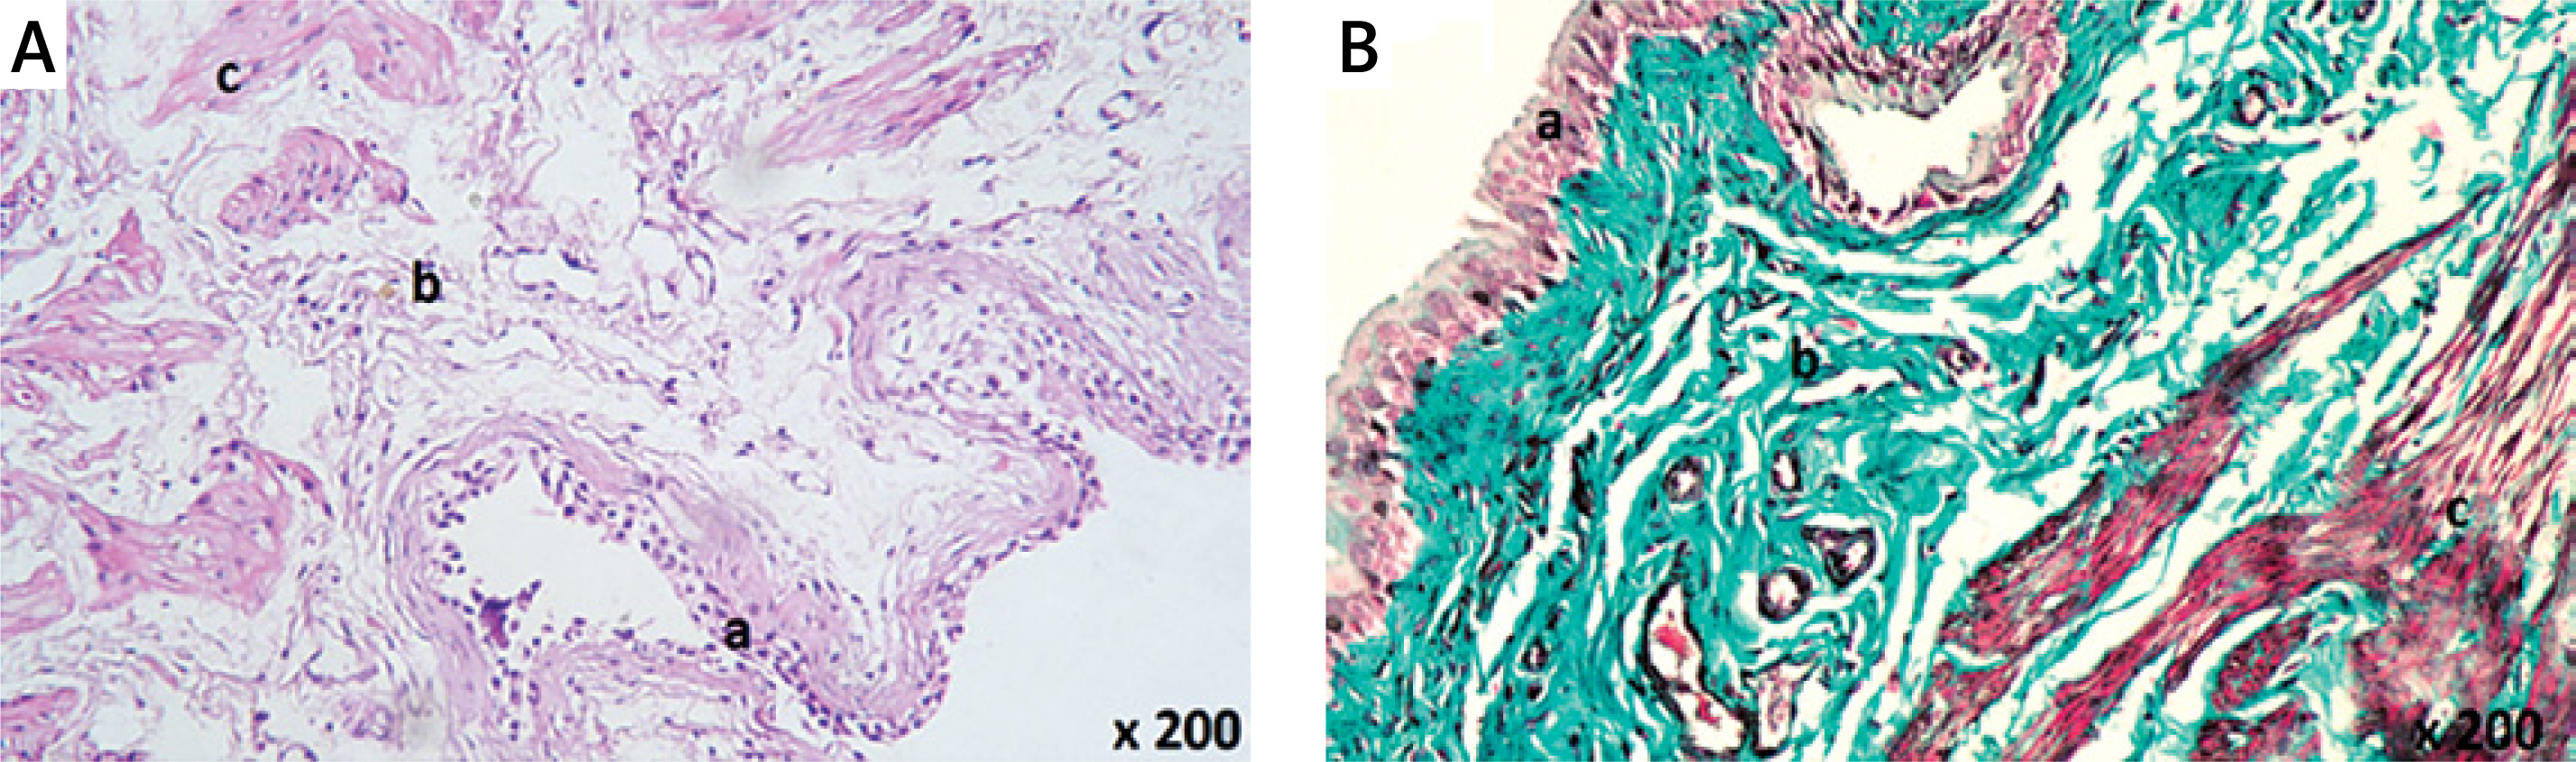
Light microscopic examination of the urinary bladder specimens of groups A (Table I, Figures 1 A, B), B1 (Table I, Figures 1 C, D), and B2 (Table I, Figures 1 E, F) revealed normal histological urinary bladder architecture. Intact transitional epithelium formed a continuous layer lining the bladder wall with a mucin layer composed of proteoglycans on the surface of umbrella cells (Table I, Figures 1 A–F).
Table I
Group comparisons for histopathological examination in urinary bladder rat model
| Outcome variable | Rat study groups | |||||
|---|---|---|---|---|---|---|
| Group A | Group B1 | Group B2 | Group C | Group D1 | Group D2 | |
| Epithelial ulceration | – | – | – | +++ | + | – |
| Hemorrhage | – | – | – | +++ | + | – |
| Cellular infiltration | – | – | – | +++ | ++ | – |
| Edema | – | – | – | +++ | + | – |
| Fibrosis | – | – | – | +++ | ++ | – |
[i] Grading of the histopathological findings was reported according to Ozcan et al. (2005) and Tripathi and Jena (2010); Severe (+++); Moderate (++); Mild (+); and Nil (–). Group A was an untreated control, group B1 was TQ-treated with 10 mg/kg/day TQ for 10 days, group B2 was TQ-treated with 100 mg/kg/day TQ for 5 days, group C was a toxicity control where 100 mg/kg CP was administered for 2 days, group D1was CP + TQ-treated with the same TQ treatment as group B1 and 100 mg/kg CP for 2 days, and group D2 was CP + TQ-treated with the same TQ treatment as group B2 and 100 mg/kg CP for 2 days.
Figure 1
Histological examination of rat urinary bladder for groups A (control), B1 (TQ-treated with 10 mg/kg/day TQ), and B2 (TQ-treated with 100 mg/kg/day TQ) showing intact continuous layer of transitional epithelium that contained no blood vessels or lymphatics and separated from the lamina propria by the basement membrane (a). The lamina propria was composed of areolar connective tissue with normal blood vessels (b). The muscle fibers ran irregularly with normal blood vessels in between (c). A – Group A (H&E 200×). B – Group A (Masson’s trichrome 200×). C – Group B1 (H&E 100×). D – Group B1 (Masson’s trichrome 200×). E – Group B2 (H&E 200×). F – Group B2 (Masson’s trichrome 200×)
H&E – hematoxylin and eosin, TQ – thymoquinone.
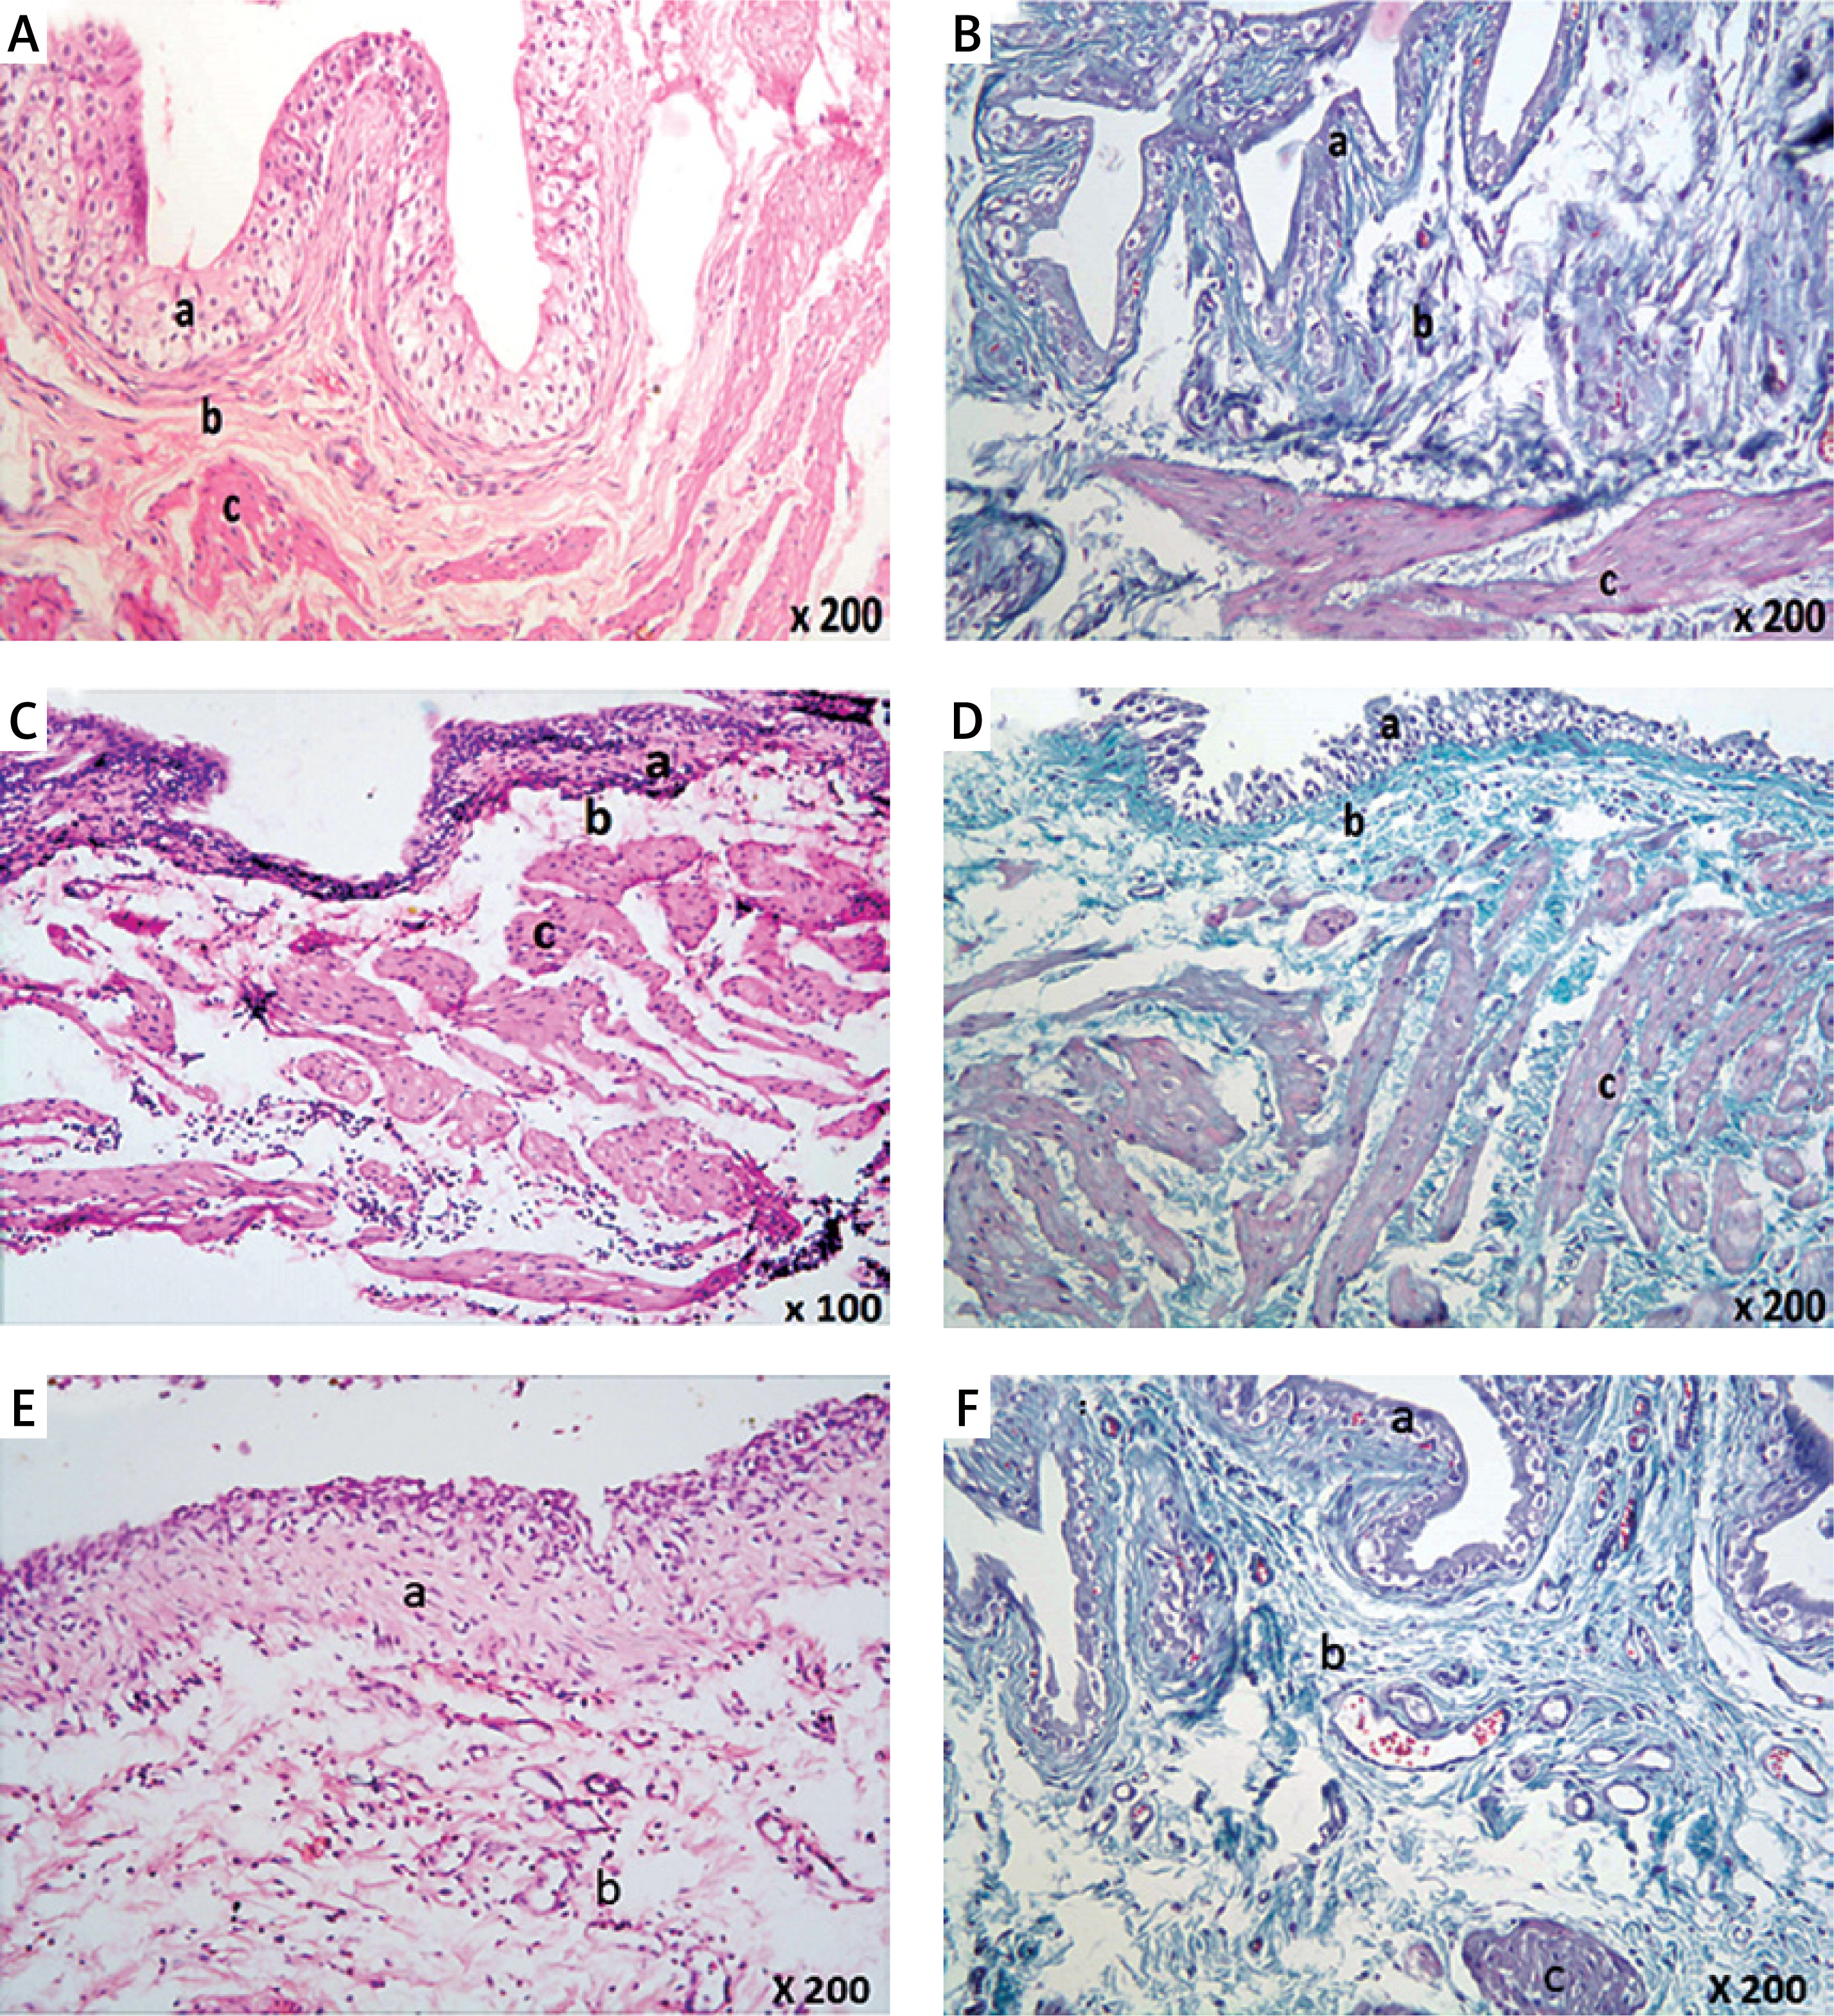
The epithelial layer of groups A, B1, and B2 contained no blood vessels or lymphatics (Figures 1 A–F). The basement membrane separated the epithelium from the lamina propria. The lamina propria was composed of areolar connective tissue and contained normal blood vessels (Figures 1 A–F). The muscle fibers ran irregularly in all directions with normal blood vessels in between (Figures 1 A–D, F).
Examination of the urinary bladder epithelium of group C revealed marked pathological changes in the form of focal ulcerations (Table I, Figure 2 A), desquamated epithelium (Table I, Figure 2 B), nodular proliferation of some epithelial cells (Table I, Figures 2 C, D), and vacuolations of the epithelial cells (Figure 2 E).
Figure 2
Histological examination of rat urinary bladder for group C (CP-treated). A – Showing epithelial ulceration (a), and the lamina propria shows spaces suggesting massive edema (b) (H&E 100×). B – Showing extensive hemorrhage (a) and cellular infiltration (b) with desquamated epithelium (H&E 200×). C – Showing spaces suggesting massive edema (a) in the lamina propria, disorganization of the muscle fibers (b), and proliferation of some epithelial cells in the lamina propria (c) (H&E 200×). D – Showing extensive collagen deposition and fibrosis in the lamina propria and in between muscle fibers (a), dilated blood vessels (b) and perivascular cellular infiltration (c). Note nodular proliferation of some epithelial cells in the lamina propria (d) (Masson’s trichrome 200×). E – Showing dilated congested blood vessels (a), spaces suggesting massive edema (b), and cellular infiltration (c) in the lamina propria. Vacuolations in some epithelial cells are seen (d) (H&E 200×). F – Showing dilated congested blood vessels (a) in the lamina propria. Intermuscular spaces suggesting edema and vacuolations are seen (b) (H&E 400×). G – Showing spaces suggesting massive edema (a) in between the muscle fibers with few mononuclear leukocytes (b) (H&E 200×). H – A section in the blood vessel in the lamina propria showing spaces suggesting the presence of edema (a), disorganized smooth muscle fibers, and vacuolations of its tunica media (b) (H&E 1000×)
CP – cyclophosphamide, H&E – hematoxylin and eosin.
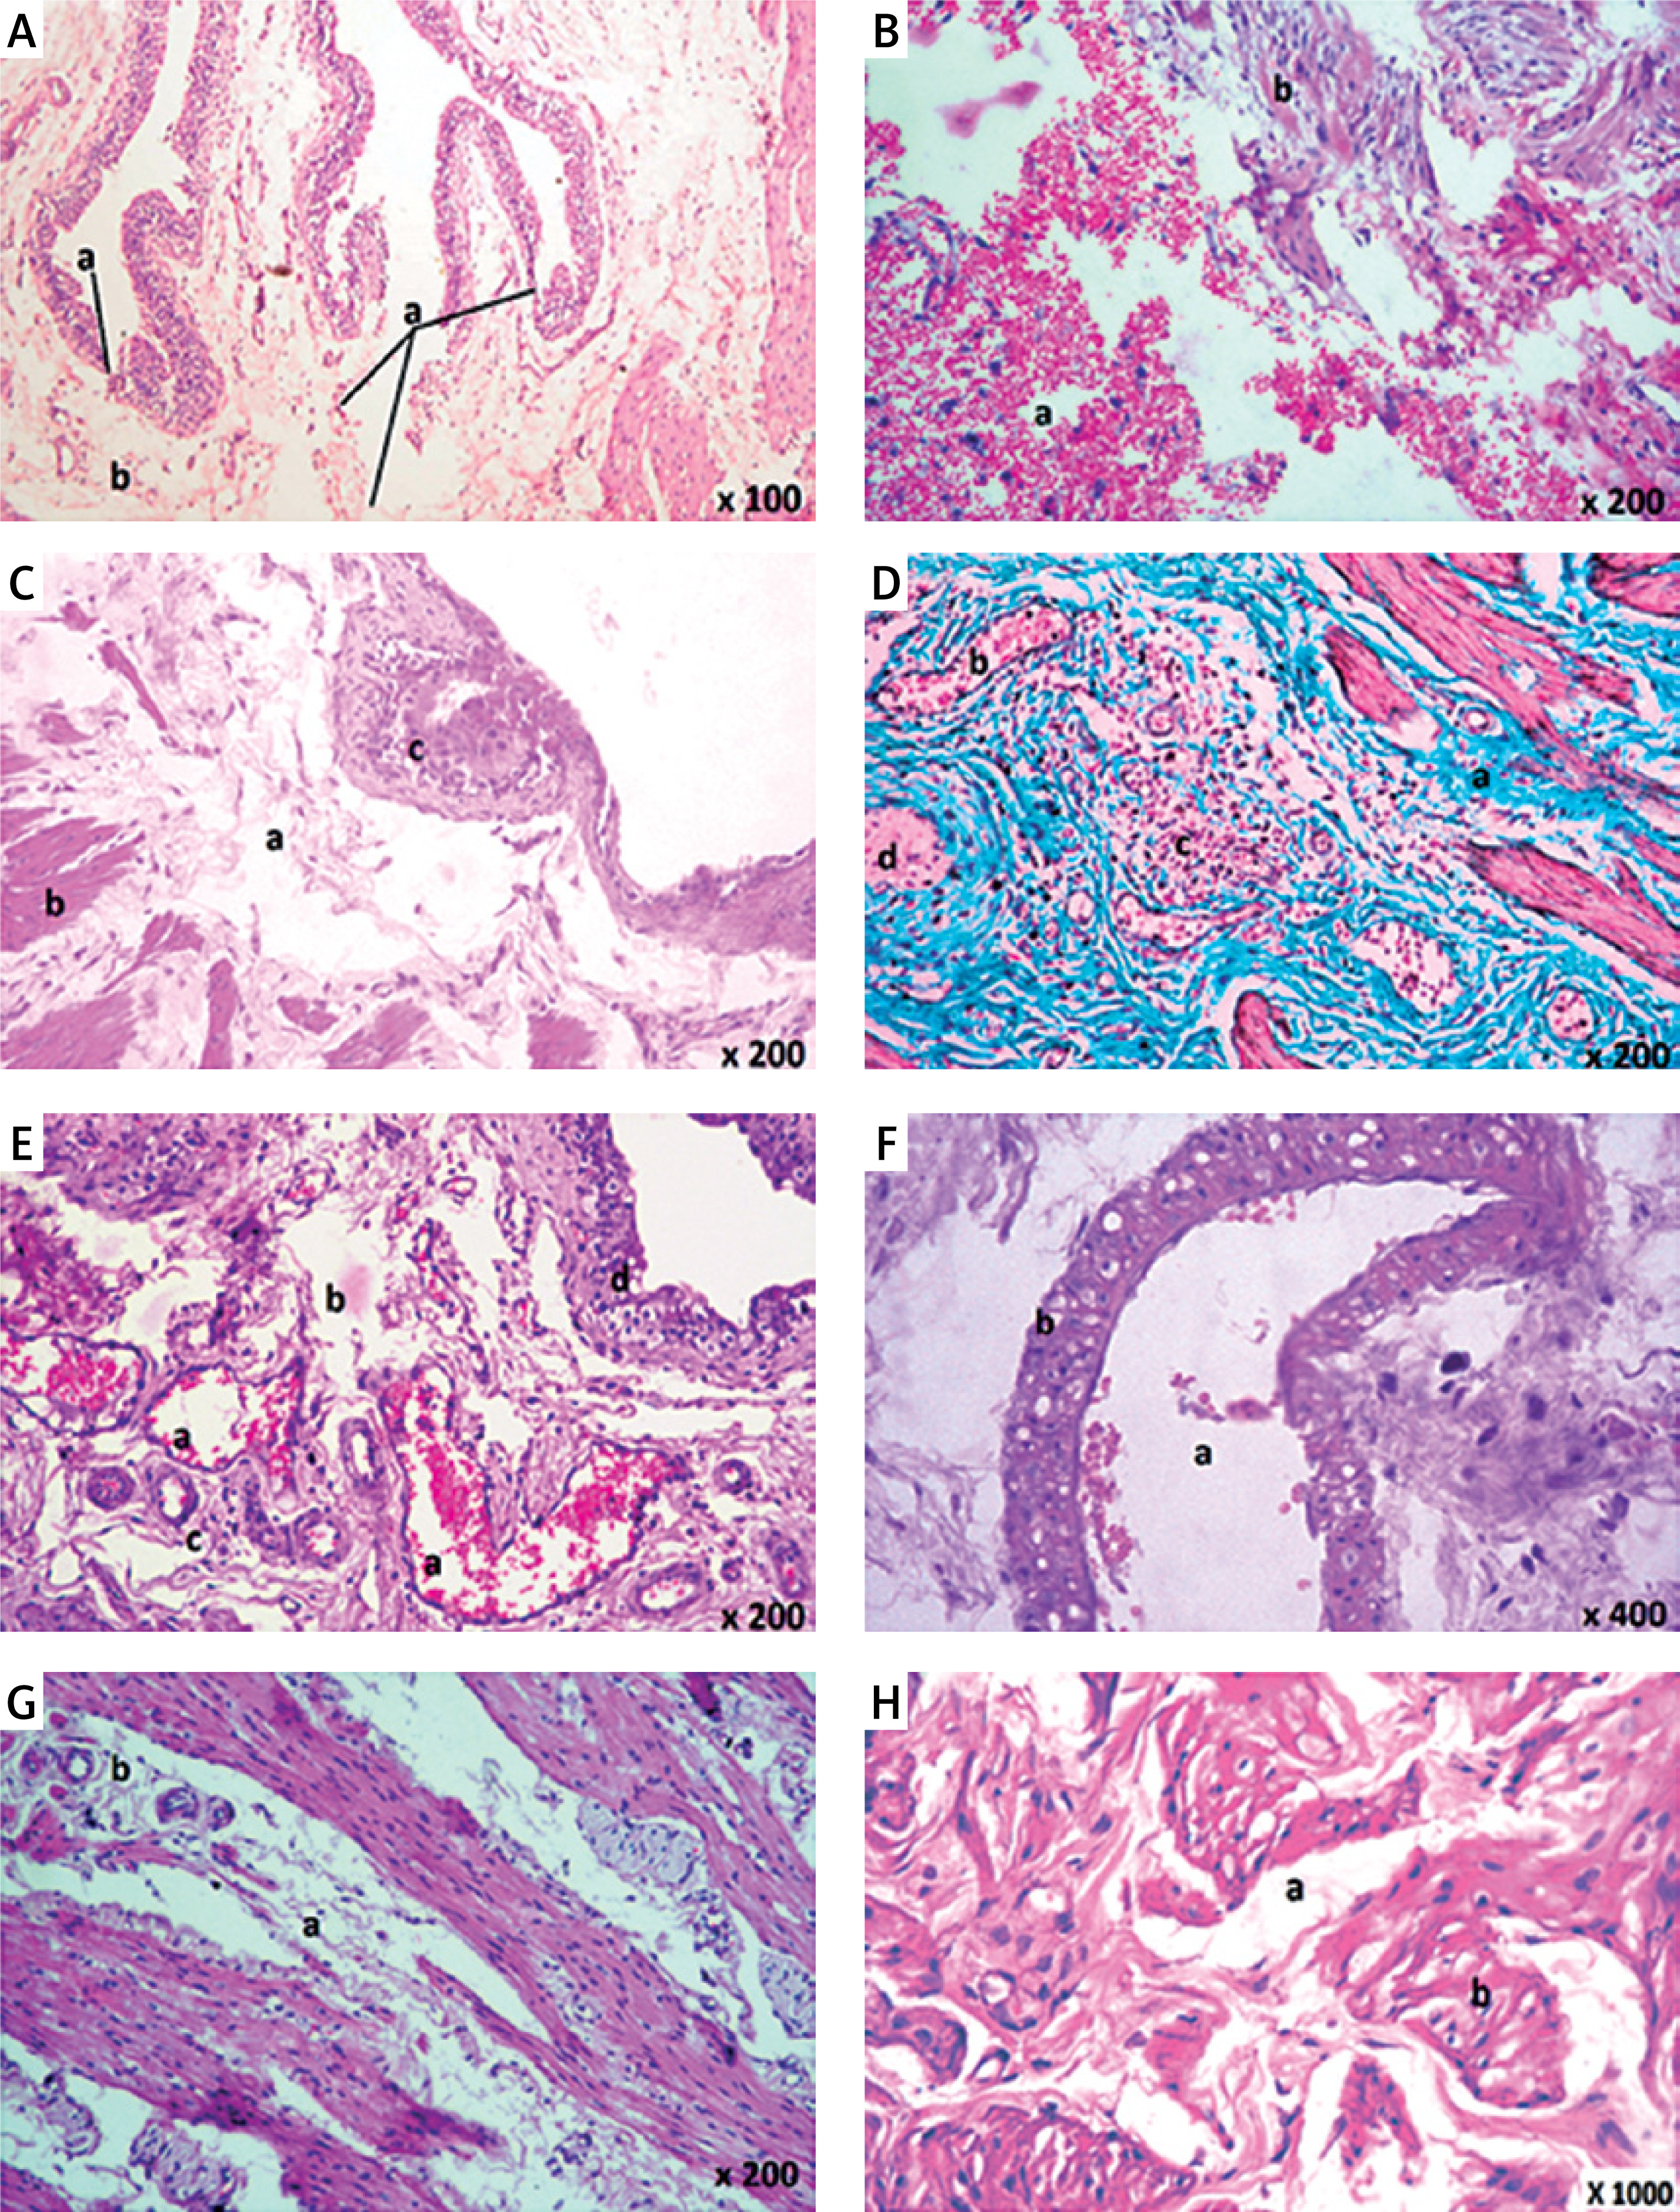
Examination of the lamina propria of group C showed dilated (Figures 2 D–F) and congested blood vessels (Figures 2 E, F), extensive hemorrhage (Figure 2 B), and spaces suggesting massive edema (Table I, Figures 2 A, C, E, G, H). The tunica media of the blood vessels in the lamina propria appeared edematous with disorganized smooth muscle fibers and vacuolations (Figure 2 H), extensive collagen deposition and fibrosis (Table I, Figure 2 D), and perivascular cellular infiltration (Table I, Figures 2 B, D, E). A few mononuclear leukocytes (Figure 2 G) were also seen in sections of this group.
Examination of the musculosa of group C showed pathological changes in the form of spaces in between the muscle fibers, which suggested edema (Figures 2 F, G), and cellular infiltration in the form of mononuclear leucocytes (Figure 2 G). Some muscle fibers showed fragmentation (Figure 2 C), vacuolations (Figure 2 F), and extensive collagen deposition in between the muscle fibers (Figure 2 D).
Examination of urinary bladder epithelium of group D1 revealed persistent epithelial ulceration (Table I, Figures 3 A, B) and vacuolations in some epithelial cells (Figure 3 C).
Figure 3
Histological examination of rat urinary bladder for group D1 (CP + TQ-treated with 10 mg/kg/day TQ). A – Showing spaces suggesting moderate edema in the lamina propria (a) and in between the muscle fibers (b). Note the epithelial ulceration (c) (H&E 200×). B – Showing dilated blood vessels (a), spaces suggesting moderate edema in the lamina propria (b), and epithelial ulceration (c) (H&E 200×). C – Showing dilated congested blood vessels (a) and spaces suggesting moderate edema (b) in the lamina propria. Vacuolation in some epithelial cells are seen (c) (H&E 200×). D – Showing spaces suggesting moderate edema (a) in the lamina propria and cellular infiltration in the form of mononuclear cells, polymorphonuclear cells, and red blood cells (hemorrhage) (b). Congested blood vessels are seen (c) (H&E 400×). E – Showing dilated congested blood vessels (a) in the lamina propria. Spaces suggesting moderate edema and vacuolations of the tunica media are seen (b). Hemorrhage is seen (c) (H&E 400×). F – Showing extensive collagen deposition and fibrosis in the lamina propria and in between muscle fibers (a) and dilated congested blood vessels (b). Cystic epithelial cellular proliferation is seen in the lamina propria (c) (Masson’s trichrome 200×). G – Showing extensive collagen deposition and fibrosis in the lamina propria (a), dilated blood vessels (b), and perivascular cellular infiltration (c). Note nodular proliferation of some epithelial cells in the lamina propria (d) (Masson’s trichrome 200×). H – Showing dilated congested blood vessels (a), spaces suggesting massive edema (b), and perivascular cellular infiltration (c) in between muscle fibers (H&E 200×)
CP – cyclophosphamide, H&E – hematoxylin and eosin, TQ - thymoquinone.
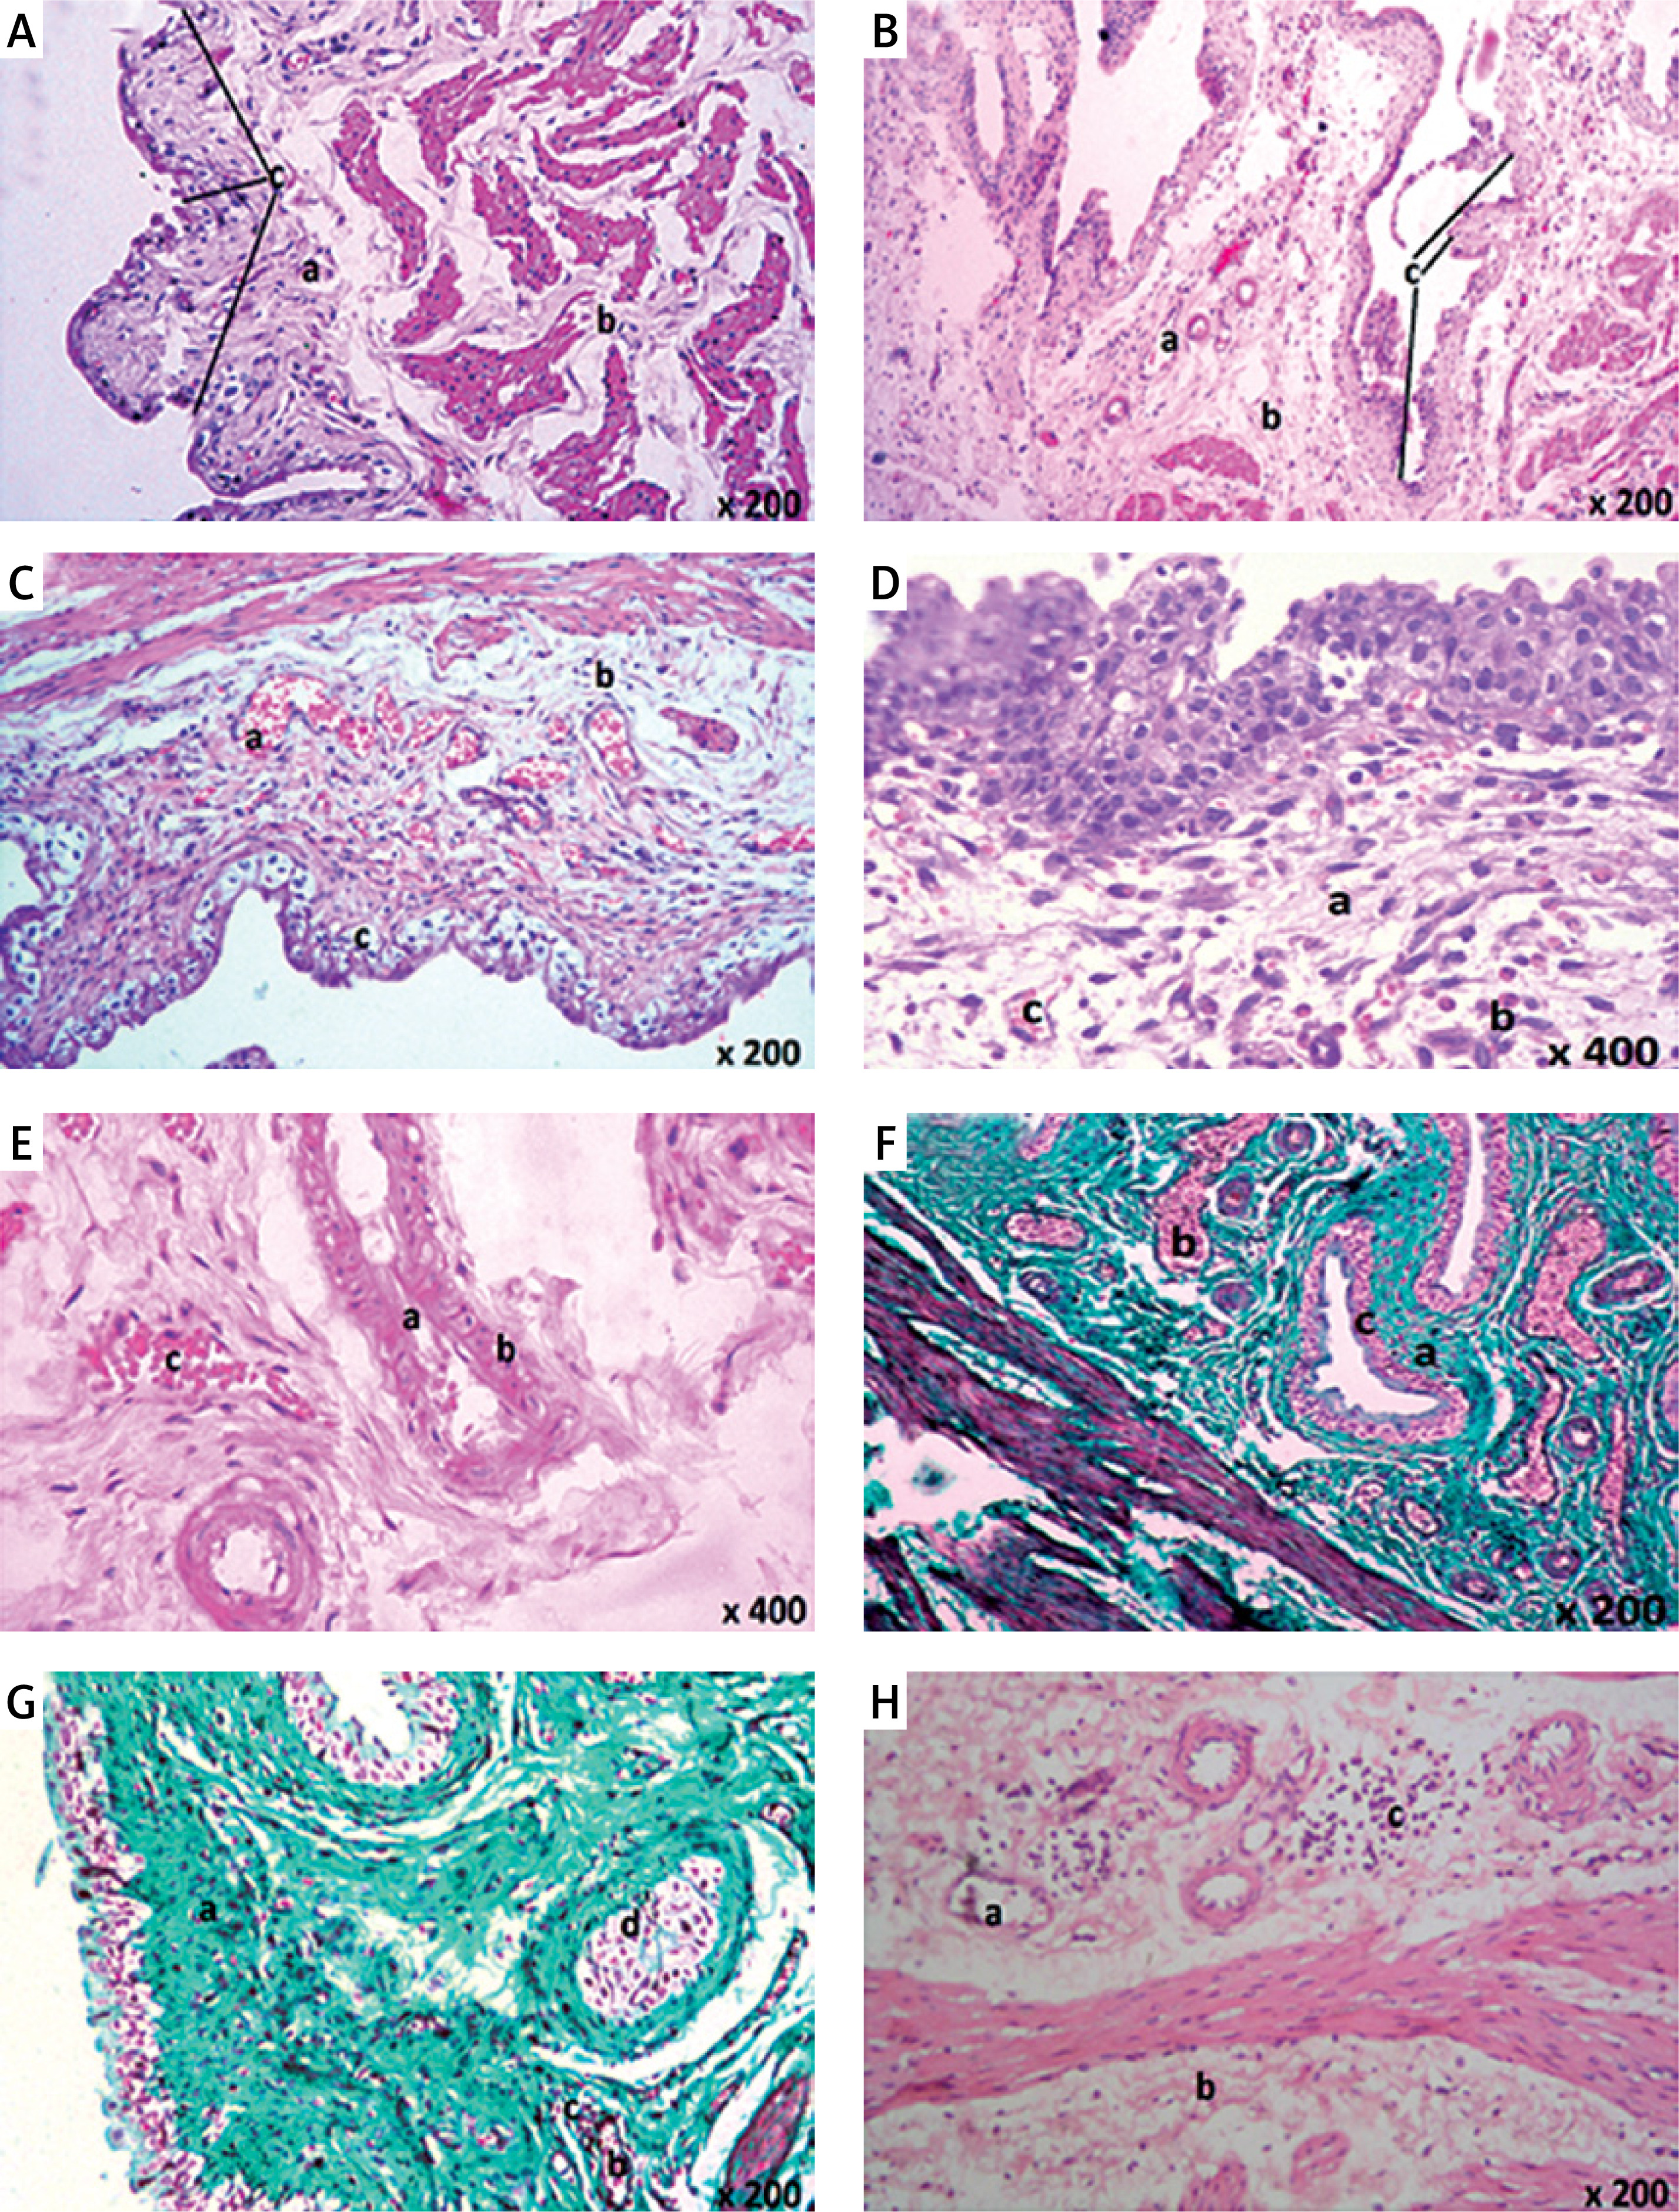
Examination of the lamina propria of group D1 showed spaces suggesting moderate edema (Table I, Figures 3 A–D), vacuolations (Figure 3 E), and dilated (Figures 3 D–F) and congested blood vessels (Figures 3 D–F) that were observed in all sections in the lamina propria. Minute hemorrhages (Table I, Figures 3 D, E) and cellular infiltrations were seen in some sections in the form of mononuclear and polymorphonuclear cells that appeared around blood vessels and in the lamina propria (Table I, Figure 3 D).
Some sections for group D1 showed nodular proliferation of some epithelial cells in the lamina propria (Table I, Figure 3 G) surrounded by extensive collagen deposition and fibrosis in the lamina propria (Table I, Figures 3 F, G). Cystic epithelial cellular proliferation in the lamina propria was seen in some sections (Table I, Figure 3 F). The tunica media of the blood vessels in the lamina propria appeared thickened with spaces, suggesting edema and vacuolations of their tunica media (Figure 3 E). Some blood vessels in the lamina propria appeared congested (Figures 3 C–E) and dilated (Figures 3 B, C, E, G).
Examination of the musculosa of group D1 showed spaces in between the muscle fibers suggesting massive edema, dilated blood vessels, and perivascular cellular infiltrations of inflammatory cells (Figure 3 H) with extensive collagen deposition and fibrosis in between the muscle fibers (Figure 3 G).
Examination of the urinary bladder of group D2 showed an almost normal appearance as evidenced by normal transitional epithelium without discontinuity or ulceration. The lamina propria appeared normal with non-congested and non-dilated blood vessels and no evidence of hemorrhage. Edema was minimal with no evidence of cellular infiltration (Table I, Figures 4 A, B). The musculosa appeared normal with no evidence of edema, hemorrhage, or inflammatory infiltrate (Figure 4 A). There was an absence of necrosis and fibrosis in between the muscle fibers (Figure 4 B).
Figure 4
Histological examination of rat urinary bladder for group D2 (TQ-treated with 100 mg/kg/day TQ). A – Showing normal mucosa (a). Normal lamina propria appeared containing areolar connective tissue with minimal or absent edema (b). Muscle layer appeared normal and its fibers ran in different directions (c) (H&E 200×). B – Showing normal mucosa (a). Normal lamina propria appeared containing areolar connective tissue (b). Muscle layer appeared normal and its fibers ran in different directions (c). No evidence of connective tissue abnormalities (Masson’s trichrome 200×)
CP – cyclophosphamide, H&E – hematoxylin and eosin, TQ – thymoquinone.
Body weight
For body weight, differences were found between groups (all p < 0.001) (Table II). The body weight of group C was statistically significantly less than the weight of groups A, B1, and B2 (all p < 0.05). While the body weight of group D1 was greater than the body weight of group C, it was not a significant difference. The body weight of group D1 was still significantly less than the weight of groups A, B1, and B2 (all p < 0.05). The body weight of group D2 was greater than that of group C and group D1 but the differences were not statistically significant. However, group D2 was the only treatment group not significantly different from group A (p = 1.000), B1 (p = 1.000) or B2 (p = 1.000).
Table II
Group comparisons for body weight and oxidative stress and cell death marker analysis in urinary bladder rat model
| Outcome variable | Rat study groups | |||||||
|---|---|---|---|---|---|---|---|---|
| Group A | Group B1 | Group B2 | Group C | Group | Group D2 | P-value† | ||
| Body weight [g] | Mean (SD) | 155.000 (3.162) | 154.900 (2.601) | 154.200 (3.190) | 146.100 (4.012) | 147.500 (5.74) | 152.100 (3.604) | < 0.001 |
| Median | 155.500 | 155.500 | 154.500 | 147.500 | 149.000 | 151.500 | C < A, B1, B2 D1 < A, B1 | |
| Glutathione reductase serum [U/ml] | Mean (SD) | 0.003 (0.843) | 0.003 (0.000) | 0.003 (0.000) | 0.680 (0.012) | 0.720 (0.015) | 0.041 (.009) | < 0.001 |
| Median | 0.003 | 0.003 | 0.003 | 0.080 | 0.075 | 0.040 | C > A, B1, B2 D1 > A, B1, B2 | |
| MDA serum [nmol MDA/l] | Mean (SD) | 3.140 (0.143) | 3.060 (0.117) | 3.040 (0.126) | 5.120 (0.114) | 4.800 (0.189) | 3.340 (0.171) | < 0.001 |
| Median | 3.150 | 3.000 | 3.050 | 5.150 | 4.850 | 3.300 | C > A, B1, B2, D2 D1 > A, B1, B2 | |
| Protein carbonylation serum [nmol/ml] | Mean (SD) | 0.630 (0.106) | 0.740 (0.126) | 0.760 (0.126) | 1.530 (0.221) | 1.390 (0.273) | 0.910 (0.152) | < 0.001 |
| Median | 0.600 | 0.800 | 0.800 | 1.600 | 1.400 | 0.900 | C > A, B1, B2 D1 > A, B1, B2 | |
| Caspase-3 activity serum [mU] | Mean (SD) | 5.490 (0.099) | 5.580 (0.103) | 5.600 (0.082) | 9.350 (0.310) | 9.020 (0.322) | 6.420 (0.305) | < 0.001 |
| Median | 5.500 | 5.600 | 5.600 | 9.450 | 8.950 | 6.500 | C > A, B1, B2 D1 > A, B1, B2 D2 > A | |
† P-value reported for outcome variable. Group differences are reported for p < 0.05. Values are reported as means (SD) or medians. Group A was an untreated control, group B1 was TQ-treated with 10 mg/kg/day TQ for 10 days, group B2 was TQ-treated with 100 mg/kg/day TQ for 5 days, group C was a toxicity control where 100 mg/kg CP was administered for 2 days, group D1 was CP + TQ-treated with the same TQ treatment as group B1 and 100 mg/kg CP for 2 days, and group D2 was CP + TQ-treated with the same TQ treatment as group B2 and 100 mg/kg CP for 2 days.
Measurement of oxidative stress markers in blood
Differences (all p ≤ 0.05) were found between groups for all oxidative stress and cell death markers; results are presented in Table II and Figure 5. For glutathione reductase (GR), differences were found between groups (all p < 0.001) (Table II, Figure 5 A). Group C GR level was statistically significantly higher than in groups A1, B1, and B2 (all p < 0.05). While the GR level of group D1 was lower than in group C, it was still significantly different from that in groups A1, B1, and B2 (all p < 0.05). Group D2 GR level was lower than in groups C and D1, but the difference was not statistically significant. Group D2, however, was not significantly different from group A (p = 1.000), B1 (p = 0.091) or B2 (p = 0.091).
Figure 5
Group comparisons of oxidative stress and cell death markers in blood. A – Mean glutathione reductase. B – Mean malondialdehyde (MDA). C – Mean protein carbonylation (PC). D – Mean caspase-3 activity. There were 10 rats per group. Mean with markers indicates significant difference (Dunn’s test, p < 0.05). (A) significantly different from group A; (B1) significantly different from group B1; (B2) significantly different from group B2; (C) significantly different from group C; (D1) significantly different from group D1; and (D2) significantly different from group D2. Error bars indicate 95% confidence intervals
CP – cyclophosphamide, group A – control, group B1 – TQ-treated with 10 mg/kg/day TQ, group B2 – TQ-treated with 100 mg/ kg/day TQ, group C – CP-treated, group D1 – CP + TQ-treated with 10 mg/kg/day TQ, group D2 – CP + TQ-treated with 100 mg/ kg/day TQ, TQ – thymoquinone.
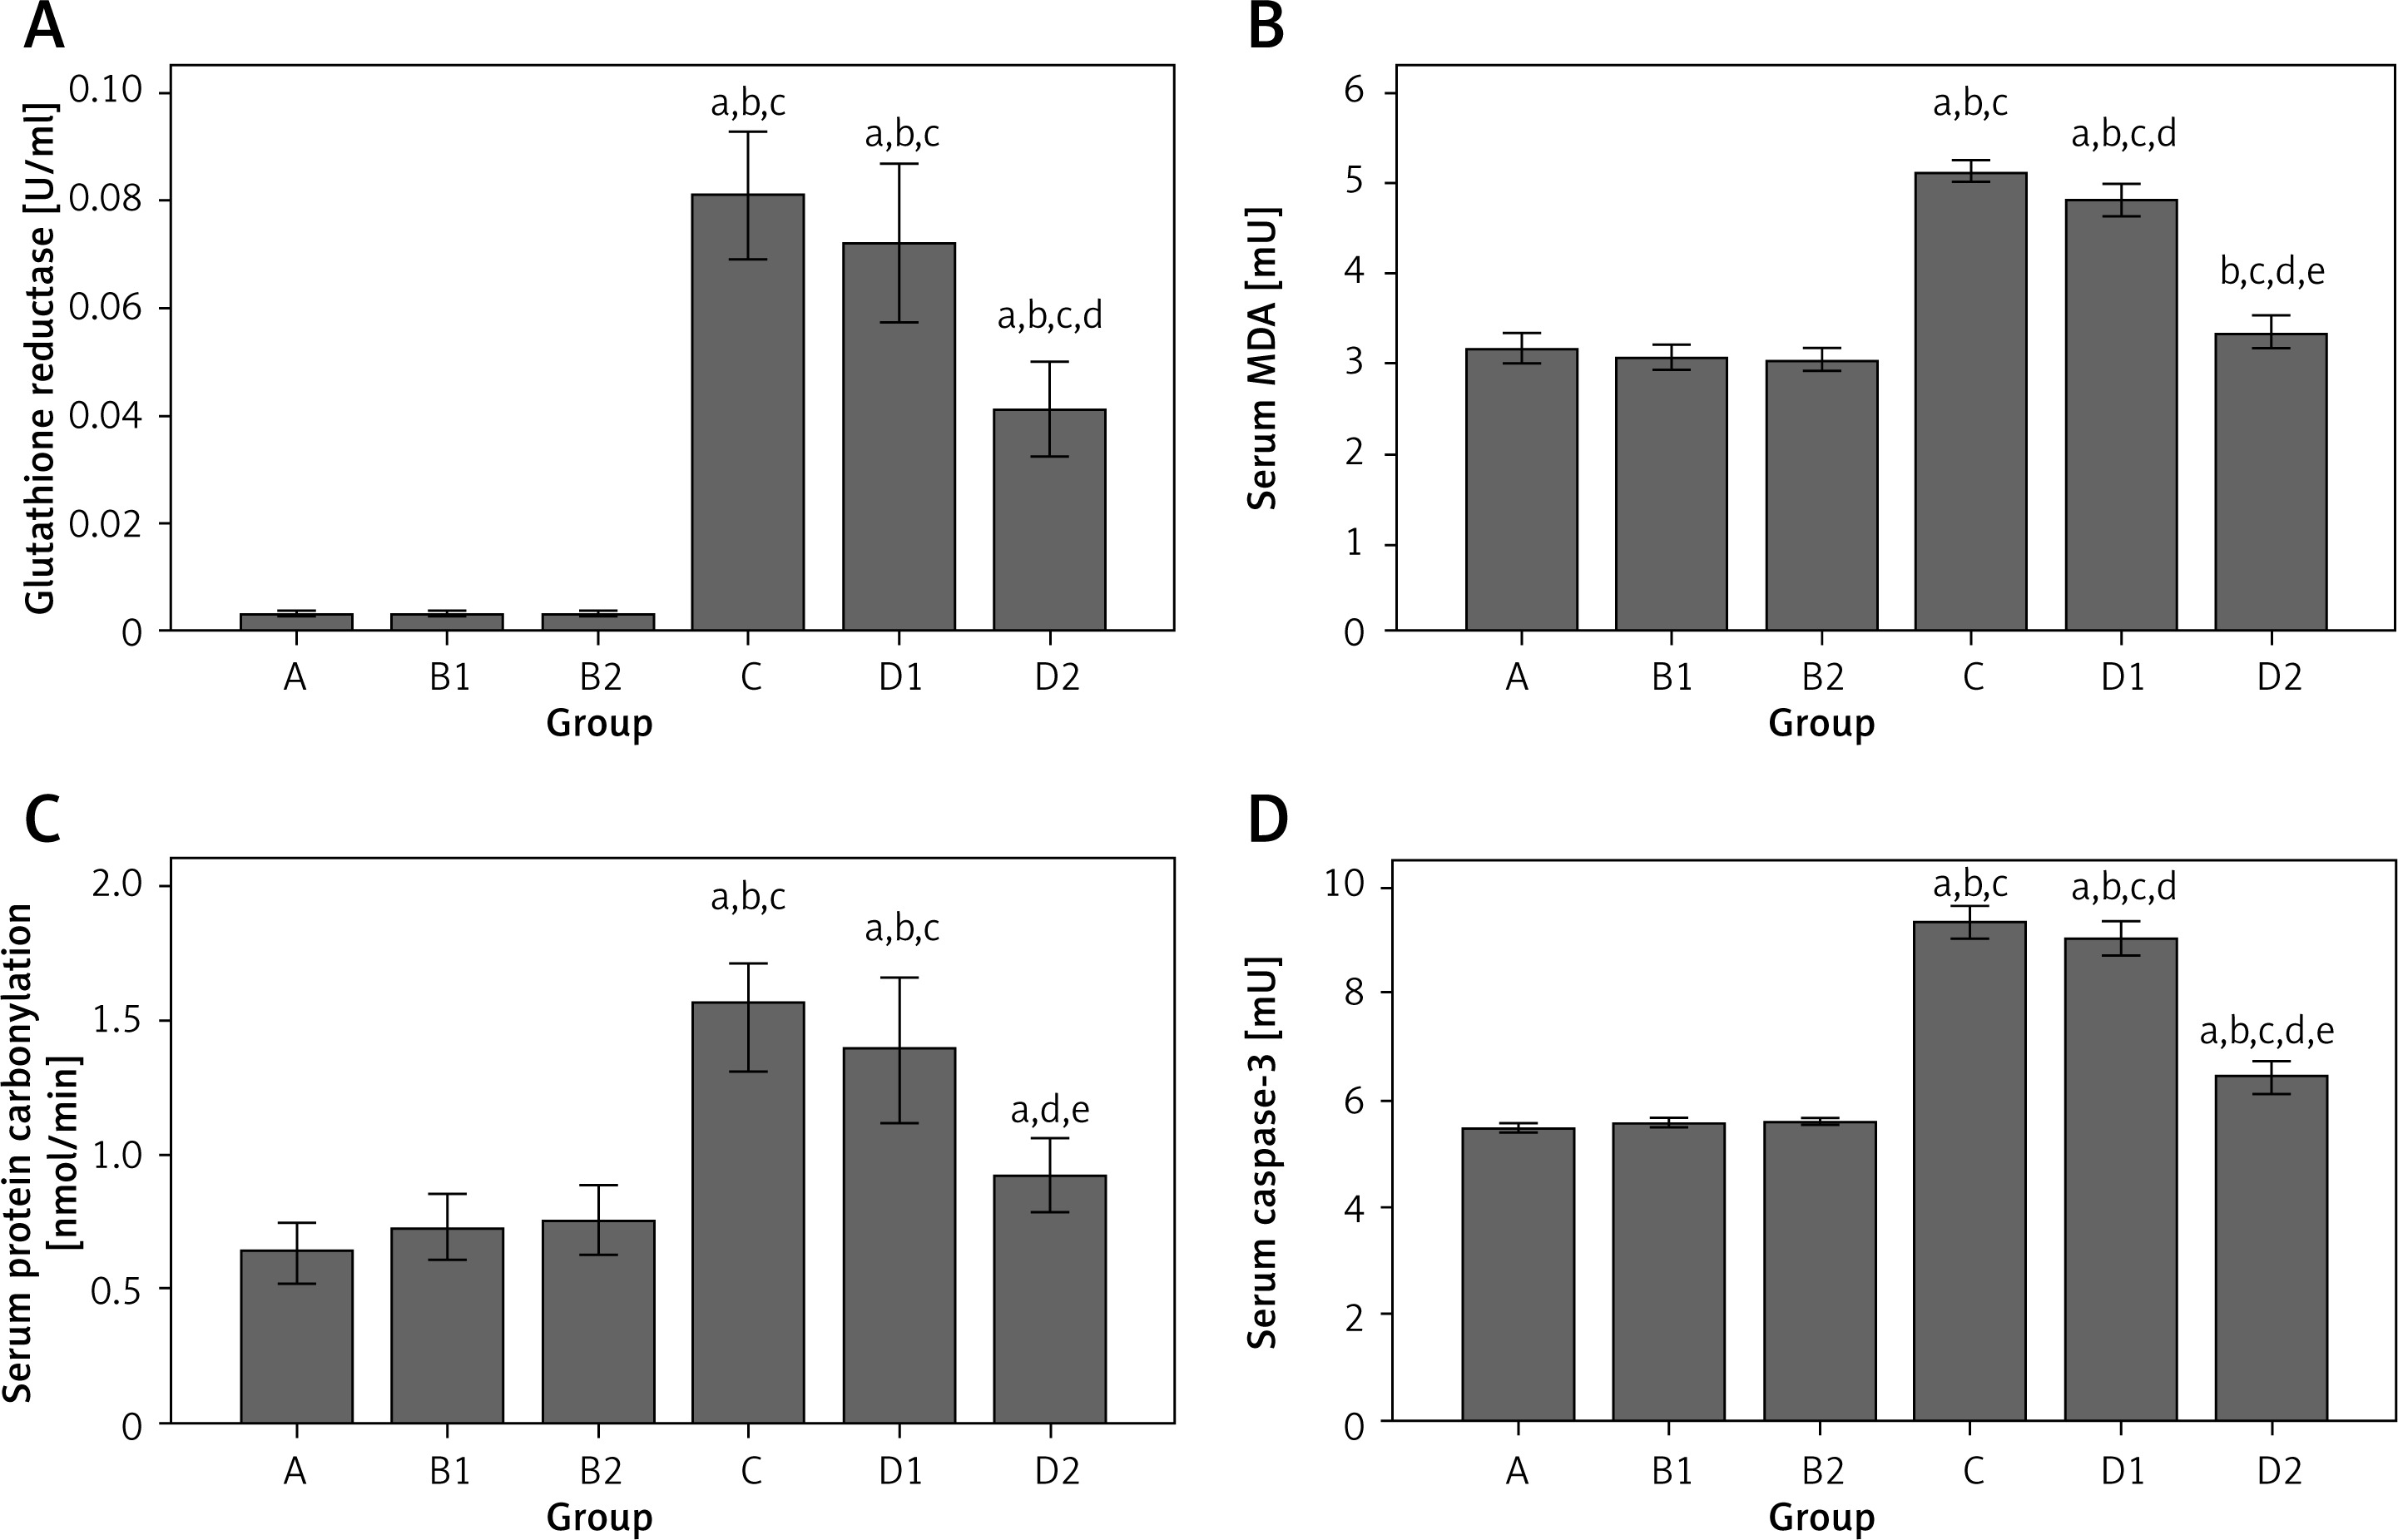
For lipid peroxidation (MDA), differences were found between groups (all p < 0.001) (Table II, Figure 5 B). Group C MDA was significantly higher than in groups A, B1, B2, and D2 (all p < 0.05). Group D1 MDA was lower than in group C, but not statistically significantly. Group D1 MDA level was still significantly higher than in groups A, B1, and B2 (all p < 0.05). Group D2 MDA was significantly lower than in group C (p < 0.05) and not significantly different from groups A1 (p = 1.000), B1 (p = 0.391), and B2 (p = 0.325).
For protein carbonylation (PC), differences were found between groups (all p < 0.001) (Table II, Figure 5 C). PC was significantly higher in group C than in groups A, B1, and B2 (all p < 0.001). Group D1 PC was lower than in group C, but still significantly higher than in groups A, B1, and B2 (all p < 0.001). Group D2 PC level was lower than in groups C and D1, but neither difference was statistically significant. However, group D2 was the only treatment group that was not statistically significantly different from group A (p = 0.135), B1 (p = 1.000), or B2 (p = 1.000).
Measurement of cell death markers in blood
For caspase-3 activity, differences were found between groups (all p < 0.001) (Table II, Figure 5 D). Group C caspase-3 activity was significantly higher than in groups A, B1, and B2 (all p < 0.05). Group D1 caspase-3 activity was lower than in group C, but it was not a significant difference. Group D2 caspase-3 activity was lower than in groups C and D1, but differences were not significant. While group D2 caspase-3 activity was statistically greater than that in group A (p = 0.017), it was not significantly different from values in the vehicle groups B1 (p = 0.264) and B2 (p = 0.516).
Discussion
The results of the current study suggested that treatment with 100 mg/kg/day TQ inhibited the CP-induced inflammatory process, and reduced oxidative stress, most likely through the anti-inflammatory properties of TQ. Further, the integrity of the urinary bladder wall seemed to be preserved using a TQ dosage of 100 mg/kg/day but not using the lower dosage of 10 mg/kg/day.
In the current study, group C had a statistically significantly lower body weight than groups A, B1, and B2. This difference may be attributed to the fragmentation, vacuolations and fibrosis of the muscle fibers that were present in group C. The body weight of group D1 was non-significantly greater than the body weight of group C, possibly due to the presence of edema and dilated, congested blood vessels in the lamina propria in group D1. The body weight of group D2 was not significantly greater than group C and group D1, possibly due to the healing of the lamina propria and musculosa from the signs of inflammation. This recovery was confirmed by group D2 being the only treatment group that was not significantly different from groups A, B1, and B2.
Our results are concordant with previous studies illustrating the toxic effects of CP on the urinary bladder [10, 19, 21, 22]. The urothelial damage could be attributed to protein oxidation and carbonylation or to reactive oxygen species (ROS) production by CP [23–25]. The oxidative stress related to the urothelial damage might be attenuated by increased nitric oxide (NO) production especially after ischemic reperfusion (IR). This attenuation could be mediated by inducible nitric oxide synthase (iNOS) and endothelial nitric oxide synthase (eNOS) [26].
Histological analysis of the lamina propria of the urinary bladder of group C revealed marked pathological changes. The urinary bladder is particularly vulnerable to prolonged oxidative-stress drug exposure of its urothelium because of its function as a reservoir for urine [27, 28].
Histological analysis of the musculosa of the urinary bladder of group C revealed marked pathological changes, related to the inflammatory process whereby CP attracts inflammatory cells into the urinary bladder wall [25]. The extensive collagen deposition in between the muscle fibers in group C of the current study could be linked to the role of CP in urinary bladder fibrosis via necrosis, contracture, and hemorrhage [29]. These findings also coincided with our finding that group C was significantly different for caspase-3 activity, compared with groups A, B1, and B2.
In the current study, caspase-3 activity in group C was significantly higher than in groups A, B1, and B2. The mechanism by which CP activated caspase-3 in the current study might be attributed to oxidative-stress induced apoptosis [24, 29]. Overproduction of ROS caused by CP-induced inflammation of the urinary bladder epithelium results in considerable cellular necrosis. The cellular necrosis could be related to protein denaturation, oxidative DNA damage via alteration of mitochondrial membrane potential, release of cytochrome C, and activation of the caspase cascade [24]. Cicero et al. [30] reported a protective effect of certain polyphenolic compounds affecting the multiple signaling pathways involved in programmed apoptosis, while Kamisli et al. [31] reported a protective effect of sodium channel blockers against ischemic-induced apoptosis.
Several doses of TQ have been considered to demonstrate the chemoprotective effects against CP [28] and cisplatin [32]. Histological analysis of the urinary bladders in group D1 (CP + TQ-treated with 10 mg/kg/day TQ) revealed persistent signs of oxidative injury. This finding suggested that the administration of 10 mg/kg/day TQ did not alleviate CP-induced oxidative injury. For most of the oxidative stress markers measured, group D1 was significantly different from groups A, B1, and B2. The ineffectiveness of the 10 mg/kg/day dose of TQ was supported by Badary et al. [33], who reported that the administration of TQ at doses of 30, 60, and 90 mg/kg/day did not change the reduced glutathione content. Previous reports have demonstrated that administration of TQ at 100 mg/kg/day reduced lipid peroxidation, but doses of 25 and 50 mg/kg/day did not restore the reduced glutathione content [15].
Histological analysis of the urinary bladders in group D2 (CP + TQ-treated with 100 mg/kg/day TQ) revealed that the integrity of the epithelial layer of the urinary bladder was preserved and the inflammatory cellular infiltrate in the lamina propria and musculosa was markedly attenuated by the administration of TQ at a dose of 100 mg/kg/day. Based on these results, it is likely that part of the anti-inflammatory effect provided by TQ was mediated by a decrease in the inflammatory cellular infiltrate and a decrease in the release of inflammatory mediators. The attenuated inflammatory process consequently diminished the CP-induced toxic effects on the bladder.
Histological examination of the urinary bladders of group D2 suggested that 100 mg/kg/day TQ had a protective effect on CP-induced urothelial damage and reduced signs of oxidative injury, possibly by preventing the migration of inflammatory cellular infiltrate. The results of the current study supported the concept of the antioxidant properties of TQ. Significant reductions were found for group D2 for the tested oxidative stress markers. The arrest of the lipid peroxidation process coupled with significant reductions in MDA and PC was reflected in the results of the oxidative stress markers in group D2. Klisic et al. [34] calculated a novel summary score (DOI score) using markers of oxidative stress, dyslipidemia, and inflammation, and correlated that score with several diseases.
Kaczmarczyk-Sedlak et al. [35] reported a therapeutic effect of caffeine causing a reduction in the MDA and an increase in GSH concentrations in serum. In the current study, the significant reductions in GR, MDA, and PC in group D2 may be attributed to the free radical scavenging effect produced by the administration of TQ at a dose of 100 mg/kg/day as previously reported [14].
Histological analysis of the urinary bladder musculosa in group D2 revealed absence of necrosis and fibrosis between the muscle fibers and the integrity of collagen deposition was substantially lower than in group C. These histological findings in group D2 suggested that administration of 100 mg/kg/day TQ almost completely improved the CP-induced fibrosis and necrosis. The mechanism of improvement by TQ could be explained by Attoub et al. [36], who demonstrated an antiapoptotic effect of TQ, in vitro and in vivo, via inhibition of histone deacetylase 2 (HDAC2) proteins. In the current study, the histological findings in group D2 were supported by the results of the cell death marker in the same group, which were significantly different compared with groups A, B1, B2, C, and D1 for caspase-3. The findings were also supported by Virag et al. [37], who reported overproduction of ROS during inflammation leading to significant oxidative stress, cellular damage, and cellular necrosis through mechanisms involving lipid peroxidation of cellular membrane, protein denaturation, and DNA damage.
Cellular apoptosis has been attributed to DNA fragmentation producing cellular toxicity and eventually cell death. However, cellular toxicity might be alleviated by pretreatment with free radical scavengers. In the current study, group D2 caspase-3 activity was lower than in group C and D1, but the differences were not significant. This improvement in caspase 3 activity in the rat urinary bladder tissue could be explained by the previously reported anti-apoptotic and free radical scavenging properties of TQ [38–41].
To our knowledge, the current study is one of two studies that demonstrated in vivo a protective effect of TQ against CP-induced oxidative injury in the urinary bladder [28]. The current study, however, had several limitations. Although histological analysis of the urinary bladder for group D1 revealed signs of oxidative injury, there were statistically significant differences between groups C and D1 for MDA and caspase-3; no other statistically significant differences were found between these 2 groups. Further, the spectrophotometric assessment of MDA and PC was nonspecific and could not quantify these two parameters of oxidative stress.
Future studies could use larger sample sizes or test different doses of TQ to determine more conclusively whether there was a statistically significant relationship between groups C and D1 and whether the absence of significant differences was due to the lack of statistical power. Further, our results may be useful for future researchers, particularly since TQ is currently being studied with a wide variety of compounds due to its antioxidant, anti-inflammatory, antiapoptotic and anticancer properties.
In conclusion, the results of the current study suggested that administration of CP caused severe histopathological and oxidative changes in the rat urinary bladder. Concomitant administration of 100 mg/kg/day TQ appeared to alleviate the signs of CP-induced oxidative injury in rats, possibly via its anti-inflammatory and antiapoptotic properties. Because of the importance of CP as an anticancer drug in clinical practice, TQ should be considered as a promising adjuvant therapy for protecting against CP-induced oxidative injury to the bladder tissue. Future studies targeting the protection of TQ against CP-induced RNS injury to the bladder tissue are warranted to decisively confirm its chemoprotective properties and its possible concomitant use with CP to ameliorate the CP-induced HC in humans.

