

Introduction
Osteoarthritis (OA) is a degenerative joint disease that can affect the entire joint, leading to swelling, pain, and stiffness, and ultimately impairing mobility. OA represents a major public health challenge. According to the latest Global Burden of Disease (GBD) 2021 data, an estimated 595 million people (7.6% of the global population) suffered from OA in 2020 [1]. Previous studies report that the global age-standardized incidence, prevalence, and years lived with disability (YLDs) of OA significantly increased from 1990 to 2021 [2, 3]. Even more concerning, the World Health Organization (WHO) predicts that the global incidence of OA will continue to rise due to increasing injury rates, obesity prevalence, and population aging [4]. OA can affect any joint, but knee OA is the predominant subtype, accounting for nearly three-quarters of the global OA burden. Among individuals aged 40 and older, the prevalence of knee OA is approximately 22.9% [5]. In advanced stages, knee OA often leads to joint failure requiring surgical replacement, imposing substantial economic burdens on healthcare systems and society. Between 1% and 2.5% of the gross domestic product of several high-income nations is spent on OA-related healthcare each year, which is projected to cost $18,500 per capita globally [6]. Annual per-capita healthcare costs associated with OA vary widely. The estimated annual indirect and intangible expenses for patients with knee osteoarthritis in Singapore were $1008 and $1200, respectively, representing 2.8% and 3.3% of yearly household income [7]. A study reported that in 2016, OA caused approximately $80 billion in medical expenses in the United States (U.S.) [1, 8].
The U.S. ranked third globally in new OA cases in 2021, following China and India [9]. The total economic burden of OA in the U.S. is estimated at $136.8 billion annually, surpassing the healthcare impacts of tobacco, cancer, and diabetes. A recent study found that between 2019 and 2021, approximately 53.2 million Americans had arthritis, with OA affecting 32.5 million. While it is known that 62% of individuals with OA in the U.S. are women and 88% are aged 45 or older [10], understanding state-level variations, age-specific burden patterns, and differences in etiologies is critical for strengthening OA management nationwide.
Several studies have assessed the burden of OA at global, regional, and national levels, with many focusing on China [3, 11–13]. For example, Liu et al. used GBD 2019 data to examine the burden of knee and hip OA attributable to high body mass index (BMI) in China and the U.S. [14]. However, none of these studies specifically addressed the epidemiological trends and burden of OA in the U.S. Additionally, the incorporation of U.S. state-level insurance claims data in GBD 2021 enhances the reliability of OA research in the American context. Building on this, we used the latest GBD 2021 database to analyze the burden and trends of OA in the U.S. from 1990 to 2021, including state-specific burden patterns and decomposition analyses to identify contributing factors. Our study aimed to provide a comprehensive understanding of the OA burden and its trends in the U.S., offering policymakers a foundation for developing effective prevention strategies and policies.
Material and methods
Data sources
The GBD study is the world’s largest epidemiological database. The most recent iteration, GBD 2021, developed through collaboration with over 10,000 contributors across 150+ countries and territories, provides estimates for 371 diseases and injuries across 204 nations and regions. To ensure consistency and reliability, all data underwent rigorous quality control and bias adjustment using meta-regression–Bayesian, regularized, and trimmed (MR-BRT). Disease modeling was performed using DisMod-MR 2.1, a Bayesian meta-regression tool. Final estimates were generated through 500 computational iterations, with 95% uncertainty intervals (UI) represented by the 2.5th and 97.5th percentiles [15]. Data sources are accessible via the GBD online portal (https://vizhub.healthdata.org/gbd-results/), and detailed methodologies are described in prior GBD publications [15].
Since OA does not directly cause mortality [14], this study focused on incidence, prevalence, and YLDs. YLDs quantify non-fatal health loss, calculated by multiplying prevalence by disability weights [16]. Age-specific analyses began at ≥ 30 years. Data on OA burden (number and rate) stratified by sex, age, and U.S. state (51 states) from 1990 to 2021 were extracted from the GBD online platform. Rates are expressed per 100,000 population, with all estimates reported as means and 95% UI.
Case definition
GBD 2021 classifies OA into four subtypes: hip, knee, hand, and “other” OA (excluding cervical/lumbar spine cases). Diagnoses followed ICD-9 (codes starting with 715) and ICD-10 (M16, M17, M18, M19) criteria. Cases required radiographic confirmation and self-reported joint pain lasting ≥ 1 month within the preceding year [1, 17].
Statistical analysis
Percentage changes in OA burden between 1990 and 2021 were calculated as: Percentage change = ((2021 Estimate – 1990 Estimate)/(1990 Estimate)) × 100. State-level incidence and prevalence totals were mapped across 51 U.S. states. Age-specific burden was analyzed for 14 age groups (30–34, 35–39, 40–44, 45–49, 50–54, 55–59, 60–64, 65–69, 70–74, 75–79, 80–84, 85–89, 90–94, 95+ years). Etiological contributions to YLDs were disaggregated by age group. Decomposition analysis compared U.S. OA incidence drivers (population growth, aging, epidemiological changes) against Socio-demographic Index (SDI) regions (high, high-middle, middle, low-middle, low), China, and India. SDI categorizes 204 nations based on income, education, and fertility rates. All analyses and visualizations were conducted in R software (version 4.3.3).
Results
Trends in the incidence and prevalence of OA
From 1990 to 2021, the number of incident cases, prevalent cases, and YLDs for OA exhibited marked increases across both sexes, males, and females in the U.S., with females consistently experiencing higher absolute numbers than males. Age-standardized incidence rate (ASIR), prevalence rate (ASPR), and YLD rate (ASYR) trends for both sexes and females followed similar patterns: an initial rise from 1990 to 1995, followed by a decline to a nadir in 2005, and subsequent gradual increases. In contrast, males demonstrated a steady decline in these rates until 2005, after which upward trends resumed (Figure 1).
Figure 1
Trends of osteoarthritis by number of incidence (A), prevalence (B), and years lived with disability (YLDs) (C), age-standardized incidence rate (ASIR) (D), age-standardized prevalence rate (ASPR) (E), and age-standardized YLDs rate (ASYR) (F) in United States in 2021
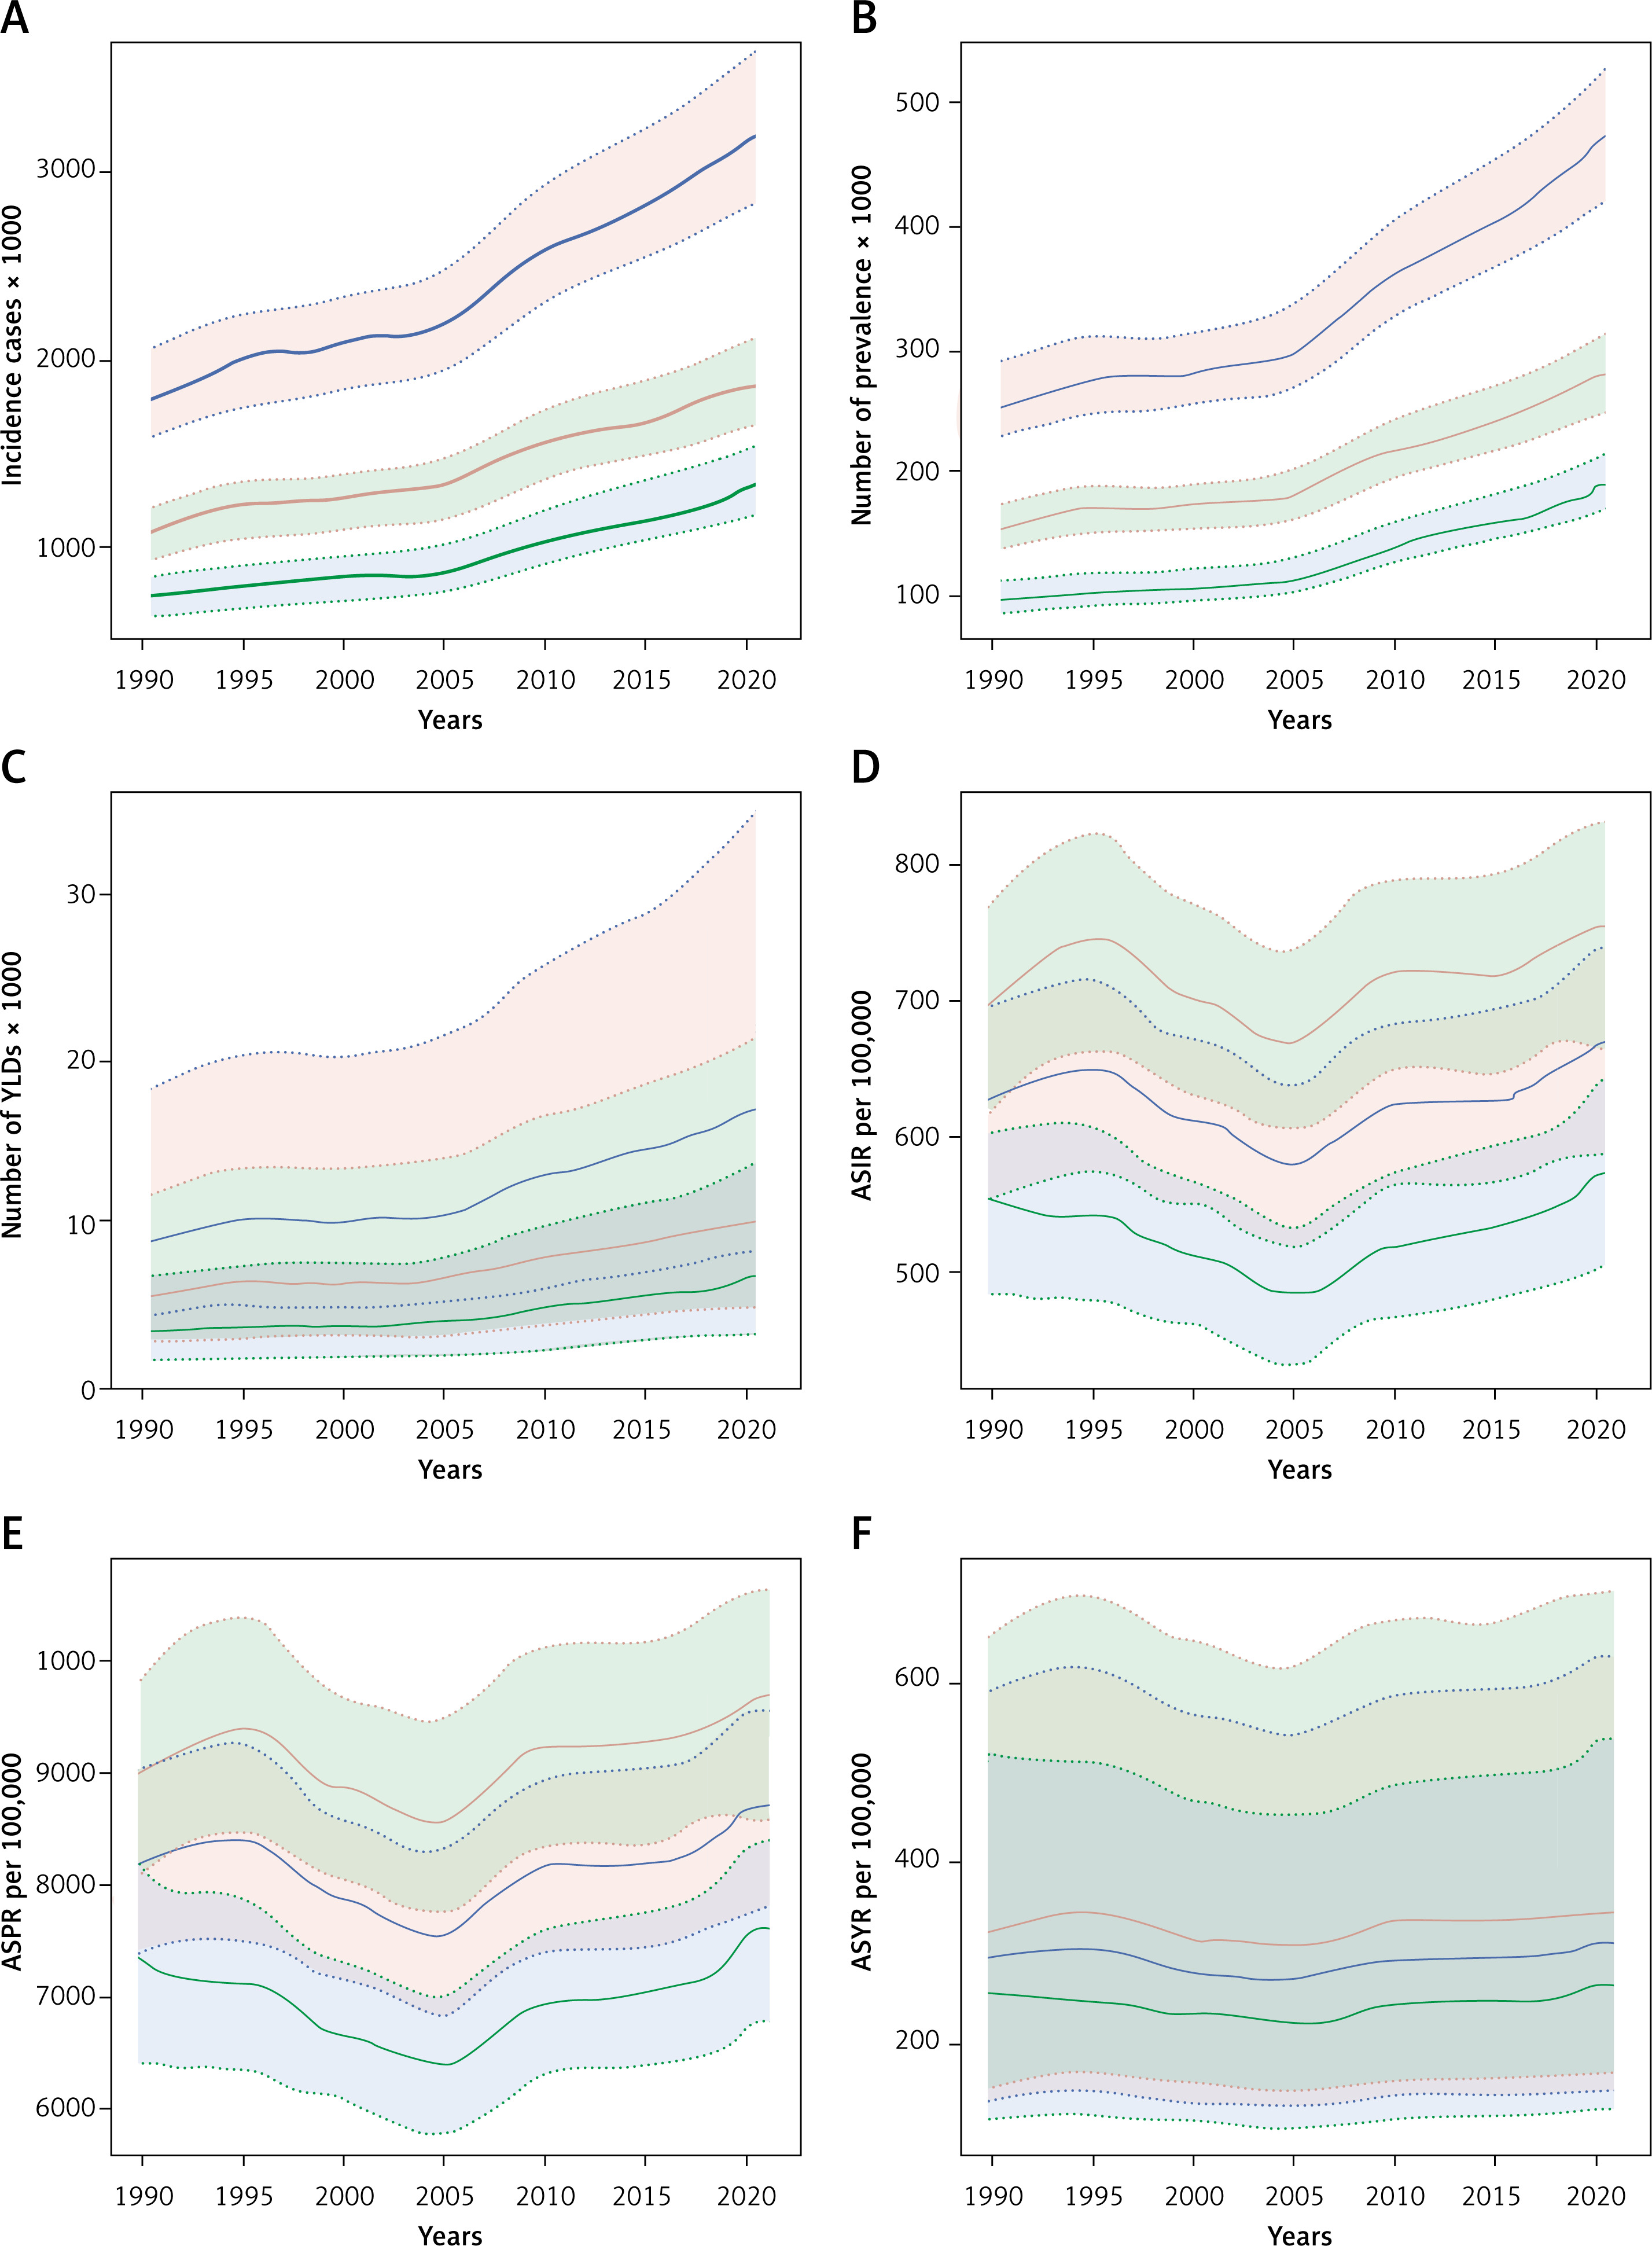
In 2021, the U.S. recorded 3,192,701.5 (95% UI: 2,830,531.8–3,554,075) new OA cases and 47,581,100.9 (95% UI: 42,638,857.2–52,684,415.2) prevalent cases, representing increases of 80.3% and 90.3%, respectively, compared to 1990. Age-standardized rates in 2021 were 668.49 (95% UI: 591.69–739.57) for ASIR, 8,686.57 (95% UI: 7,789.66–9,568.34) for ASPR, and 310.78 (95% UI: 149.65–627.25) for ASYR per 100,000 population, reflecting increases of 6.7%, 5.6%, and 5.2% since 1990. Despite larger relative increases in males, females maintained higher absolute numbers and age-standardized rates for all metrics in 2021 (Table I).
Table I
All-age and age-standardized incidence, prevalence, and YLDs cases and rates in 1990 and 2021 for osteoarthritis in the United States
Geographic burden across U.S. states
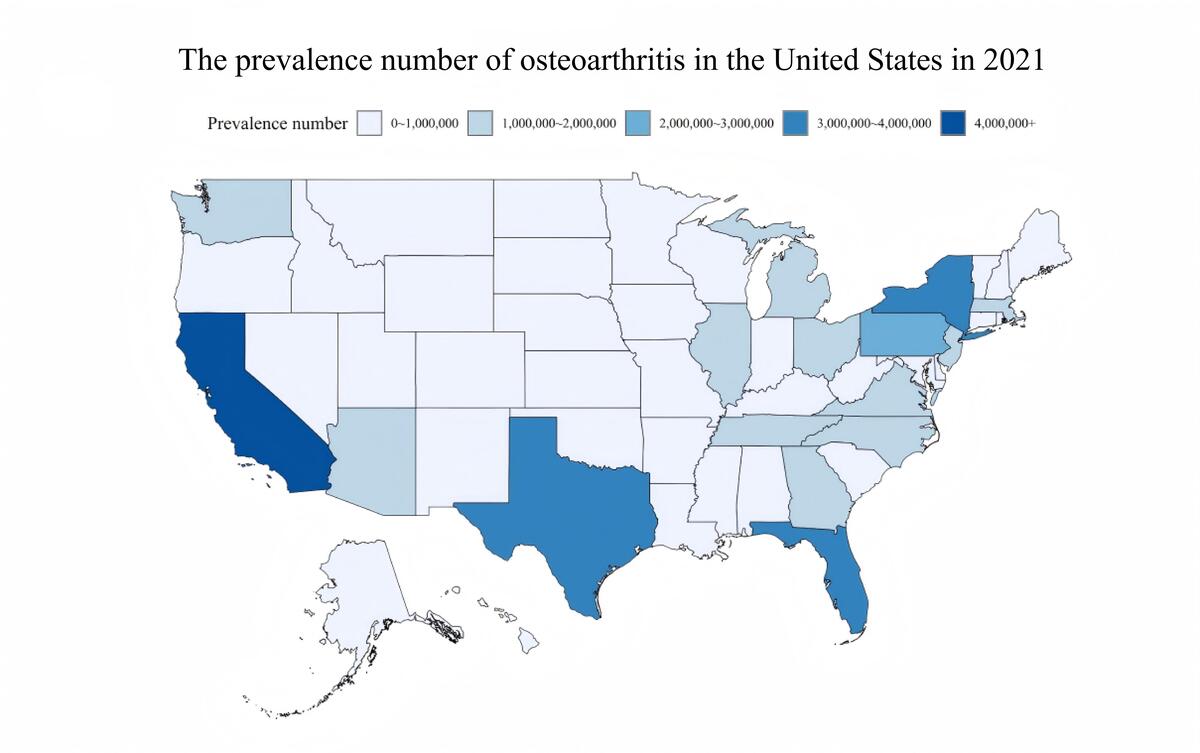
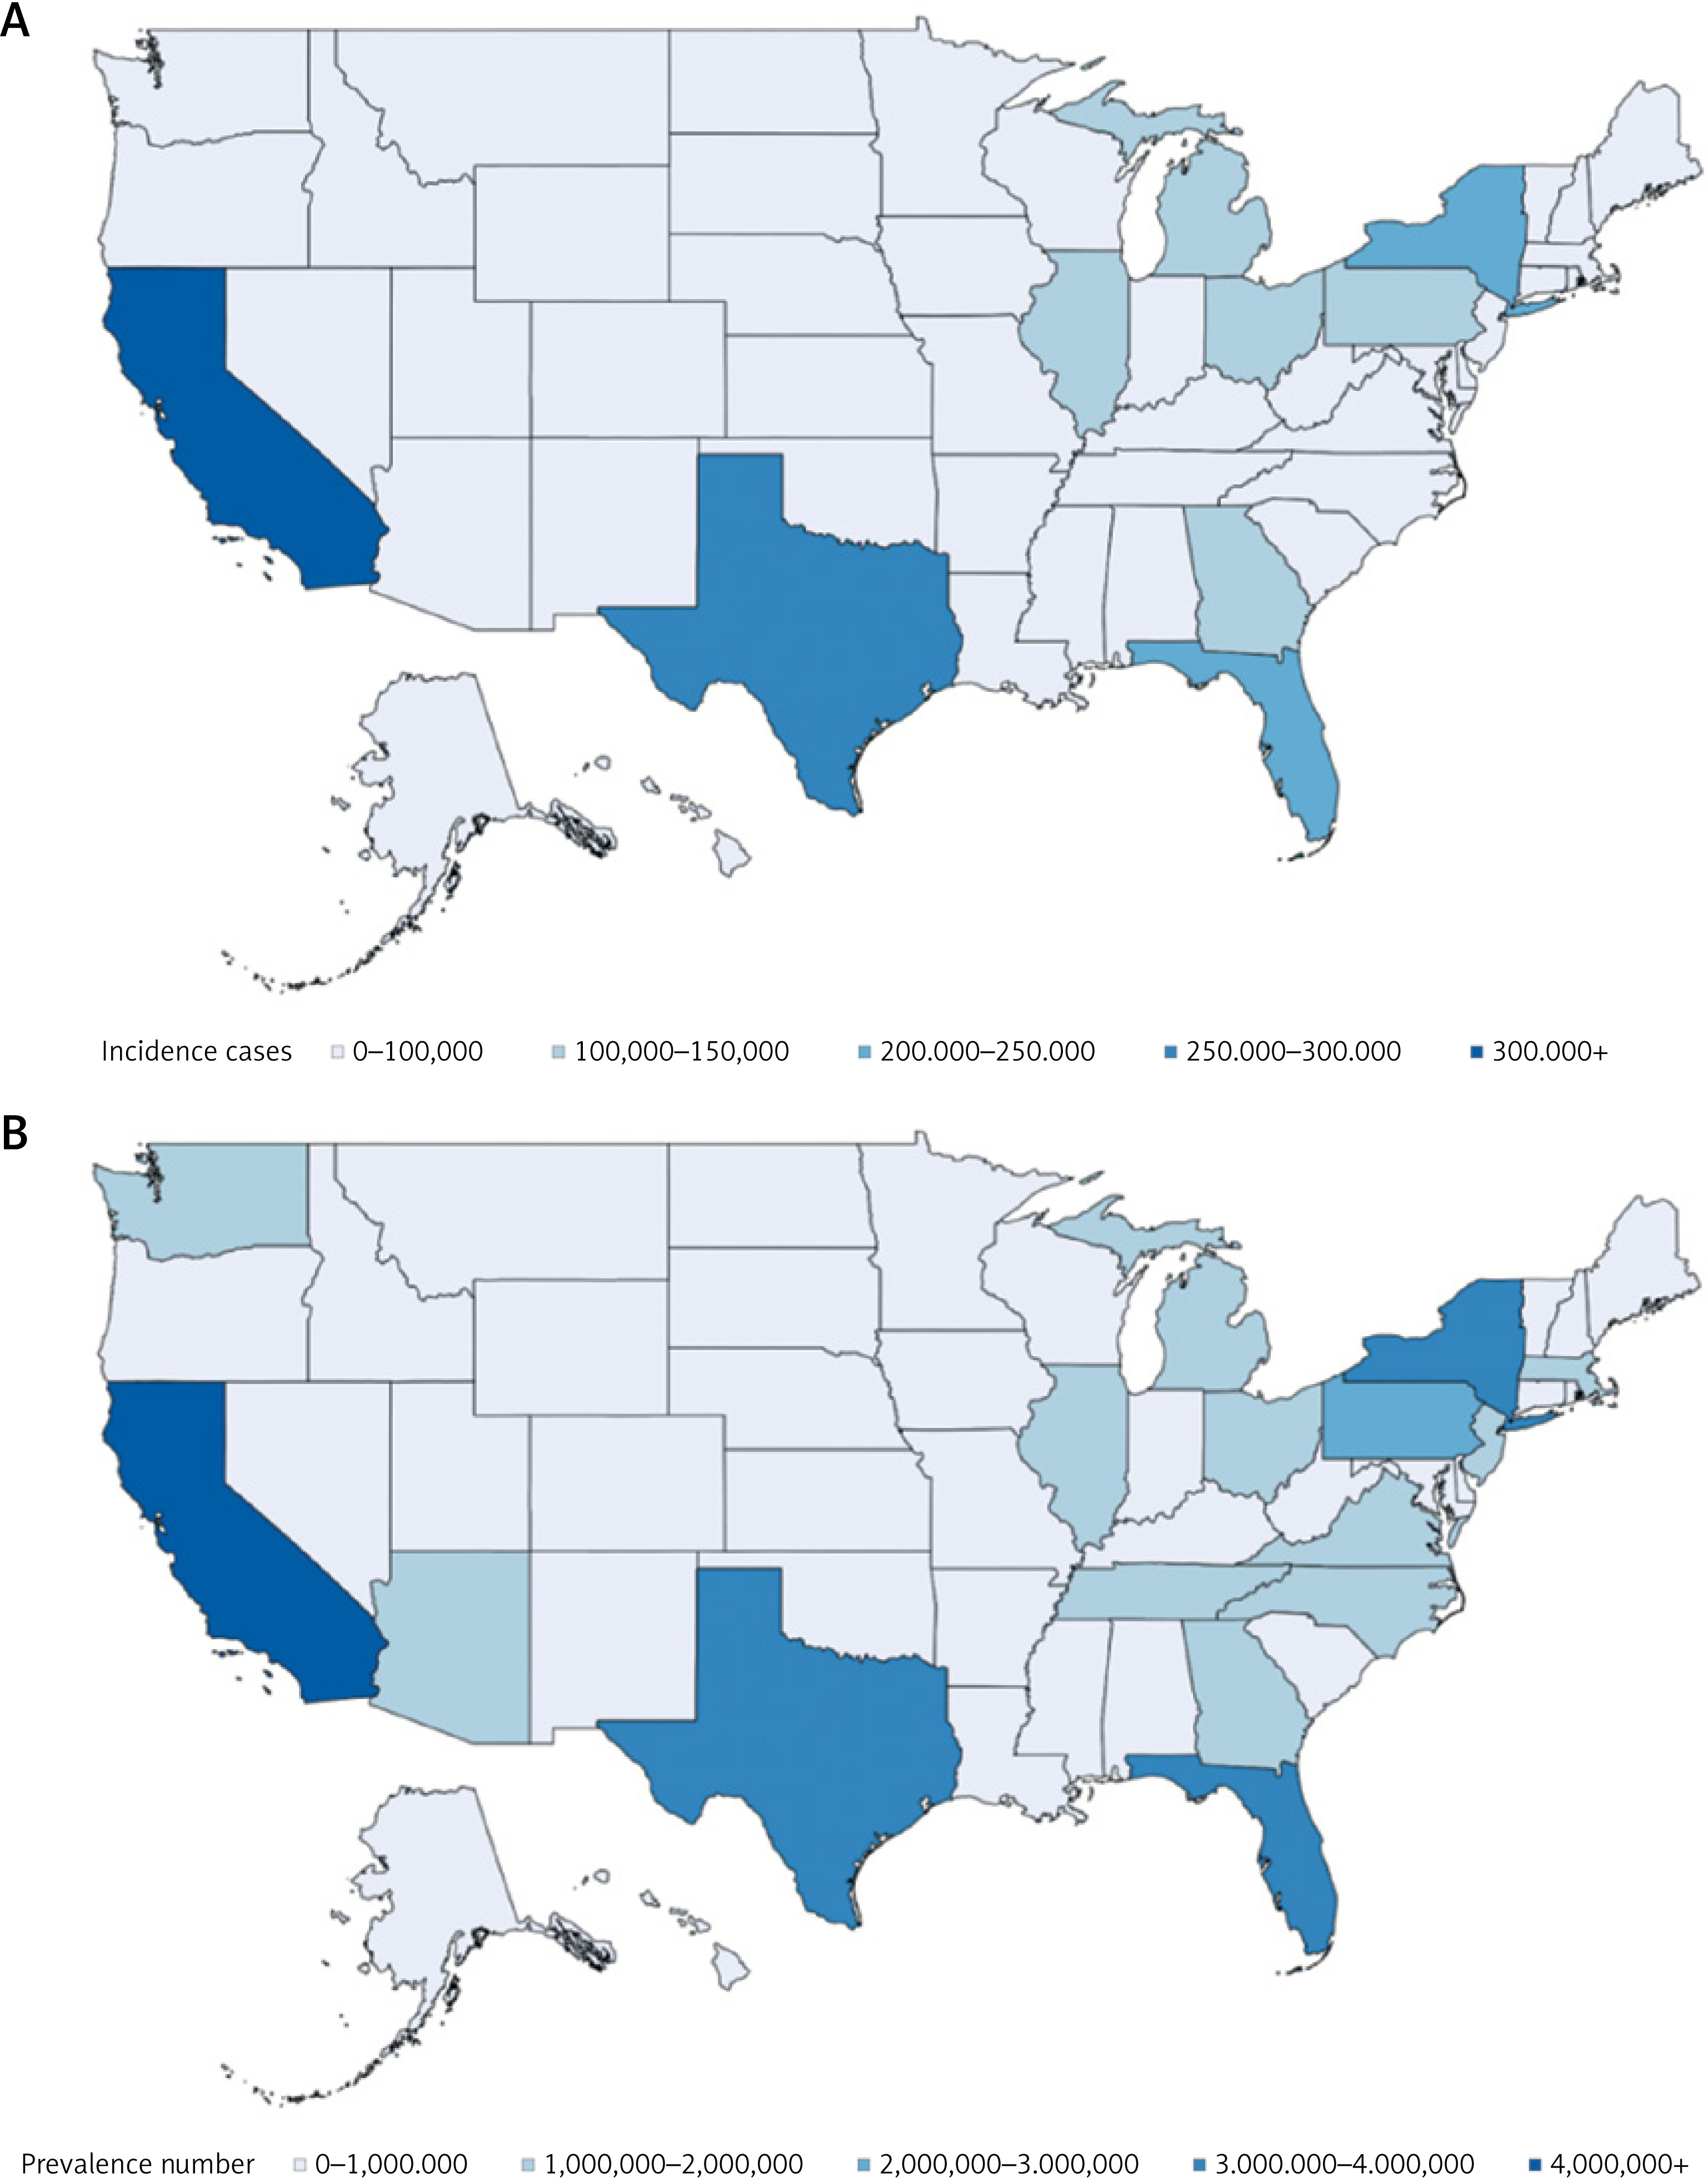
California reported the highest absolute OA burden in 2021, with 336,619.2 (95% UI: 297,132.8–377,302.1) incident cases and 4,822,420 (95% UI: 4,298,130.6–5,391,464.2) prevalent cases, followed by Texas and Florida. Wyoming had the lowest incidence, while the District of Columbia had the lowest prevalence. However, Pennsylvania exhibited the highest age-standardized rates for incidence (748.74, 95% UI: 663.3–830.8), prevalence (9,738.88, 95% UI: 8,766.9–10,734.7), and YLDs (352.89, 95% UI: 169.5–707.6) per 100,000, whereas California showed the lowest rates (Figure 2; Supplementary Table SI).
Age- and sex-specific patterns
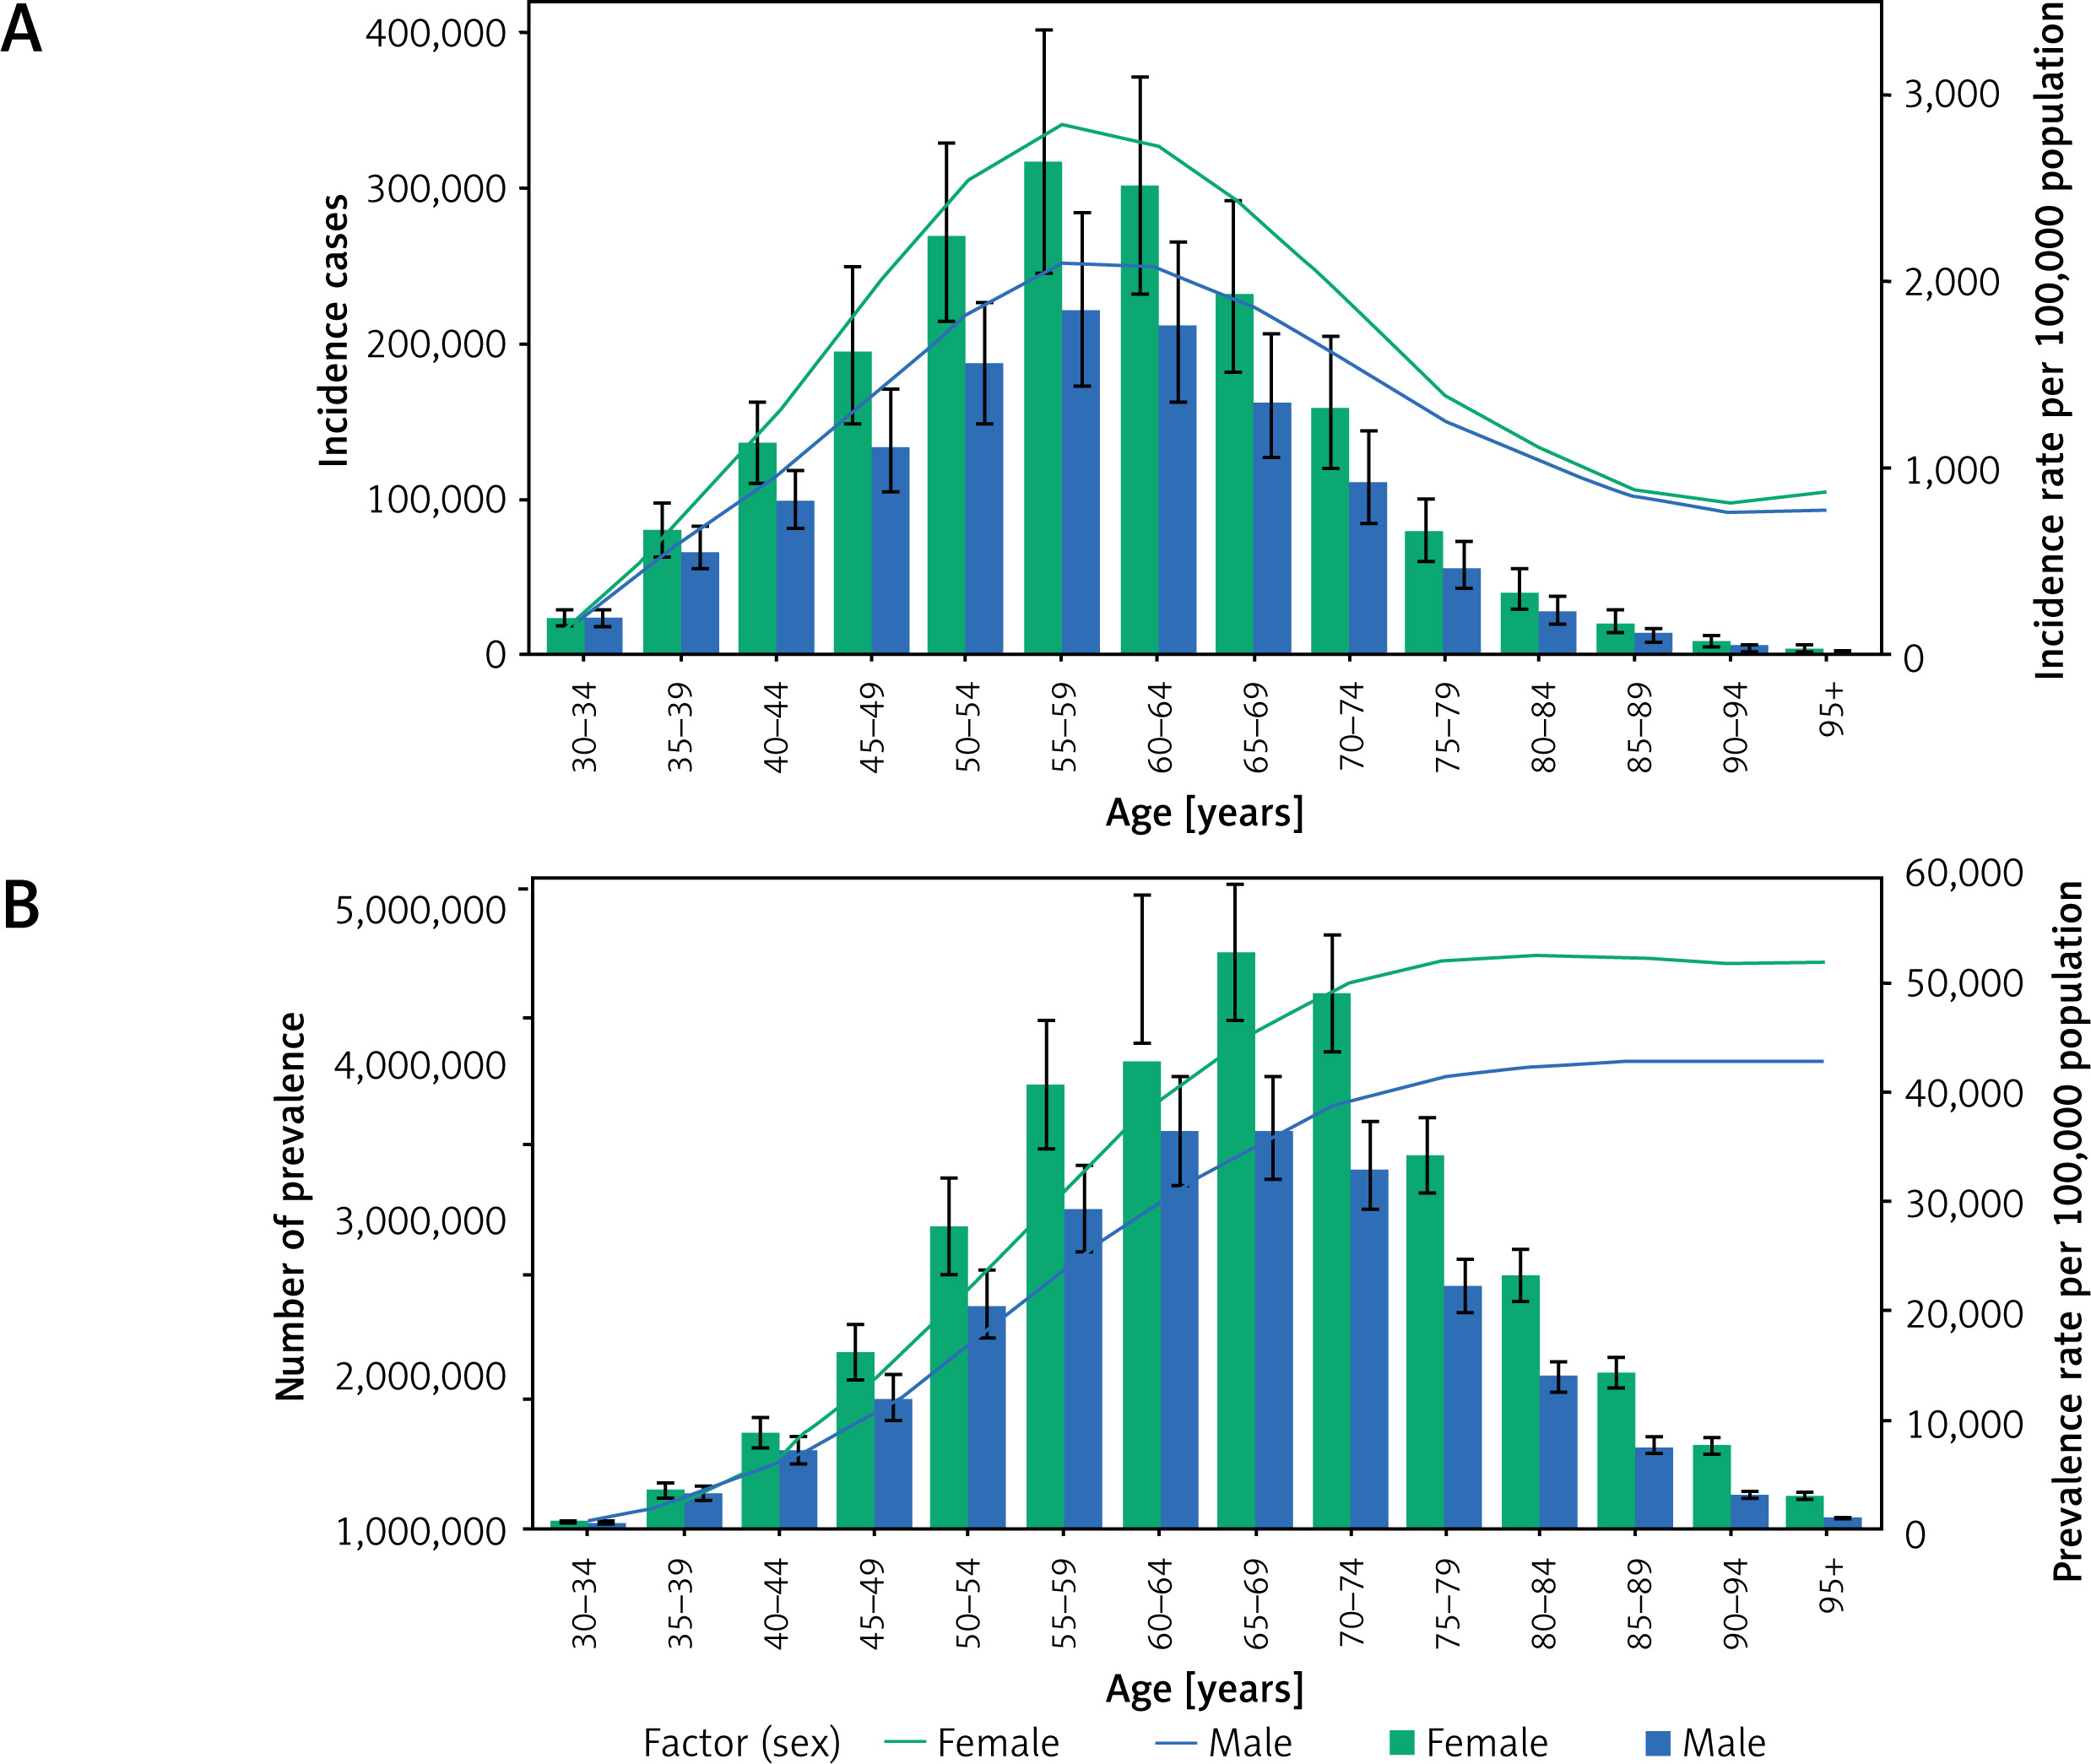
In 2021, females had higher incidence and prevalence than males across all age groups. Incidence numbers and rates for both sexes increased steadily from ages 30–34, peaked at 55–59 years, and subsequently declined (Figure 3 A). Prevalent case numbers followed a similar trajectory, peaking at 65–69 years before decreasing, while prevalence rates plateaued at high levels after age 75–79 (Figure 3 B).
Etiological contributions to YLDs
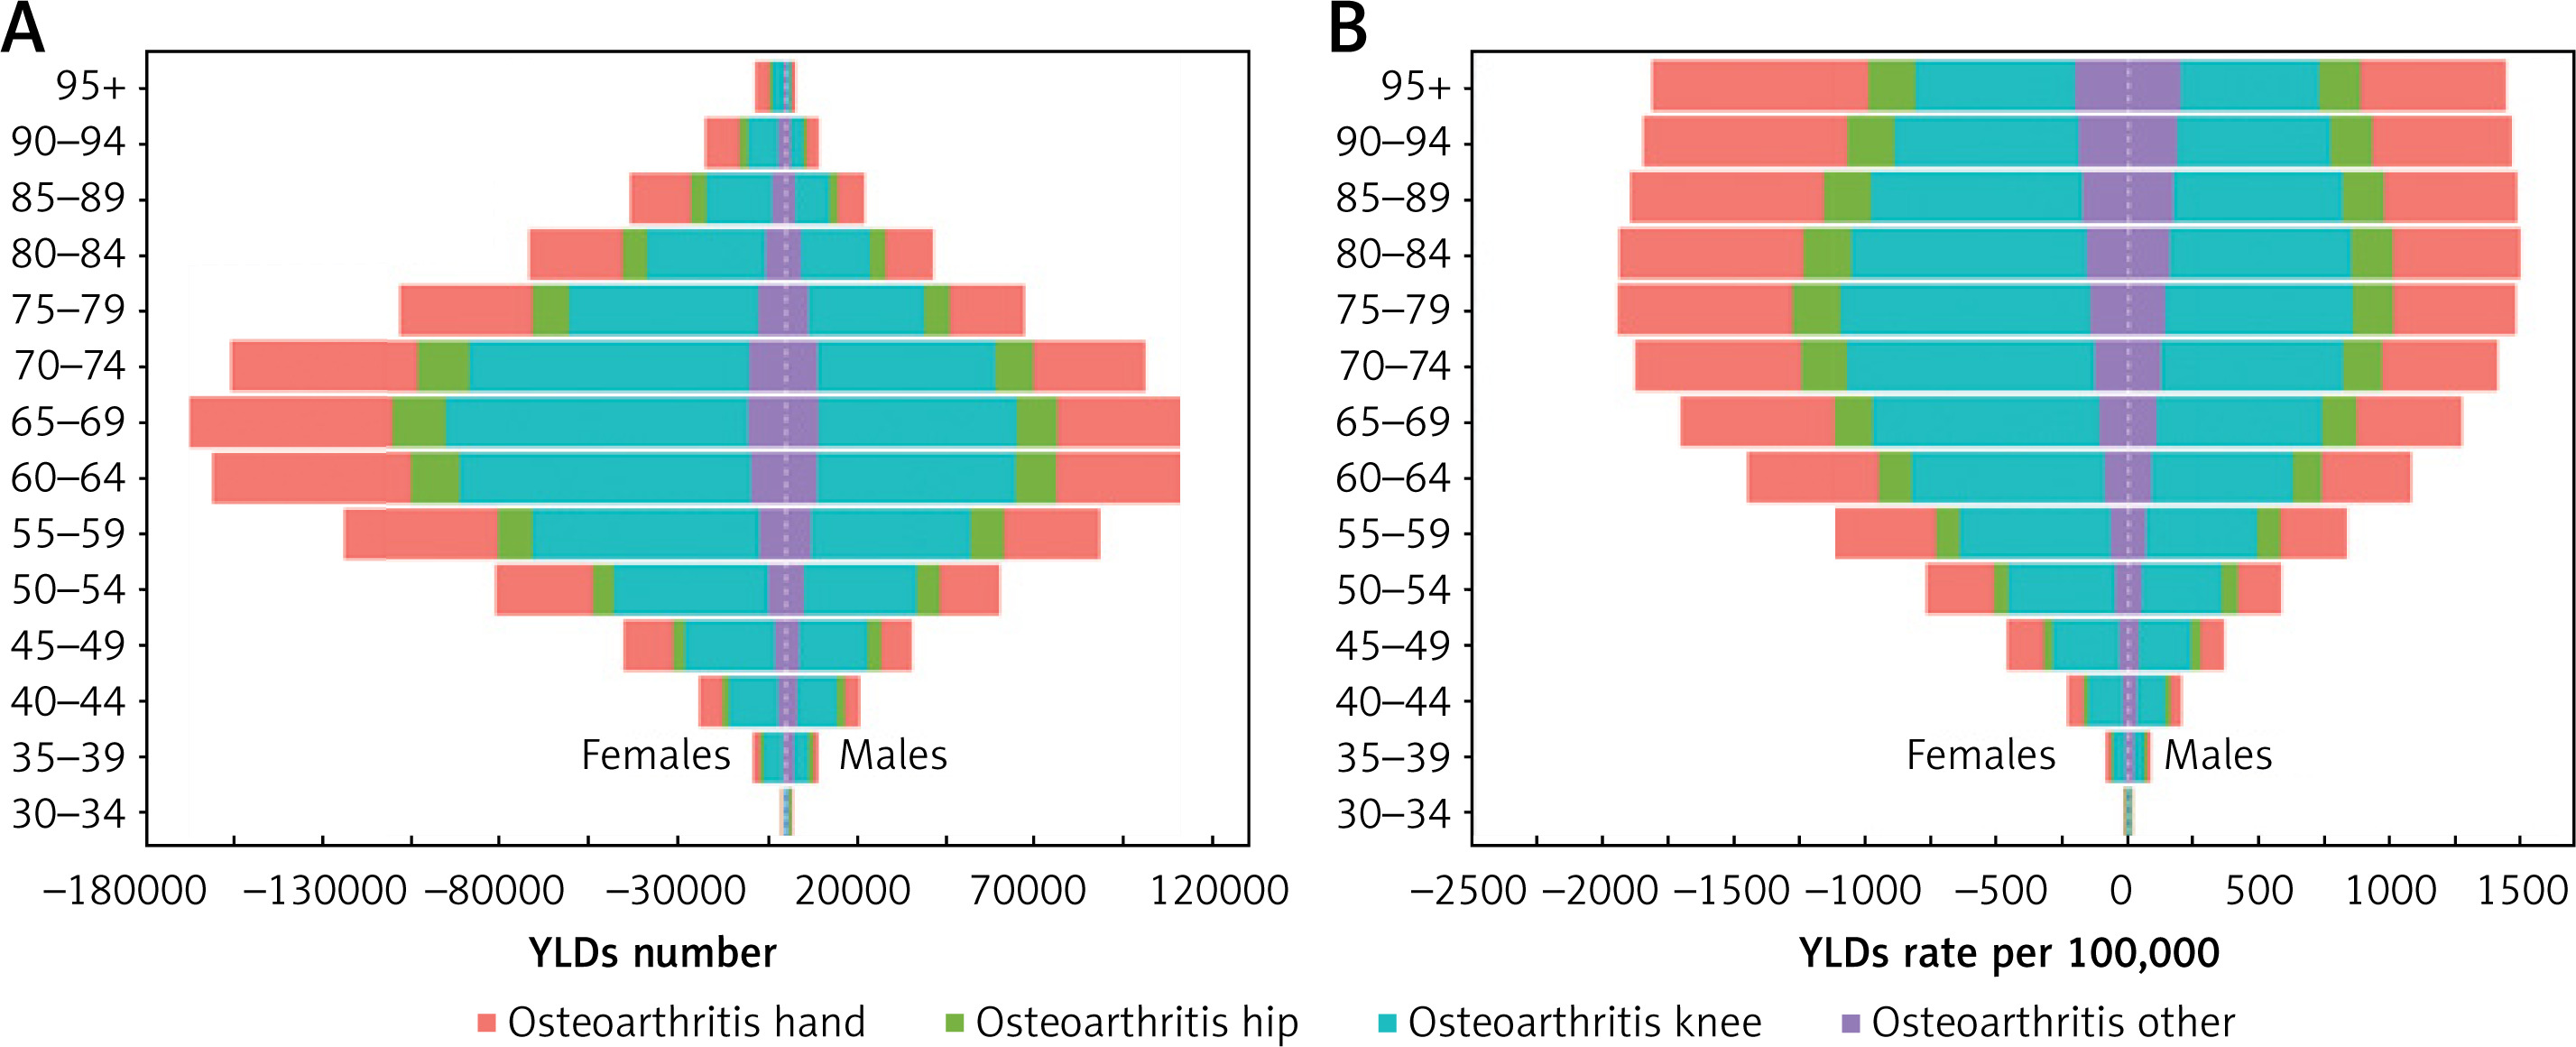
Females consistently experienced higher YLD numbers and rates than males across all age groups (Figure 4). Knee OA accounted for the largest proportion of YLDs in all age groups, followed by hand and hip OA, with “other OA” contributing the least. Both sexes exhibited peak YLD numbers in the 65–69 age group. For YLD rates, knee OA dominated in females until ages 85–89, after which hand OA became predominant in the 90–94 and 95+ groups. Among males, knee OA remained dominant except in the 95+ age group. Females showed the highest YLD rates at 75–79 years, while males peaked at 80–84 years, with minimal subsequent changes.
Decomposition analysis
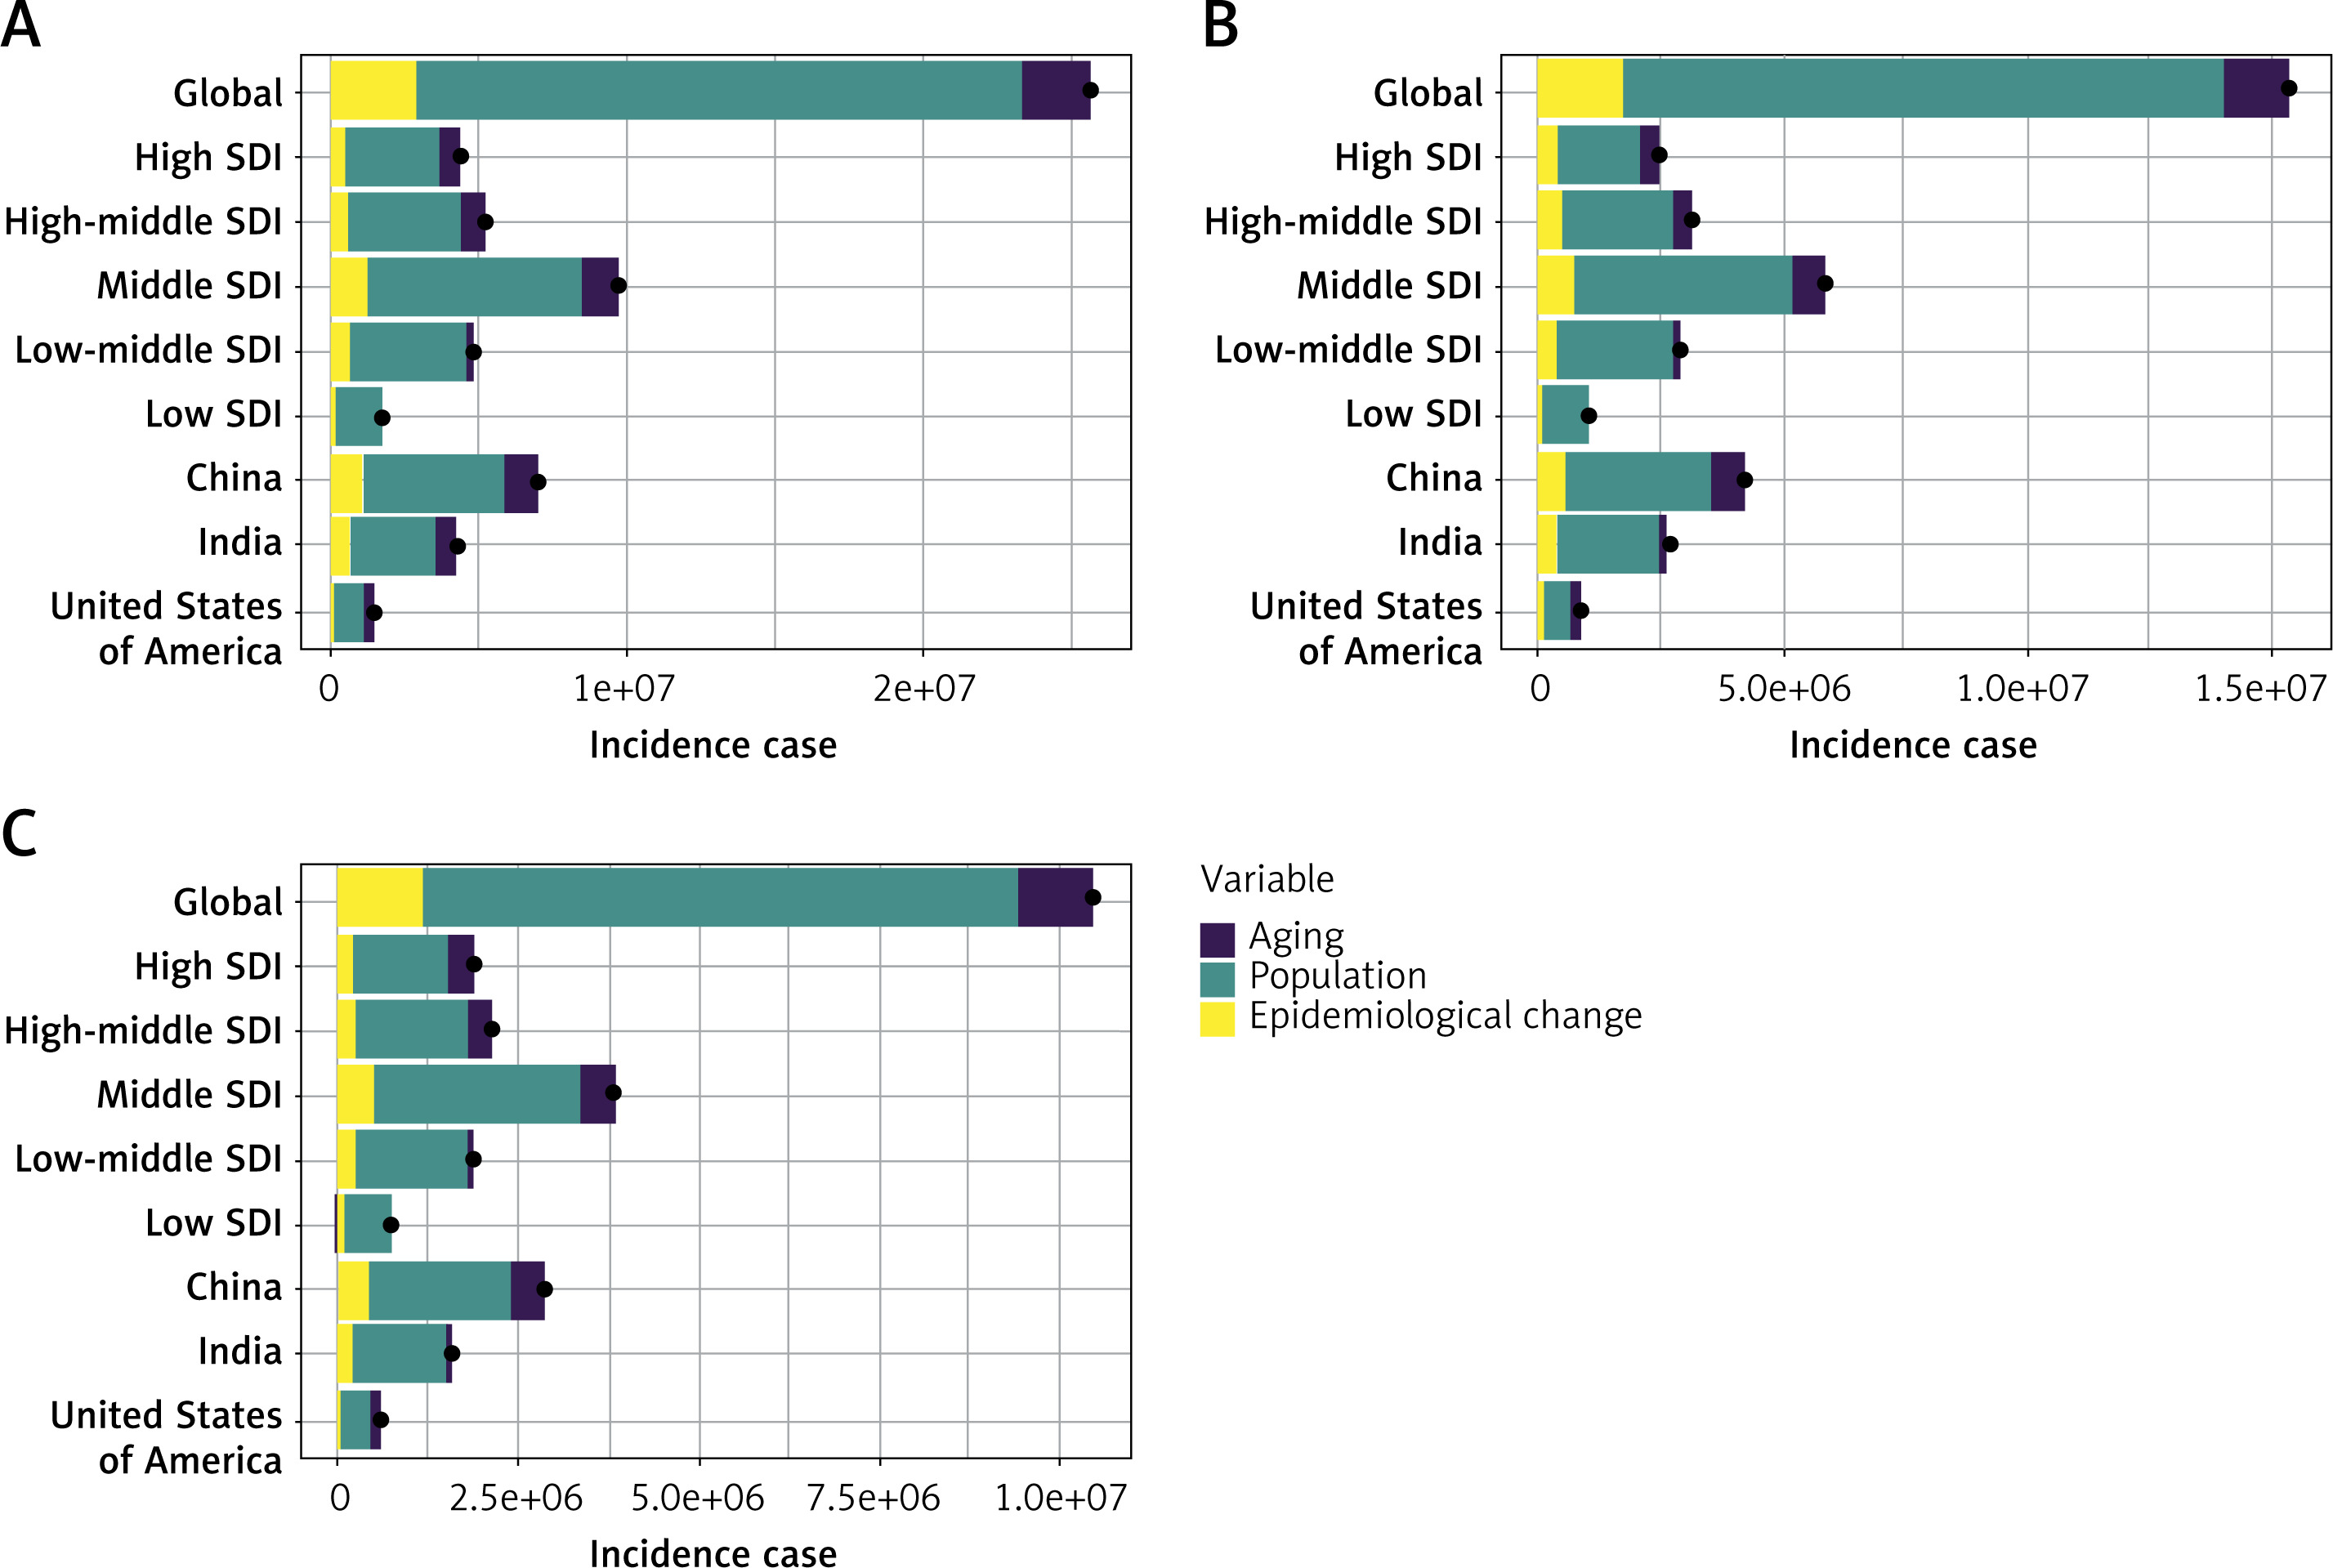
Decomposition of OA incidence drivers from 1990 to 2021 revealed global increases across all SDI regions, China, India, and the U.S., though the U.S. rise was less pronounced than those in China and India. Population growth contributed most substantially to U.S. incidence increases (67.55% for both sexes; 69.94% for males), followed by aging (21.28% for both sexes), while epidemiological changes had a minimal impact (7.83% for both sexes) (Figure 5; Supplementary Table SII).
Figure 5
Decomposition of changes in incidence of osteoarthritis globally, SDI regions, China, India, and United States: Both sexes (A), Female (B), and Male (C). A positive magnitude indicates an increase in numbers attributable to the component, a negative magnitude indicates a decrease in attribution, and a black point represents the overall number
Discussion
The present study provides a comprehensive assessment of OA burden in the U.S. from 1990 to 2021 using GBD 2021 data. Our findings reveal a substantial increase in OA incidence, prevalence, and YLDs over three decades, with persistent sex disparities, geographic heterogeneity, and age-specific patterns. The rising burden, driven predominantly by population growth and aging, underscores the urgent need for targeted interventions addressing modifiable risk factors and health system inequities.
The disparities in osteoarthritis burden across U.S. states reflect complex interactions among demographic structures, economic conditions, and public health policies. California, with the nation’s largest population (> 39 million) [18], reported the highest absolute number of prevalent cases (4.82 million). However, its robust healthcare system – supported by California’s status as the world’s fifth-largest economy, a $6.4 billion healthcare bond passed in 2024 [19], and improved rural healthcare access–likely contributed to its relatively low age-standardized incidence rates. In contrast, Pennsylvania’s elevated age-standardized incidence, prevalence, and YLD rates may stem from accelerated population aging (25% of residents aged > 60 years) [20], healthcare resource strains due to outmigration, and insufficient prioritization of chronic disease management during economic transitions. Despite accounting for 80% of Pennsylvania’s healthcare costs and hospitalizations [21], chronic diseases such as OA remain under-addressed, as highlighted in the state’s 2021 Chronic Disease Burden Report [22]. We recommend targeted occupational protection policies for high-risk groups (e.g., manual laborers) and enhanced obesity control programs in such regions.
Consistent with prior studies [23], our findings demonstrate a persistent female predominance in OA burden across all age groups. This disparity may arise from sex-specific pathophysiological differences (e.g., greater radiographic severity in females) and social factors such as disproportionate engagement in caregiving and household labor, which increase joint stress [24, 25]. Age emerged as a key predictor of OA, with incidence peaking at 55–59 years – a pattern potentially linked to estrogen decline during menopausal transition [26]. Estrogen exerts potential chondroprotective effects in OA pathogenesis [27], primarily through its anti-inflammatory properties that shield chondrocytes from degenerative processes [28]. The intricate interplay between estrogen, estrogen receptors, and estrogen-related receptors constitutes a central mechanism in OA development. Notably, Interleukin-1 beta (IL-1b) – a pivotal mediator in OA progression – stimulates ERR activation. Elevated ERR levels subsequently upregulate matrix metalloproteinase-3 (MMP-3) and MMP-13 expression, thereby accelerating cartilage matrix degradation [29]. The persistent prevalence plateau after age 75 likely reflects OA’s irreversible structural damage and limited treatment efficacy in advanced disease. The sustained rise in prevalence rates with age aligns with OA’s cumulative nature, driven by progressive joint degeneration and sarcopenia.
Knee OA dominated disability burdens across age groups, consistent with its predilection for weight-bearing joints. The Johnston County Osteoarthritis Project in the U.S. reported knee/hip OA in 28% of African American and White adults [30], while global studies have highlighted disproportionate knee OA burdens among postmenopausal women [17]. Notably, the transition to hand OA dominance in females aged ≥ 90 years may result from cumulative polyarticular involvement and survivorship bias. Avoiding joint injuries is a controllable risk factor since repeated usage of joints is associated with an increased risk of OA [30]. Repeated joint use and modifiable risk factors (e.g., obesity) underscore the importance of preventive measures such as weight management, low-impact exercise, and joint protection education outlined in clinical guidelines [24].
Decomposition analysis revealed that while the U.S. ranked third globally in OA incidence growth (2021), its increase lagged behind China and India. Population expansion (67.55% contribution) and aging (21.28%) were primary drivers, suggesting limited progress in risk factor control, emphasizing the need for multi-tiered interventions. At the population level, community-based weight-loss programs (e.g., following the National Diabetes Prevention Program model) should be implemented to reduce obesity rates [31], alongside injury prevention strategies for sports, occupational hazards, and accidental falls. At the individual level, patient education, self-management programs, and promotion of low-impact aerobic activities should be strengthened. Additionally, electronic health records should be integrated with environmental data to address currently unmapped risk factors. In conclusion, a comprehensive approach combining population-level strategies, clinical interventions, and advanced data integration is essential for effective OA management and prevention in the United States.
This study has several limitations. First, potential biases inherent to GBD’s modeled data may affect estimates. Second, while high BMI is a known OA risk factor, the GBD 2021 dataset lacks comprehensive data on BMI-attributable OA prevalence and other risk factor contributions in the U.S. context, limiting our ability to analyze these relationships. Third, our study could not account for several important epidemiological factors (e.g., physical activity levels, and socioeconomic determinants) due to data unavailability in the GBD framework. Fourth, GBD 2021 excludes data for individuals under 30 years, limiting our analysis to older age groups. Finally, occupational risk stratification was not addressed, though occupational exposures significantly influence OA development. These gaps highlight the need for future studies incorporating more comprehensive risk factor data to fully understand OA burden determinants.
In conclusion, the present study provides a comprehensive assessment of OA burden in the U.S. from 1990 to 2021 using GBD 2021 data. Our findings reveal a substantial increase in OA incidence, prevalence, and YLDs over three decades, with persistent sex disparities, geographic heterogeneity, and age-specific patterns. The rising burden, driven predominantly by population growth, underscores the urgent need for targeted interventions addressing modifiable risk factors and health system inequities.

