Introduction
Tuberculosis (TB) is chronic infectious disease caused by Mycobacterium tuberculosis (M. tuberculosis). This is a disease of the lungs, mostly seen in the form of pulmonary type tuberculosis (PTB), which can easily be spread to others by coughing and breathing. Despite the availability of various effective treatment strategies, recent figures from 2014 show that TB is once more on the increase; globally, there is a large burden of the disease with ~9.6 million new cases and ~1.5 million reported deaths [1].
Nearly one-third of the world’s population is thought to be affected with M. tuberculosis, but a large proportion of the population have no clinical symptoms of the disease. However, the remaining 5–15% of the population is affected with the active disease, as demonstrated by culturable bacilli from the sputum and other clinical symptoms [2]. This indicates that besides the mycobacteria itself, the host genetic factors may also determine the differences in host susceptibility to TB [3]. Earlier reports involving candidate gene approach and genetic association studies have identified various host genetic factors that affect the susceptibility in a variety of diseases [4–6]. So, the identification of host genes and genetic variations that play significant role in susceptibility and resistance to TB would help in understanding the pathogenesis of the disease and perhaps lead to new approaches of treatment or prophylaxis.
Cytokines, and their genes and receptors, have been implicated in the protective immunity, and also associated with pathological severity with altered circulating levels of pro-inflammatory and down-regulatory cytokines in TB [7]. In general, TB infects mainly macrophages in lungs, and Th1-mediated immunity is considered as protective response against M. tuberculosis. The human interferon γ gene (IFNγ) is located on chromosome 12 (12q14) and has four exons spanning about 6 kb. Interferon γ (IFN-γ) encoded by IFN-γ (also called IFNG) is a key T helper (type-1) cytokine produced by natural killer (NK) cells and T cells. The production of IFN-γ is essential in innate immunity and plays a pivotal role in macrophage activation for eliminating Mycobacterium infection [8]. A previous study reported that malfunction of the IFN-γ gene may lead to infection of M. tuberculosis [9]. Single nucleotide polymorphisms (SNPs) present in the promoter or coding regions of cytokine genes result in altered transcriptional function and differential cytokine secretion. Also, the inter-individual variations in IFN-γ production are genetically contributed by polymorphisms within the promoter or coding region.
An SNP located in the +874 A>T (rs2430561) position in the first intron of the IFN-γ gene comprises the binding site for the transcription factor NFκB, which putatively influences the gene expression and secretion of the cytokine, which has a significant impact on infection outcome. It has been reported that TB patients with the homozygous allele A combination produce significantly lower level of IFN-γ in comparison to individuals carrying one or two copies of allele T [10]. This polymorphism also displays variable associations with TB disease susceptibility and severity [11]. These studies demonstrated the importance of these cytokines in the development of TB infection and suggested that this genetic variant of the IFN-γ gene could account for the differences in TB susceptibility.
After considering the functional significance of this genetic variant, a number of case-control studies in recent years have assessed the association of IFN-γ +874 A>T gene polymorphism with PTB development in different populations. Results from these studies have shown mixed findings, and it is still unclear whether this polymorphism is associated with increased or decreased susceptibility to PTB [10, 12–32]. A probable reason to clarify the noted inconsistencies in the outcomes is the inadequate statistical power of the individual studies in which non-homogenous populations and individuals from different ethnicities were included. To overcome this situation, nowadays a meta-analysis statistical tool is used to explore the risk factors associated with the genetic diseases, as it employs a quantitative method of combining the data drawn from individual studies where sample sizes are too small to produce reliable conclusions [33]. Therefore, we carried out this meta-analysis to assess the effect of IFN-γ +874 A>T gene polymorphism on the risk of PTB infection.
Material and methods
Strategy for literature search
Online web-databases, i.e. PubMed, Medline, EMBASE, and Google Scholar online, were searched for published research articles covering a combination of the following key words: IFN-γ, IFNγ gene, IFNG, interferon gamma gene (polymorphism OR mutation OR variant) AND tuberculosis susceptibility or TB or pulmonary tuberculosis or PTB (last updated on January 2017). We identified the potentially relevant genetic association studies by reading their titles and abstracts, and procured the most pertinent publications matching the pre-eligible criteria for a closer examination. In addition to the above-mentioned online database search, the references given in the selected research articles were also scrutinised for other potential articles that may have been missed in the preliminary search.
Criteria for inclusion and exclusion of the studies
In order to reduce heterogeneity and facilitate the apt interpretation of this pooled analysis, the published articles included in the present meta-analysis had to cover all the given criteria, as follows: a) they had to have reported case-control studies between IFN-γ +874 A>T gene polymorphism and PTB risk, b) they had to include clearly described confirmed PTB patients and PTB-free controls, d) they had to have available genotype frequency in both the cases and the controls, e) they had to be published in the English language, and f) the data collection and the analysis method had to be acceptable from a statistical point of view. Additionally, when the case-control study was involved in more than one research article using the same case series, we selected the research study that included the largest number of individuals. The major criteria for study exclusion were: a) overlapping or duplicate publication, b) the study-design based on only PTB cases, c) genotype frequency not reported, and d) data from review articles or abstracts.
Data extraction
For each retrieved research publication, the methodological quality evaluation and data extraction were independently abstracted in duplicate by two independent investigators (MYA and RKM) using a standard process. Standard data-collection form was used to endorse the precision of the collected data from individual studies by stringently following the pre-set inclusion criteria as mentioned above. The main characteristics abstracted from the retrieved publications comprised the name of the first author, the year of publication, the country of origin, the source of cases and controls, the number of cases and controls, the study type, and the genotype frequencies. Cases related with disagreement/discrepancy on any item of the data from the selected studies were fully deliberated with the investigators to reach a final unanimous agreement. In case failure to reach a consensus between the two investigators, a mutual agreement was attained with an open discussion with the adjudicator (SH).
Quality assessment of the selected studies
Methodological quality evaluation of the selected studies was performed independently by two investigators (MYA and RKM) by following the Newcastle-Ottawa Scale (NOS) of quality assessment [34]. The NOS quality assessment criteria included three major aspects: (i) subject selection: 0–4 stars, (ii) comparability of subject: 0–2 stars, and (iii) clinical outcome: 0–3 stars. Selected case-control studies that gained five or more stars were considered as of moderate to good quality [35].
Statistical analysis
In this study, the pooled ORs and their corresponding 95% CIs were used to evaluate the strength of the association between IFN-γ +874 A>T polymorphism and susceptibility to PTB. The heterogeneity assumption was tested by the χ2-based Q-test [36] and was considered statistically significant if the p-value was < 0.05 (means Q-test revealed a lack of heterogeneity among the selected studies). The data from single comparisons were pooled using a fixed effects model [37] when no heterogeneity was detected. Otherwise (in case of significant heterogeneity), the random-effects model [38] was applied for pooling of the data (ORs). In order to assess the ethnicity specific effect, sub-group analyses were performed by ethnic group. Furthermore, I 2 statistics was used to measure the inter-study variability ranging between 0 and 100%, wherein 0% indicates no observed heterogeneity and larger values 25%, 50%, and 75%, correspond to small, moderate, and high levels of heterogeneity, respectively [39]. The Hardy-Weinberg equilibrium (HWE) in the control group was calculated using the χ2 test. Publication bias was evaluated using the funnel plot, wherein the standard error of log (OR) for each study was plotted against its log (OR) [40]. Furthermore, the Egger’s linear regression test was used to measure the association between the mean effect estimate and its variance [41]. The significance of the intercept was measured by the t-test considering a p-value < 0.05 as a representation of statistically significant publication bias. Before the statistical analysis, a comparative appraisal of ‘meta-analysis’ software programs was performed by using the web-link: http://www.meta-analysis.com/pages/comparisons.html. The Comprehensive Meta-Analysis (CMA) Version 2 software program (Biostat, NJ, USA) was used to perform all the statistical analysis involved in this meta-analysis.
Results
Characteristics of the studies included in this meta-analysis
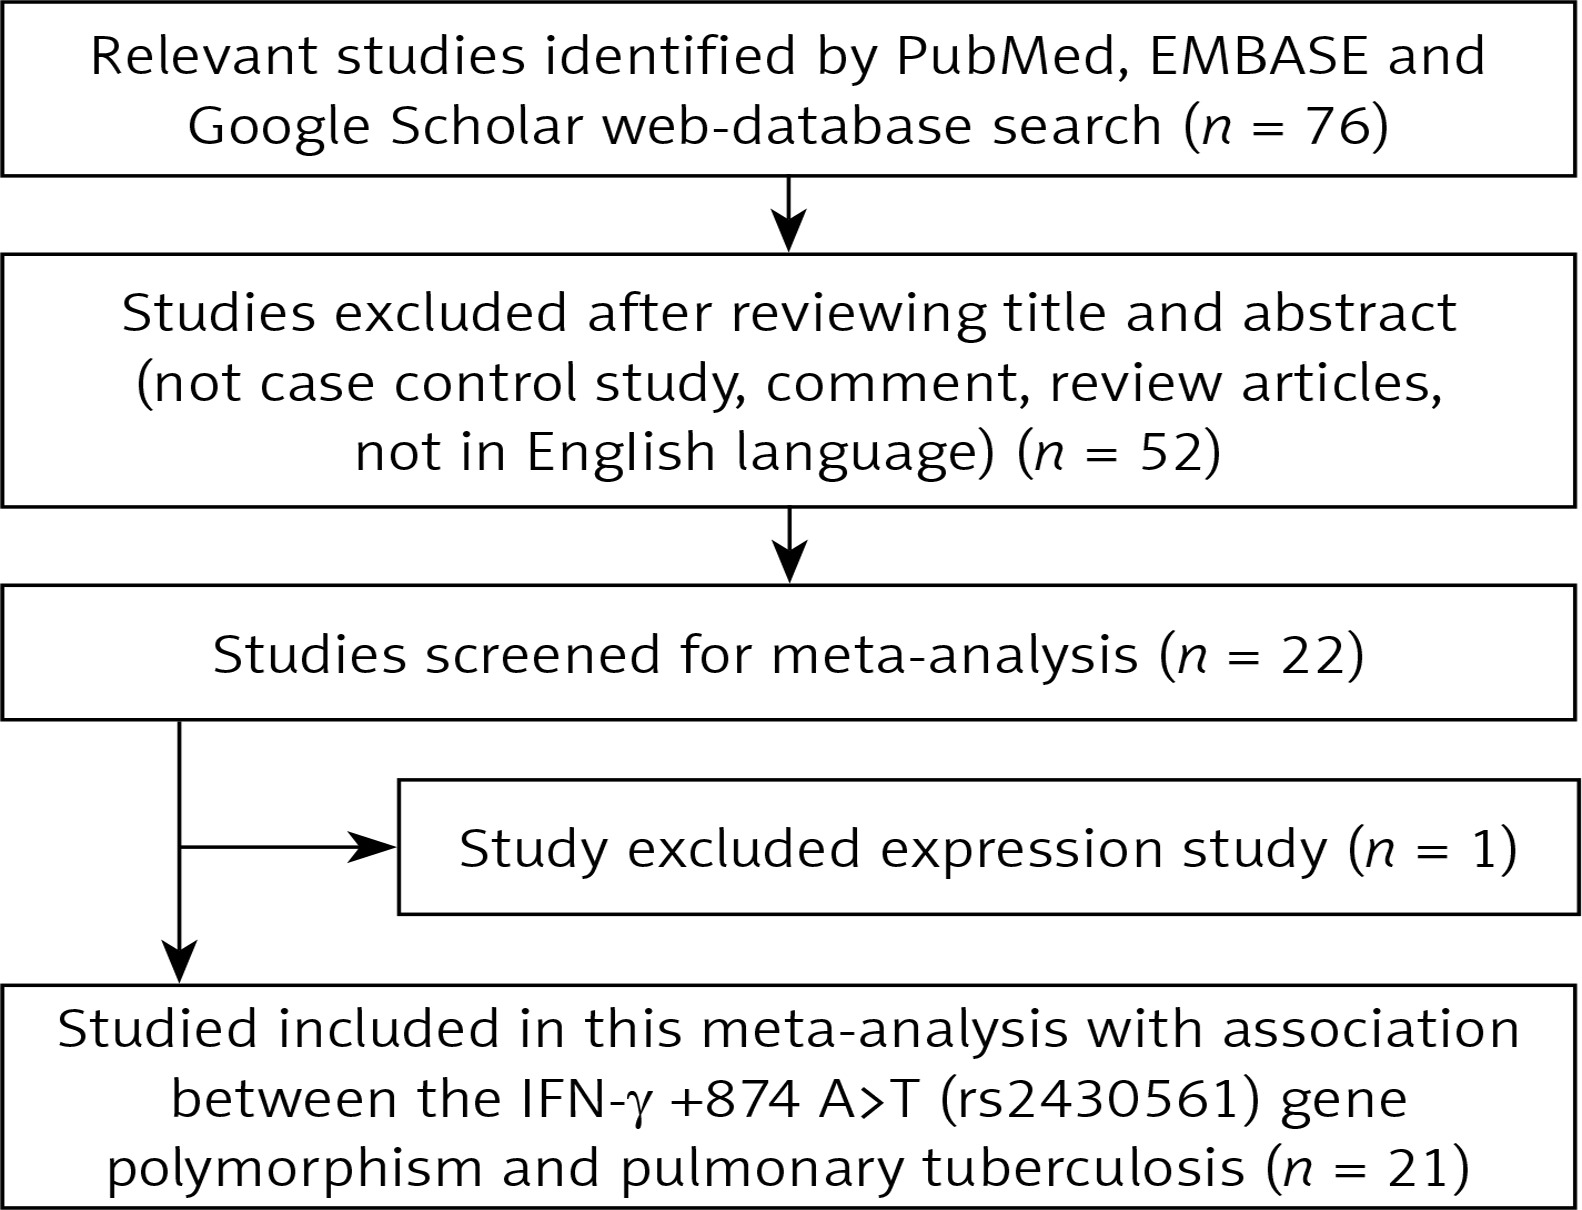
A systematic flow-diagram displaying the selection of published studies following the pre-set inclusion and exclusion criteria is shown in Figure 1. After many levels of screening (as per the pre-set inclusion and exclusion criteria of study selection) a total of 21 case-control research publications were finally selected after a literature search of the PubMed (Medline), EMBASE, and Google Scholar web-databases [12–32]. Research publication either reporting IFN-γ +874 A>T polymorphism to predict survival in PTB patients or considering genetic variants as indicators for response to therapy were disqualified straightaway. Likewise, studies exploring the levels of IFN-γ mRNA or protein expression or pertinent review articles were also eliminated from this study. We incorporated only case-control or cohort design studies mentioning the frequency of all three genotypes. Moreover, the supporting references listed in the retrieved research publications were also scrutinised for other pertinent research publications. After cautious screening, the detailed characteristics of 23 studies from 21 eligible original published research articles included in this meta-analysis are provided in Table I. Distribution of genotypes, HWE p-values in the controls, and susceptibility towards PTB are shown in Table II. All the selected 21 studies were inspected for their quality following the Newcastle-Ottawa Scale (NOS) and most of the studies (80%) scored five stars or more, indicating moderate to good quality (Table III).
Table I
Main characteristics of all studies included in the meta-analysis
| First author and year [Ref. No] | Country | Ethnicity | Control | Cases | Study | Association |
|---|---|---|---|---|---|---|
| Hu et al., 2015 [12] | China | Asian | 480 | 120 | PB | No risk |
| Mabunda et al., 2015 [13] | Brazil | Mixed | 456 | 102 | HB | No risk |
| Shen et al., 2013 [14] | China | Asian | 164 | 69 | PB | No risk |
| Selma et al., 2011 [15] | Tunisia | African | 150 | 168 | HB | AA genotype risk |
| Hashemi et al., 2011 [16] | Iran | Asian | 166 | 142 | HB | AA genotype risk |
| Ansari et al., 2011 [17] | Pakistan | Asian | 166 | 102 | PB | No risk |
| Vallinoto et al., 2010 [18] | Brazil | Mixed | 156 | 129 | HB | No risk |
| Wang et al., 2010 [19] | China | Asian | 527 | 522 | PB | No risk |
| Anand et al., 2010 [20] | India | Asian | 66 | 62 | HB | No risk |
| Ansari et al., 2009 [21] | Pakistan | Asian | 188 | 111 | HB | TT genotype risk |
| Selvaraj et al., 2008 [22] | India | Asian | 178 | 160 | HB | No risk |
| Ding et al., 2008 [23] | China | Asian | 310 | 266 | HB | AA genotype risk |
| Wu et al., 2008 [24] | China | Asian | 111 | 183 | HB | No risk |
| Hwang et al., 2007 [25] | Korea | Asian | 80 | 80 | HB | No risk |
| Moran et al., 2007 [26] | USA | Caucasian | 64 | 139 | PB | No risk |
| Moran et al., 2007a [26] | USA | African American | 174 | 204 | PB | No risk |
| Moran et al., 2007b [26] | USA | Hispanics | 98 | 270 | PB | No risk |
| Sallakci et al., 2007 [27] | Turkey | Caucasian | 115 | 319 | PB | TT genotype decreased risk |
| Cooke et al., 2006 [28] | West African | African | 594 | 667 | PB | No risk |
| Vidyarani et al., 2006 [29] | India | Asian | 127 | 129 | HB | No risk |
| Etokebe et al., 2006 [30] | Croatia | Caucasian | 519 | 179 | HB | No risk |
| López-Maderuelo et al., 2003 [31] | Spain | Caucasian | 100 | 113 | PB | AA genotype risk |
| Lio et al., 2002 [32] | Italy | Caucasian | 97 | 45 | HB | TT genotype decreased risk |
Table II
Genotypic distribution of IFN-γ +874 A>T (rs2430561) gene polymorphism included in the meta-analysis
Table III
Quality assessment conducted according to the Newcastle-Ottawa Scale for all studies included in the meta-analysis
Publication bias
Begg’s funnel plot and Egger’s test were applied to appraise the publication bias of the included studies. The shape of the funnel plot was almost symmetric (Supplementary Figure S1). The Egger’s test did not show any evidence of publication bias (Table IV).
Table IV
Statistics to test publication bias and heterogeneity in the meta-analysis: overall population
Heterogeneity analysis
In order to check heterogeneity among the selected studies, Q-test and I 2 statistics were used. The analysis revealed the presence of significant heterogeneity in all the models. Thus, a random effects model was applied to synthesise the data (Table IV) (Supplementary Figure S1).
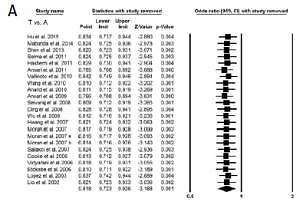
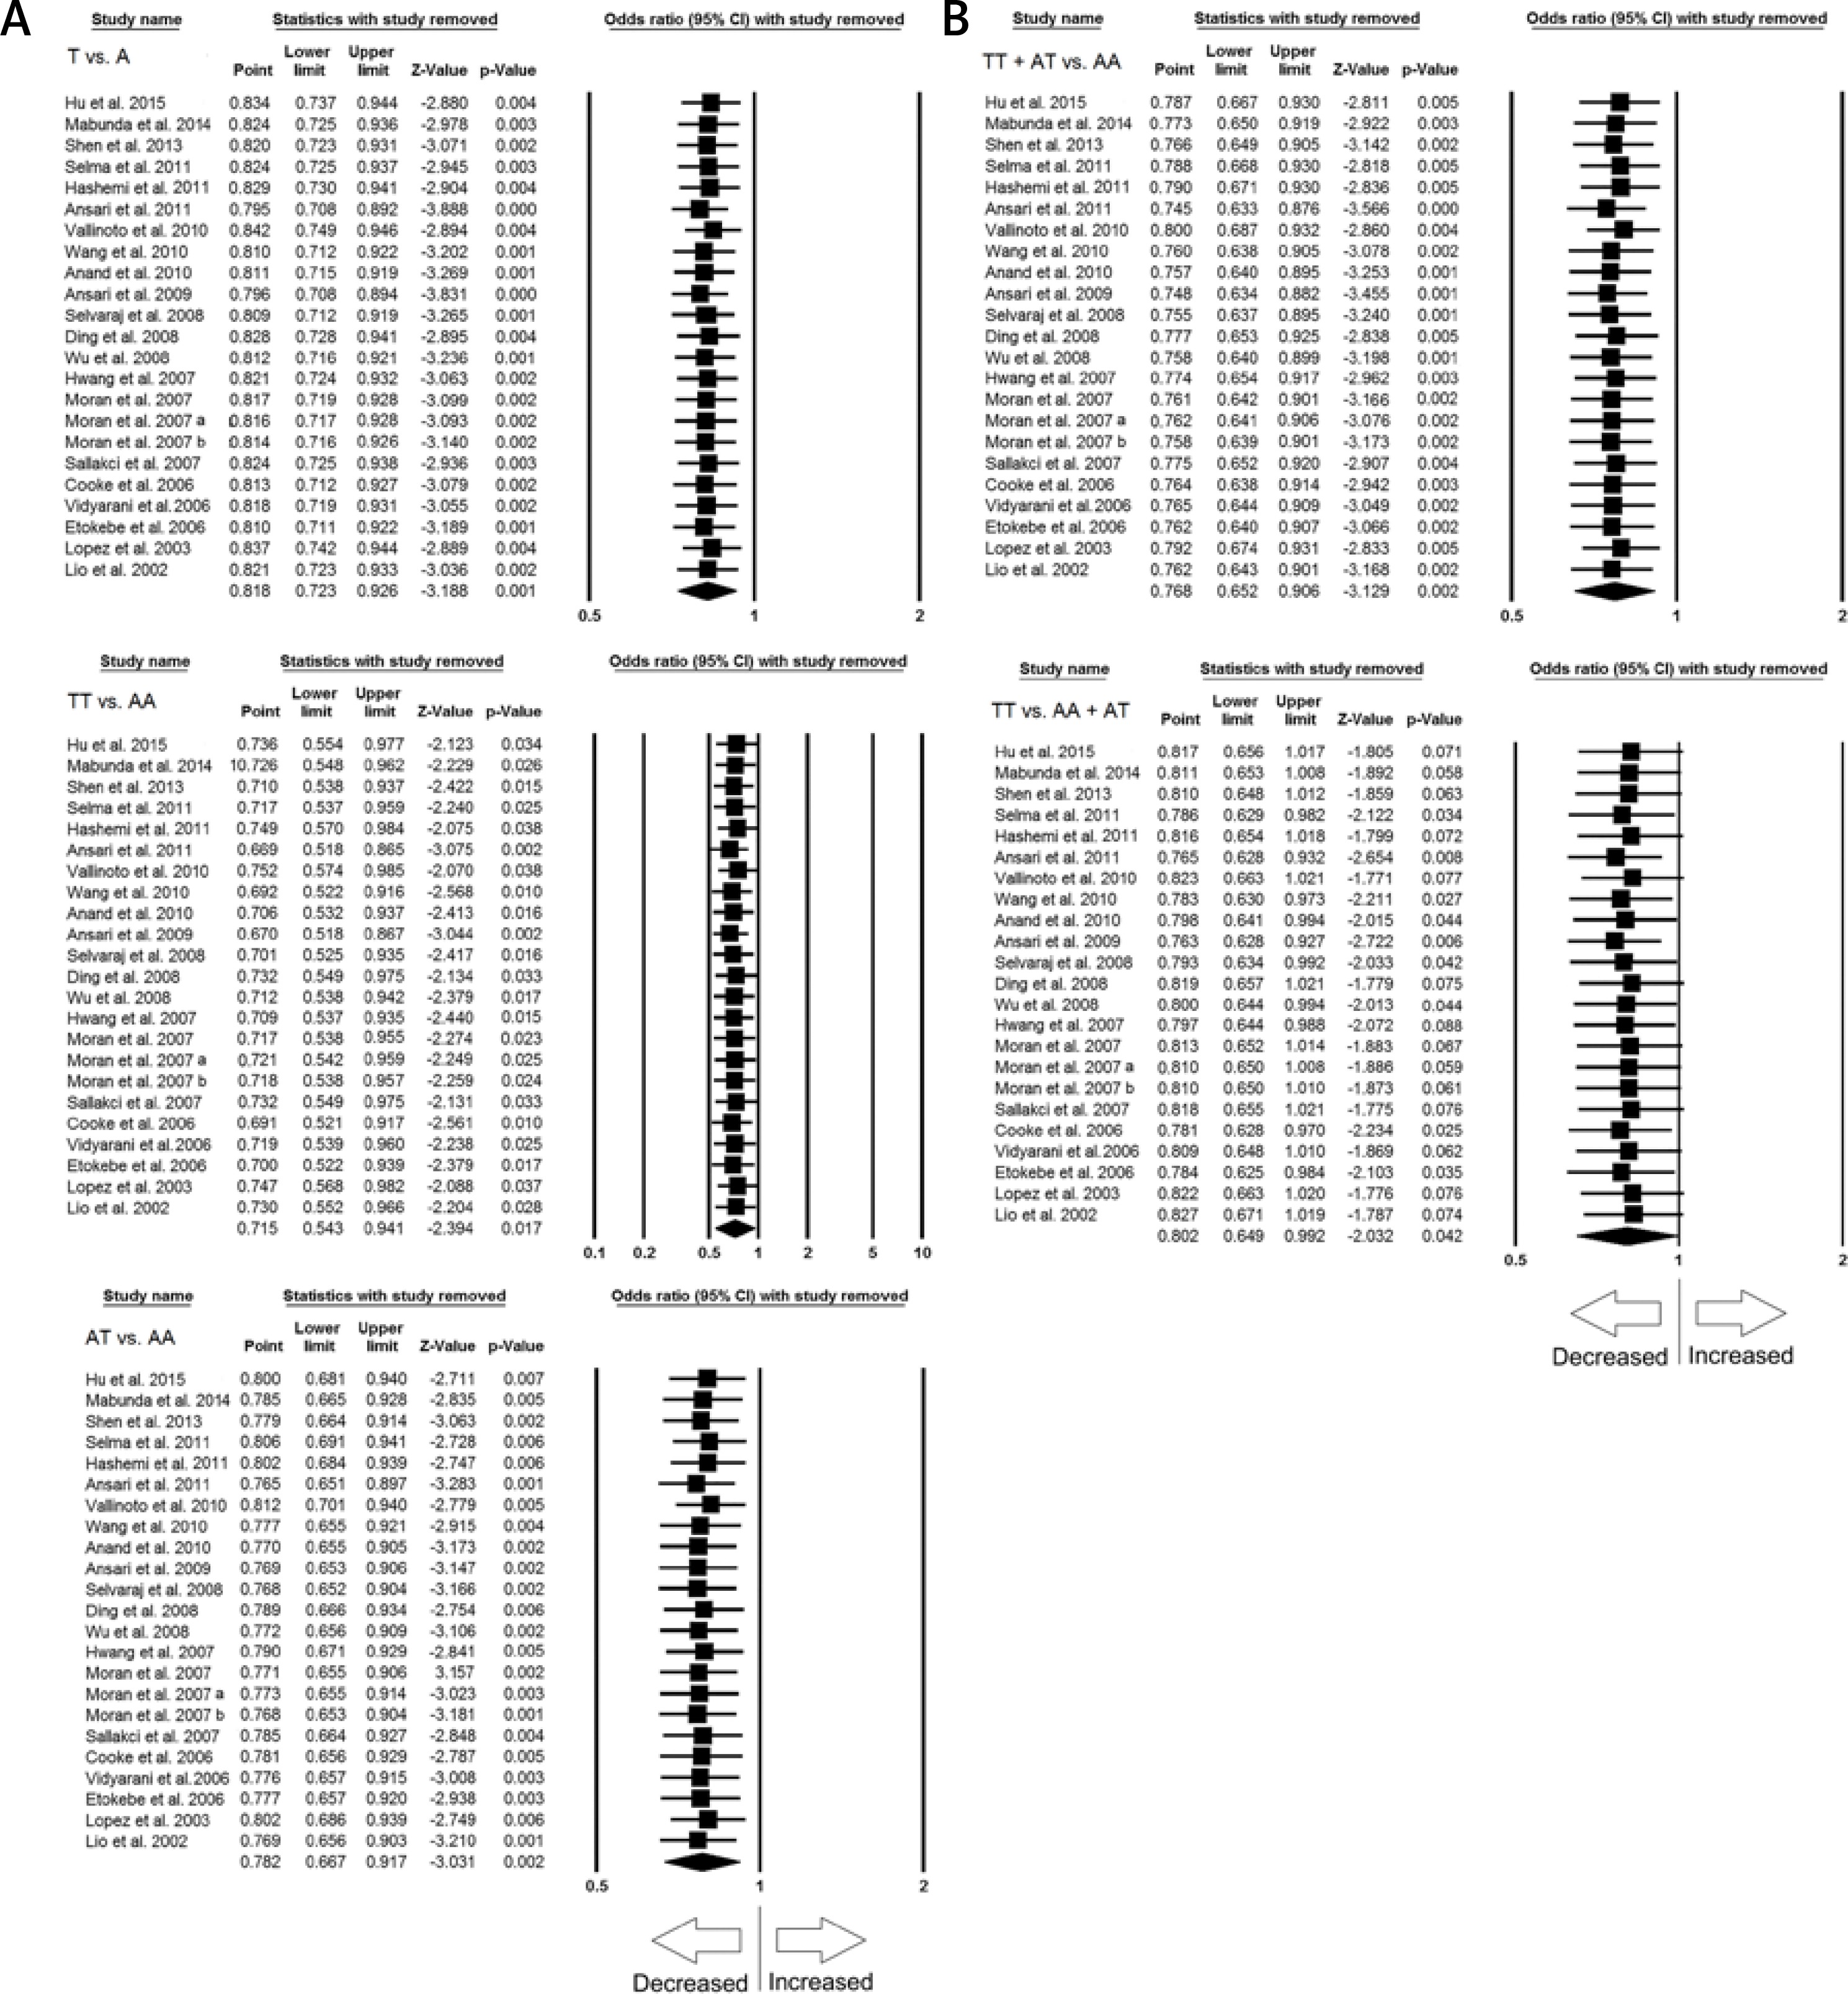
Sensitivity analysis
Sensitivity analysis was done to examine the effect of each individual study on the pooled OR by deleting a single study each time. The results revealed that no individual study affected the pooled OR significantly, suggesting stability of this meta-analysis (Figures 2 A, B).
Figure 2
A – Sensitivity analysis to evaluate the influence of each study on the pooled OR by deleting a single study each time for the overall analysis (allelic contract (T vs. A), homozygous (TT vs. AA) and heterozygous (AT vs. AA) genetic models). Black squares represent the value of OR, and the size of the square indicates the inverse proportion relative to its variance. The horizontal line is the 95% CI of OR. B – Sensitivity analysis to evaluate the influence of each study on the pooled OR by deleting a single study each time for the overall analysis (dominant (TT+AT vs. AT) and recessive (TT vs. AA+AT) genetic models). The black squares represent the value of OR, and the size of the square indicates the inverse proportion relative to its variance. The horizontal line is the 95% CI of OR
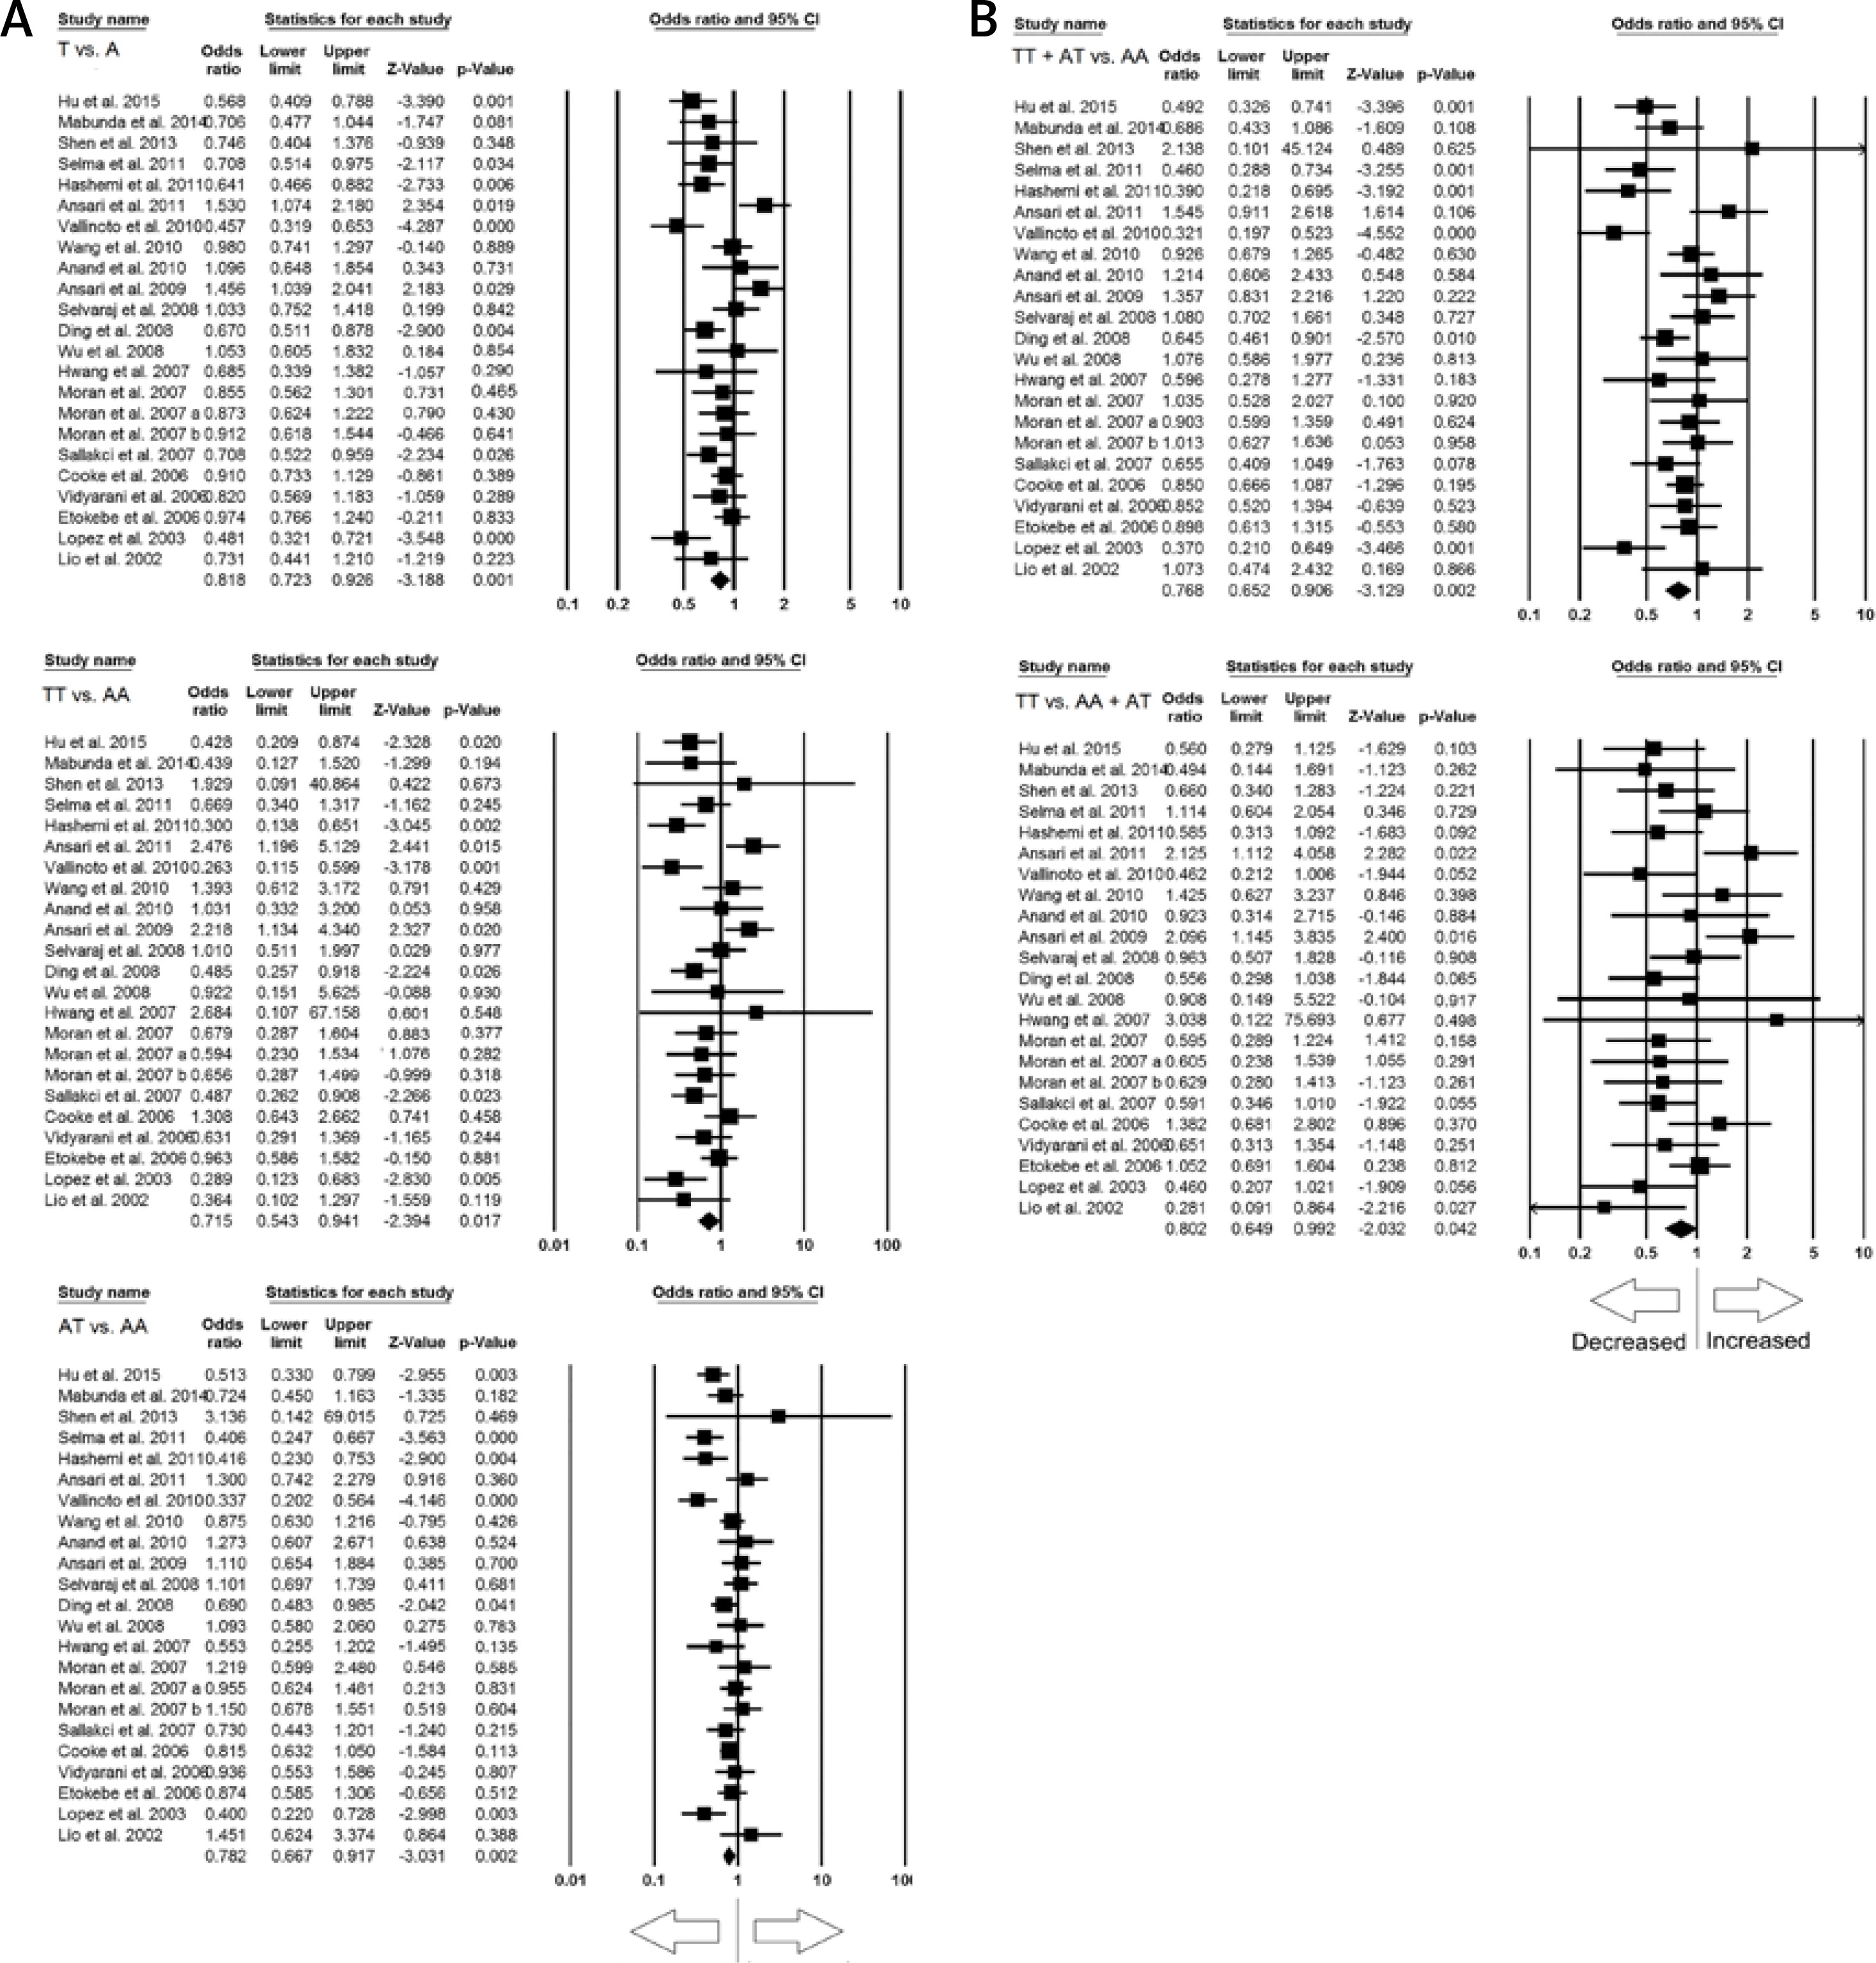
Quantitative synthesis
All the 21 studies (yielding 23 case-control study groups) had desired data, conclusively of 4281 confirmed PTB cases and 5186 healthy controls, to calculate the pooled ORs. The results of pooled study demonstrated that IFN-γ +874 A>T polymorphism is associated with reduced risk of PTB susceptibility (protective effect) in the general population under all the genetic models, i.e. allelic contrast (T vs. A: p = 0.001; OR = 0.818, 95% CI: 0.723–0.926), homozygous (TT vs. AA: p = 0.017; OR = 0.715, 95% CI: 0.543–0.941), heterozygous (AT vs. AA: p = 0.002; OR = 0.782, 95% CI: 0.667–0.917), dominant (TT+AT vs. AA: p = 0.002; OR = 0.768, 95% CI: 0.652–0.906), and recessive (TT vs. AA+AT: p = 0.042; OR = 0.802, 95% CI: 0.649–0.992) genetic models (Figures 3 A, B).
Figure 3
A – Forest plot of OR with 95% CI of PTB risk associated with the IFN-γ +874 A>T gene polymorphism for overall population (allelic contract (T vs. A), homozygous (TT vs. AA), heterozygous (AT vs. AA) genetic models). The black square represents the value of OR, and the size of the square indicates the inverse proportion relative to its variance. The horizontal line is the 95% CI of OR. B – Forest plot of OR with 95% CI of PTB risk associated with the IFN-γ +874 A>T gene polymorphism for the overall population (dominant (TT+AT vs. AT), recessive (TT vs. AA+AT) genetic models). The black square represents the value of OR, and the size of the square indicates the inverse proportion relative to its variance. The horizontal line is the 95% CI of OR
Subgroup analysis
A subgroup analysis based on ethnicity (case-control study population under consideration) was also performed to explore its effect (Asian and Caucasian) on the association between IFN-γ +874 A>T and PTB risk.
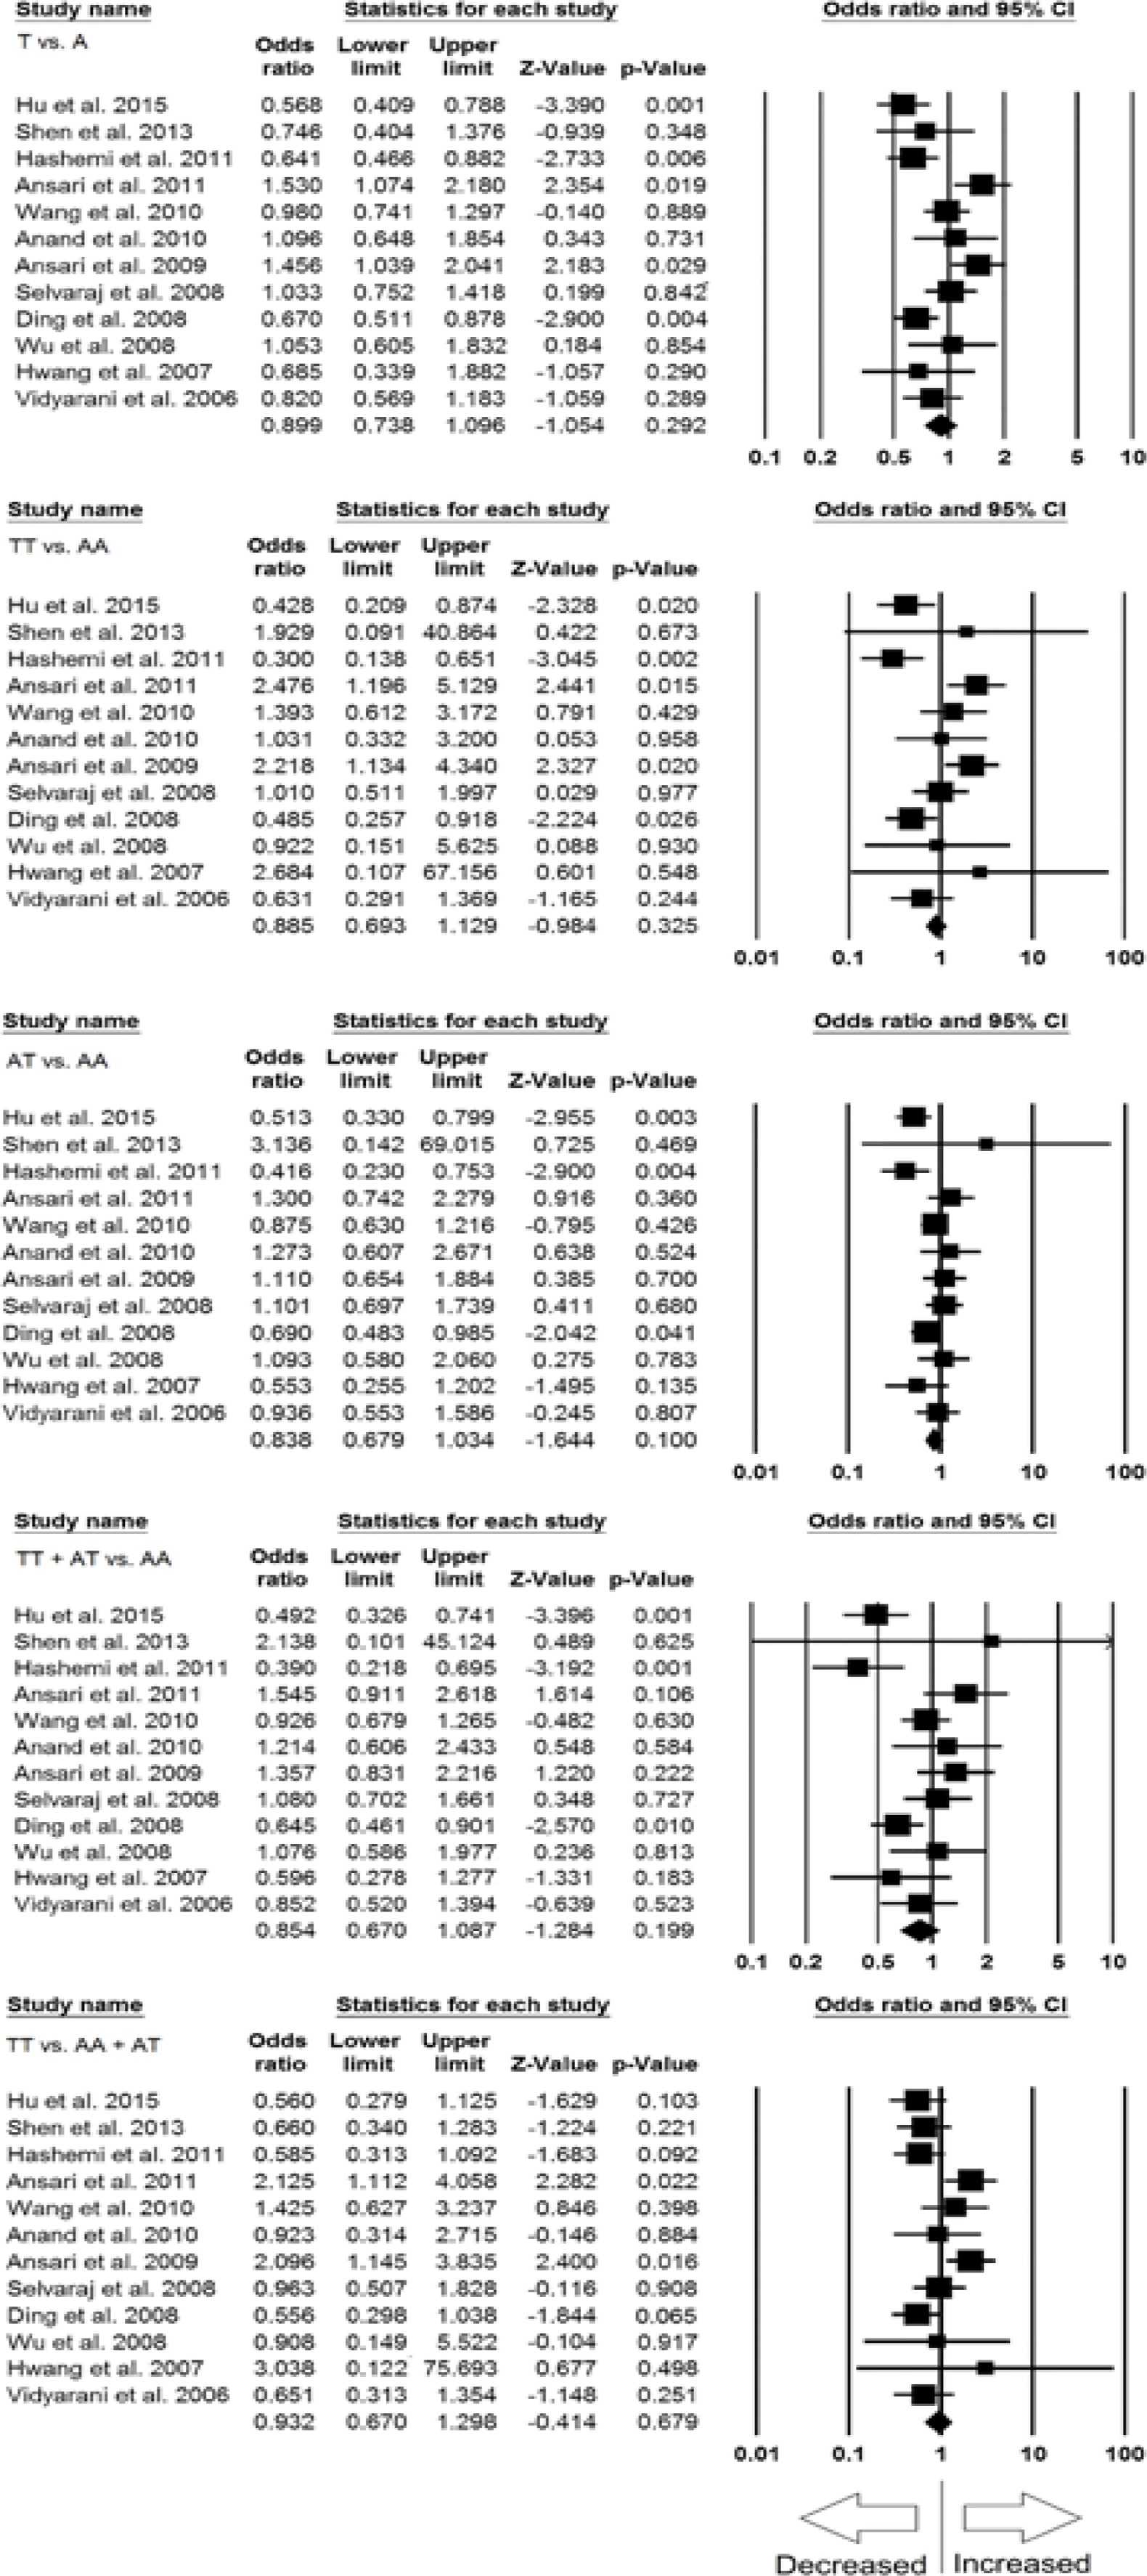
Subgroup analysis of the Asian population
Out of 21 studies included for overall meta-analysis, 12 studies were of Asian populations and were included in the subgroup analysis. Significant heterogeneity was found in all the genetic models (Table V) (Supplementary Figure S2). So, random effect models were applied for the analyses. Overall, no significant association of IFN-γ +874 A>T SNP and PTB susceptibility was found in all the genetic models, i.e. allele (T vs. A: p = 0.292; OR = 0.899, 95% CI: 0.738–1.096), homozygous (TT vs. AA: p = 0.325; OR = 0.885, 95% CI: 0.693–1.129), heterozygous (AT vs. AA: p = 0.100; OR = 0.838, 95% CI: 0.679–1.034), dominant (TT+AT vs. AA: p = 0.199; OR = 0.854, 95% CI: 0.670–1.087), and recessive (TT vs. AA+AT: p = 0.679; OR = 0.932, 95% CI: 0.670–1.298) genetic models (Figure 4).
Table V
Statistics to test publication bias and heterogeneity in the meta-analysis: Asian population
Figure 4
Forest plots of ORs with 95% CI of PTB risk associated with the IFN-γ +874 A>T gene polymorphism in the Asian population (allelic contract (T vs. A), homozygous (TT vs. AA), heterozygous (AT vs. AA), dominant (TT+AT vs. AT), recessive (TT vs. AA+AT) genetic models). The black square represents the value of OR, and the size of the square indicates the inverse proportion relative to its variance. The horizontal line is the 95% CI of OR
Subgroup analysis of the Caucasian population
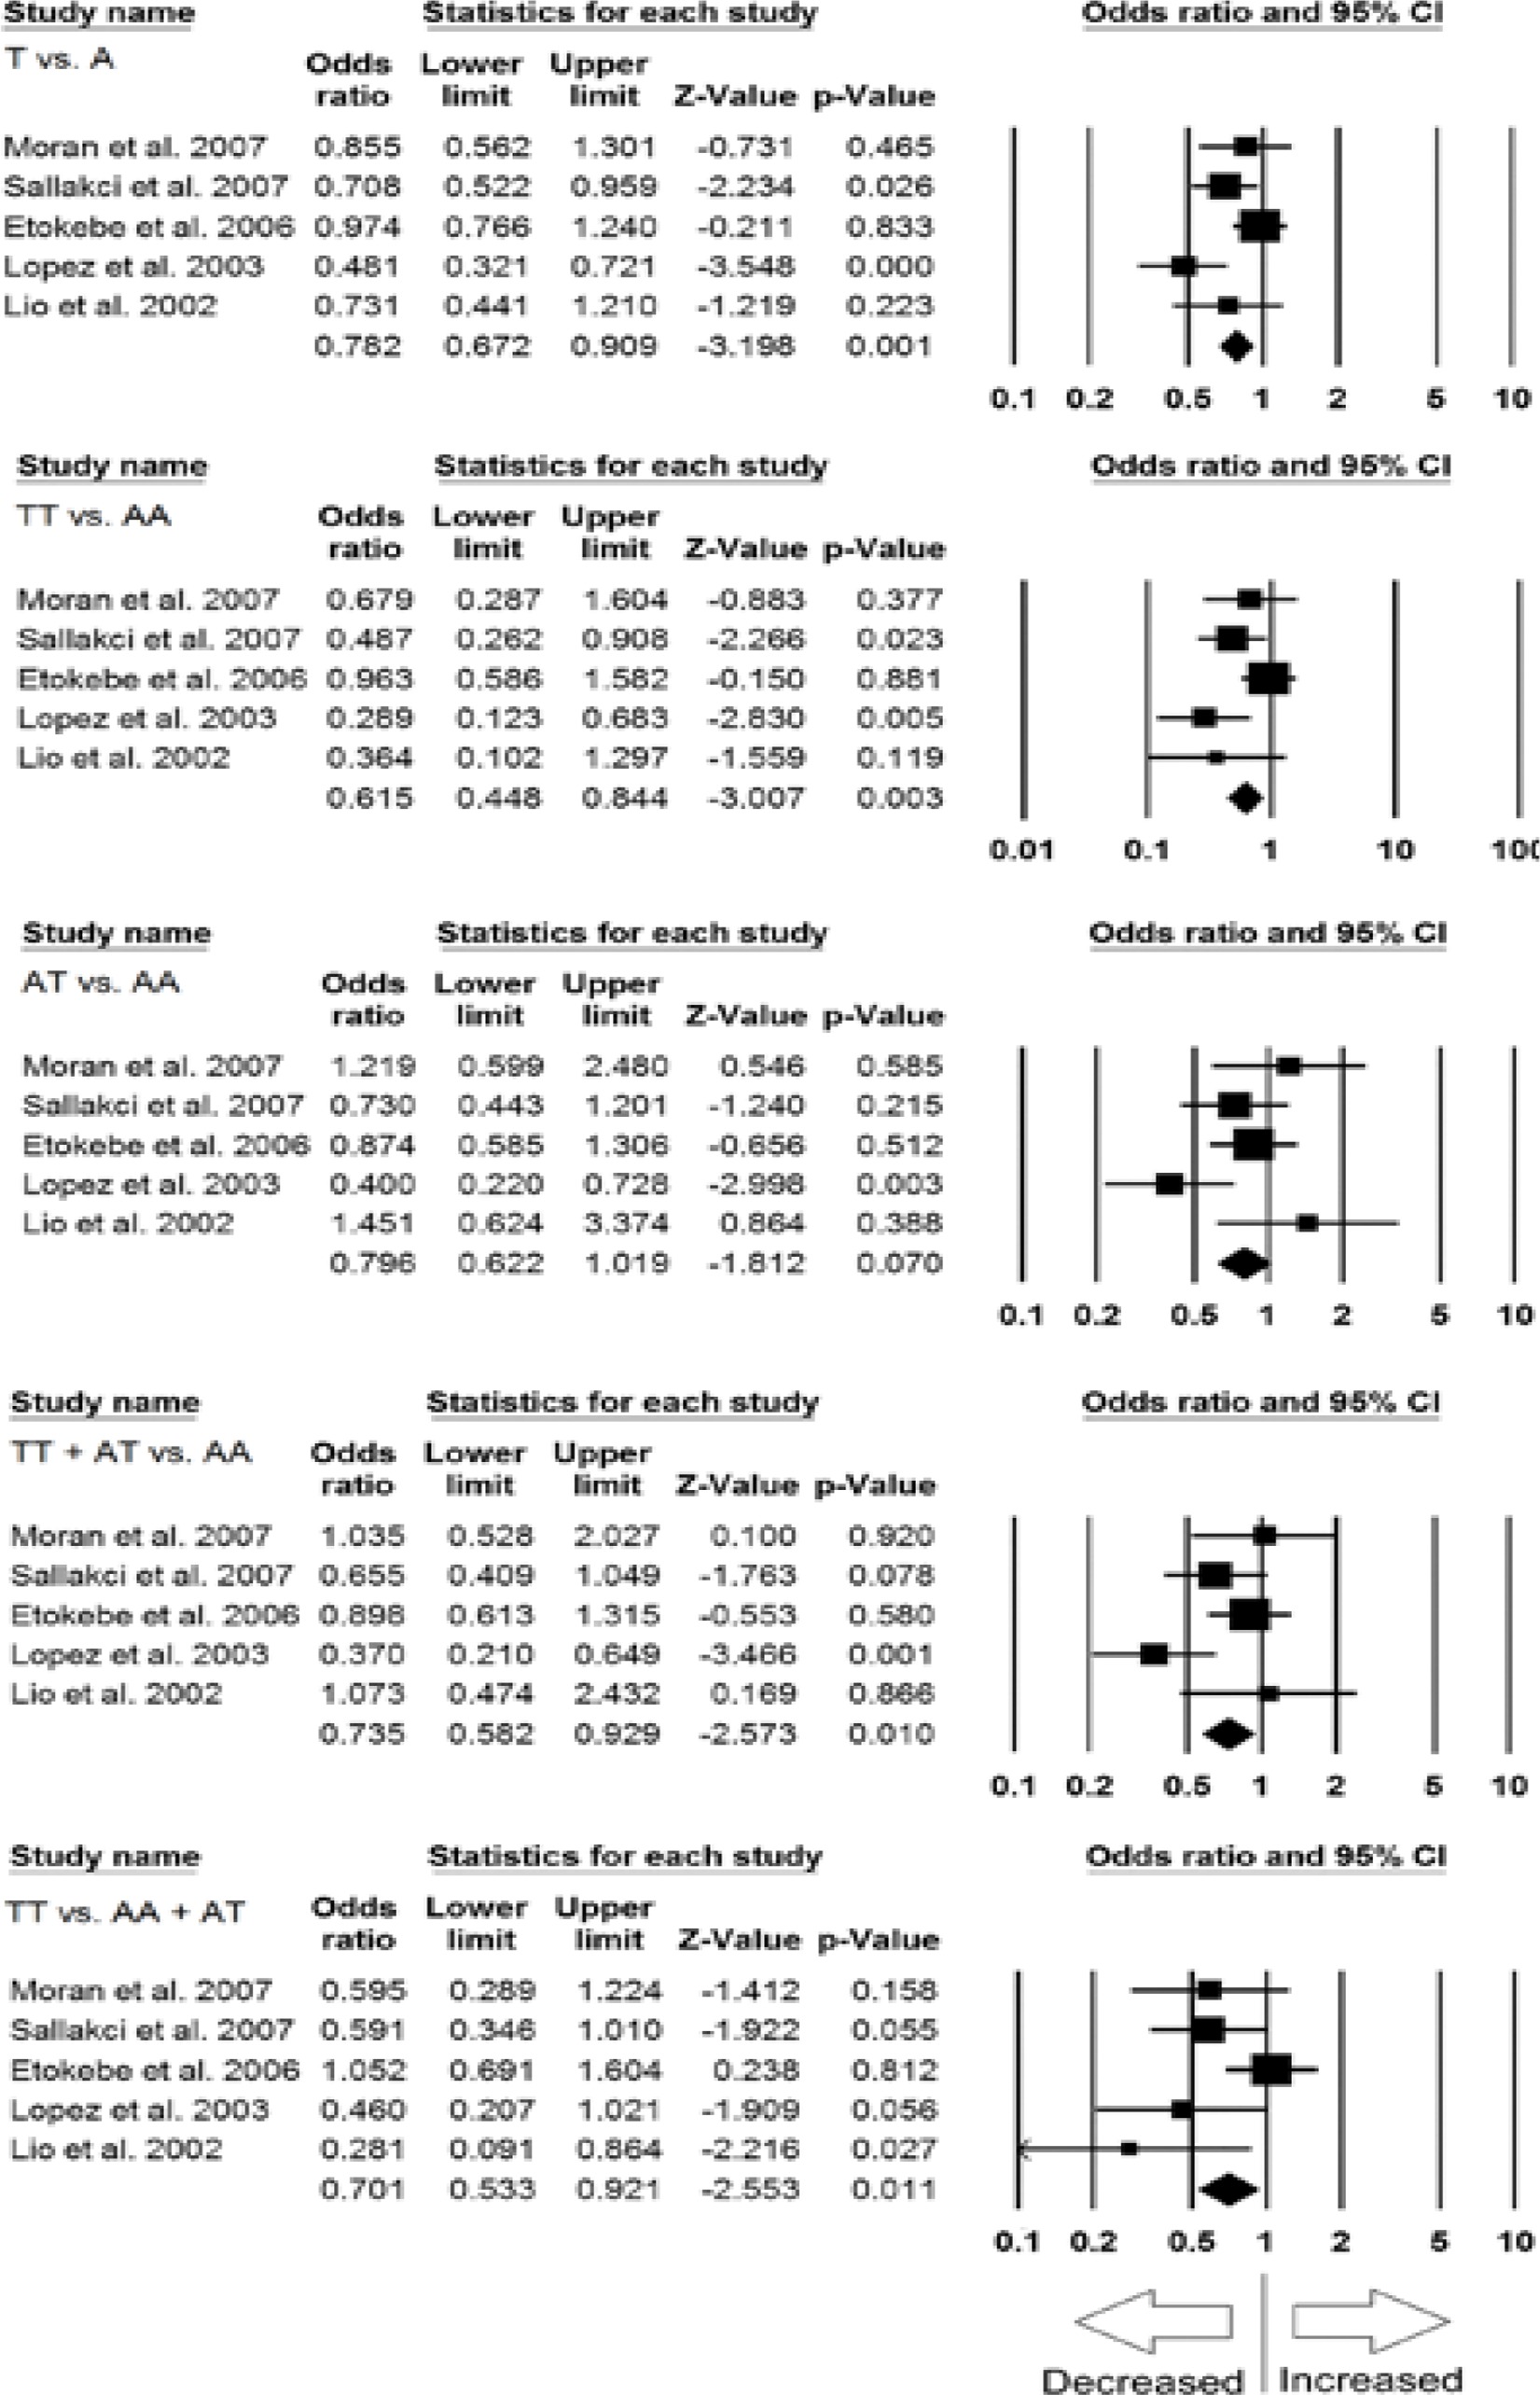
In the Caucasian population five studies were included for subgroup analysis. No significant publication bias and heterogeneity was noticed (Supplementary Figure S3), and thus fixed effect models were applied for all the genetic models (Table VI). Interestingly, we found significantly decreased risk of PTB (in relation with IFN-γ +874 A>T SNP) in allele (T vs. A: p = 0.001; OR = 0.782, 95% CI: 0.672–0.909), homozygous (TT vs. AA: p = 0.003; OR = 0.615, 95% CI: 0.448–0.844), dominant (TT+AT vs. AA: p = 0.010; OR = 0.735, 95% CI: 0.582–0.929), and recessive (TT vs. AA+AT: p = 0.011; OR = 0.701, 95% CI: 0.533–0.921) genetic models (Figure 5). However, the heterozygous model (AT vs. AA: p = 0.070; OR = 0.796, 95% CI: 0.622–1.019) did not show any risk of PTB in relation to IFN-γ +874 A>T SNP (Figure 5).
Table VI
Statistics to test publication bias and heterogeneity in the meta-analysis: Caucasian population
Figure 5
Forest plots of ORs with 95% CI of PTB risk associated with the IFN-γ +874 A>T gene polymorphism in the Caucasian population (allelic contract (T vs. A), homozygous (TT vs. AA), heterozygous (AT vs. AA), dominant (TT+AT vs. AT), recessive (TT vs. AA+AT) genetic models). The black square represents the value of OR, and the size of the square indicates the inverse proportion relative to its variance. The horizontal line is the 95% CI of OR
Discussion
The cytokine network plays an important role in homeostasis of the immune response. Genetic variations in cytokine genes have been described earlier and demonstrated to influence gene transcription, leading to inter-individual variations in cytokines and may result in abnormal or aberrant immune response, as seen in M. tuberculosis infection [42]. Various mechanisms have been described for the development of a protective immunity that prevents the progression of the active disease [43]. The candidate gene approach and association studies have identified various host genetic factors that affect the susceptibility to TB [43].
An earlier report demonstrated that immunoregulatory genes are important in modulating the host susceptibility to PTB because the first line of defence against M. tuberculosis involves the identification and uptake of the bacterium by macrophages and dendritic cells [44]. IFN-γ is a potent activator of macrophages, and clinical and experimental evidence showed that IFN-γ plays a key role in antimicrobial activities that regulate mycobacterial infection. In recent years, IFN-γ +874 A>T gene polymorphism has been widely studied for potential association with increased/reduced/no risk of PTB, but the findings were inconsistent, and still the precise association between the IFN-γ +874 A>T SNP and PTB risk is inconclusive. This inconclusive finding warranted further studies with large sample sizes for accurate estimation of the association between the IFN-γ +874 A>T gene polymorphism and PTB disease. Hence, in order provide a precise conclusion against the above-mentioned controversial results, a meta-analysis is thought to be needed to achieve more reliable and accurate statistical evidence on the association between IFN-γ +874 A>T SNP and PTB susceptibility. The pooled ORs generated from a large sample size and sufficient statistical power from various studies have the power to reduce the random errors [45].
We included 23 case-control group studies from 21 published articles complying with all the eligible criteria. All the included studies scored five or more stars in NOS quality assessment and indicated good to moderate quality by clearly stating the sample size, genotype, and inclusion criteria of PTB patients and healthy controls. We found that pooled results of IFN-γ +874 A>T gene polymorphism for each genetic model as well as the allele contrast was significantly associated with decreased risk of PTB. These observations lead to the conclusion that that IFN-γ +874 A>T polymorphism leads to a protective role in PTB infection. This finding highlights that IFN-γ +874 A>T polymorphism may be an important marker with possible relevant application when dealing with the prognosis of PTB. An earlier meta-analysis also indicated a protective role of IFN-γ +874 A>T gene polymorphism in TB disease, based on only 11 studies [11] (case-control series) due to the limited availability of the data at that time, with no clear-cut differentiation of overall TB into PTB and extra-pulmonary TB, and lack of subgroup analysis.
The importance of IFN-γ in TB has been difficult to establish. IFN-γ is critical to activation of macrophages during mycobacterial infection. Certainly, many studies have shown that the levels of IFN-γ are lower in subjects with active TB than in controls, suggesting a protective role of this cytokine [8].
The genotype frequency of IFN-γ +874 A>T vary greatly in different ethnicities. Previous studies have shown that there is a discrepancy in TB susceptibility among different ethnicities [46]. Hence, we conducted subgroup analysis by ethnicity, and our results showed that the IFN-γ +874 A>T genotype is significantly associated with decreased PTB risk in the Caucasian population and provides a protective effect. Whereas, no significant association between IFN-γ +874 A>T and PTB susceptibility was found in the Asian ethnic population. In this manner, our subgroup analysis at least presents evidence for the racial differences of IFN-γ +874 A>T polymorphism and its effects. However, TB susceptibility genes in genome-wide screens endorsed the possibility of multigenic predisposition of TB [47, 48]. However, due to the multifactorial nature of TB infection and complex nature of the immune system, IFN-γ +874 A>T gene polymorphism cannot be solely accountable for the predisposition of PTB.
In this study, significant heterogeneity was found between the selected studies during the heterogeneity evaluation. This limitation was in line with a previously published meta-analysis, which reported significant heterogeneity across the studies under consideration [11]. This may be due to some factors, e.g. the ethnicity, selection of method, the definition of cases, and the sample size. However, our study has some limitations, hence it is worth mentioning for their redressal in future studies. First, we only selected studies published in the English language, abstracted and indexed by the specific web-databases for data analysis; it is possible that some relevant studies published in other languages and abstracted and indexed in other databases may have been missed. Second, the extrapolated data were not stratified by other factors, e.g. HIV infection status or severity of the PTB infection, and these results are based on the above-mentioned unadjusted parameters. Infection is the ‘combine effect’ of the interaction between the host, the parasite, and the environment, and is superimposed on the continual evolution and adaptation of the microbial and human genomes to each other [49]. Third, we failed to test gene-gene and gene-environment interactions, due to lack of adequate data available in the published reports; the interaction of different susceptibility genes and environmental factors can lead to the disease.
Notwithstanding the above limitations, there are some advantages associated with our study. First, this meta-analysis included a greater number of studies (which were not incorporated earlier) to increase the statistical power and attain robust conclusions. Second, publication bias did not exist, and sensitivity analysis also aided the authenticity of our results. In addition, all the included studies were of good to moderate quality, fulfilling the pre-set criteria for study inclusion as tested by the NOS quality assessment scale.
In conclusion, that IFN-γ +874 A>T gene polymorphism is significantly associated with decreased risk of PTB, showing a protective effect in the overall and in the Caucasian population. Whereas, +874 A>T polymorphism of IFN-γ gene is not associated with increased/decreased risk of PTB in the Asian population. As the immune response in PTB infection is polygenic in nature, further larger clinical and laboratory studies are warranted to improve our understanding of the mechanism of the cytokine gene in such a complex disease. This will help in the identification of host immunogenetic factors responsible for PTB susceptibility, which may help in the controlling of this infectious disease.