
Introduction
Cardiac arrest (CA) is a catastrophic event marked by the sudden cessation of cardiac mechanical activity, resulting in the loss of adequate blood circulation. It remains a leading cause of mortality in the United States, affecting over 600,000 patients every year, contributing significantly to the national burden of cardiovascular disease-related deaths [1]. Despite advancements in emergency response systems and post-resuscitation care, survival rates after out-of-hospital cardiac arrest (OHCA) have remained low, with more than 350,000 cardiac arrest cases outside of the hospital each year [2]. In OHCA, discharge survival is < 10% and discharge with meaningful functional status is < 7% [3]. Among populations at elevated risk, individuals with diabetes mellitus (DM) face a disproportionately higher likelihood of experiencing cardiac arrest and poorer outcomes thereafter as they share common risk factors such as obesity, hypertension, and dyslipidemia [4].
Diabetes mellitus is a chronic metabolic condition impacting over 38 million Americans as of 2022, and its burden is projected to increase, as mortality is expected to rise significantly by 2030 [5, 6]. Hyperglycemia in diabetes mellitus is independently associated with accelerated atherosclerosis, autonomic dysfunction, myocardial fibrosis, and impaired cardiac electrophysiology, all of which predispose patients to sudden cardiac arrest [5, 7]. Additionally, patients with diabetes often present with silent ischemia, as chronic hyperglycemia is a disastrous risk factor for coronary artery disease (CAD) and associated complications [8]. Diabetic individuals can also have delayed recognition of cardiac symptoms and higher burdens of comorbidities such as hypertension and chronic kidney disease, all of which heighten the risk of sudden cardiac events [9]. Large-scale studies have indicated that diabetic individuals have a two- to fourfold higher risk of experiencing sudden cardiac death compared to non-diabetic people [10]. Moreover, diabetes is associated with worse post-cardiac arrest survival rates, likely due to metabolic dysregulation, impaired organ perfusion, and reduced neurologic recovery [11].
Despite its significant clinical implications, there are limited national-level data exploring long-term trends in cardiac arrest mortality specifically among diabetic adults. With the rising prevalence of diabetes, understanding these mortality patterns is critical for guiding public health strategies and resource allocation. This study analyzed the CDC WONDER database to investigate mortality trends related to cardiac arrest among adults aged 25 years and older with diabetes mellitus in the United States from 1999 to 2024. By examining demographic, temporal, and geographic disparities, this research aimed to provide a clearer epidemiologic picture and inform interventions to mitigate the growing burden of cardiac arrest in diabetic populations.
Material and methods
Study setting and population
The study assessed cardiac arrest-associated mortality in adults with diabetes mellitus using data from the Centers for Disease Control and Prevention Wide-Ranging Online Data for Epidemiologic Research (CDC WONDER) database [12], examining death certificates of US residents aged 25 years and older from 1999 to 2024. We used International Classification of Diseases, 10th Revision (ICD-10) codes I46.0 to I46.9 to identify cardiac arrest and E10-E14 for diabetes mellitus, in line with conventions used in prior studies [13, 14]. The study population was restricted to those with complete demographic data available. The reporting of this observational study followed STROBE (Strengthening the Reporting of Observational Studies in Epidemiology) guidelines [15]. The analysis included death certificates where both conditions were documented as underlying or secondary causes of death. Since the mortality data were publicly accessible and deidentified, institutional review board (IRB) approval was not required.
Data extraction
The data set extracted from CDC WONDER included comprehensive geographic and demographic variables. Geographic variables included urban-rural classification using the 2013 National Center for Health Statistics scheme, which categorizes counties as urban (large central metro, large fringe metro, medium metro, and small metro regions) or rural (micropolitan and noncore regions) [16], as well as U.S. Census regions: West, Midwest, South, and Northeast. Data also included all states of the U.S. Demographic information on race/ethnicity was obtained from death certificate data in CDC WONDER. From 1999 to 2020, the database reported four racial categories: White, Black or African American, American Indian or Alaska Native, and Asian or Pacific Islander. From 2018 to 2024, CDC WONDER expanded the race classification to six independent categories by adding Native Hawaiian or Other Pacific Islander and More than One Race. To ensure consistency across the study period, we classified race/ethnicity into four mutually exclusive groups commonly applied in previous WONDER analyses: Non-Hispanic White, Non-Hispanic Black or African American, Hispanic or Latino, and Non-Hispanic Other. The “Other” category included Asian, American Indian or Alaska Native, Native Hawaiian or Other Pacific Islander, and More than One Race, Sex (female/male), and age (≥ 25 years). We also calculated trends across 3 age groups: younger adults (aged 25–44 years), middle-aged adults (aged 45–64 years), and older adults (aged 65+ years). The extracted data also included the year of death from 1999 to 2024, and place of death: whether it occurred in hospice care, in a medical facility, in a nursing home, or at a decedent’s house. The calendar year 2024 was treated as provisional according to NCHS guidance; estimates for these years may change with revisions, and we therefore also report a sensitivity analysis truncating the series at 2023. Urban–rural analyses used the 2013 NCHS county scheme; the urbanization variable was available in our extracts up to 2020 only, so post-2020 trends by urbanicity were not analyzed. The query string is shown in Supplemental Table SX.
Statistical analysis
Crude mortality rates were calculated by dividing the annual number of cardiac arrest/diabetes mellitus-related deaths by the corresponding U.S. population and multiplying by 100,000. To address age distribution differences, age-adjusted mortality rates were calculated through direct standardization based on the 2000 U.S. standard population [17]. Confidence intervals for age-adjusted death rates were derived using the gamma distribution method with Fay–Feuer and Tiwari modifications, consistent with CDC WONDER methodology [18, 19]. Trends were modeled using the NCI Joinpoint Regression Program (v5.x) with default parameters: log-linear model; grid-search method with default grid constraints; heteroscedastic errors using rate standard errors; model selection via the default 4,499-permutation Monte-Carlo test; and reporting of segment-specific APC and overall AAPC (length-weighted) with 95% CIs to assess temporal trends from 1999 to 2024. Segment-specific APC values were obtained from the fitted log-linear slopes, and the AAPC was computed as a length-weighted average of the APCs across all segments [20]. Joinpoint regression, which employs permutation tests, was used to identify significant inflection points in mortality trends. Annual percent change and corresponding 95% confidence intervals were computed for each trend segment, with significance determined by a slope significantly different from zero. Stratified analyses were conducted to examine mortality patterns across demographic subgroups, while pairwise comparisons were performed to evaluate trend heterogeneity between sex, racial/ethnic, and geographic cohorts. A p-value less than 0.05 was considered evidence of a statistically significant change in trend.
Sensitivity analysis
In sensitivity analyses, we redefined cardiac arrest in two ways: (1) deaths with cardiac arrest (ICD-10 I46.x) listed as the underlying cause only, and (2) deaths with cardiovascular disease as the underlying cause (ICD-10 I20–I25, I30–I52) and cardiac arrest (I46.x) recorded as a contributing cause. These models were analyzed using the same Joinpoint specifications as the primary any-mention definition.
Results
Between 1999 and 2024, cardiac arrests with diabetes mellitus accounted for a total of 1,146,259 deaths among adults aged 25 years and older in the United States (as shown in Table I and Supplementary Table SI). These fatalities were distributed across various settings, with the leading ones occurring in medical facilities (51.6%), 28.1% at the decedents’ homes, 16.3% in nursing homes/long-term care facilities, 0.8% in hospice facilities, and 2.8% at other locations (as shown in Supplementary Table SII). The central illustration summarizing the study’s characteristics and findings is presented in Figure 1.
Figure 1
Central illustration depicting trends in demographics and disparities in cardiac arrest-related mortality among adults with diabetes mellitus in the United States from 1999 to 2024
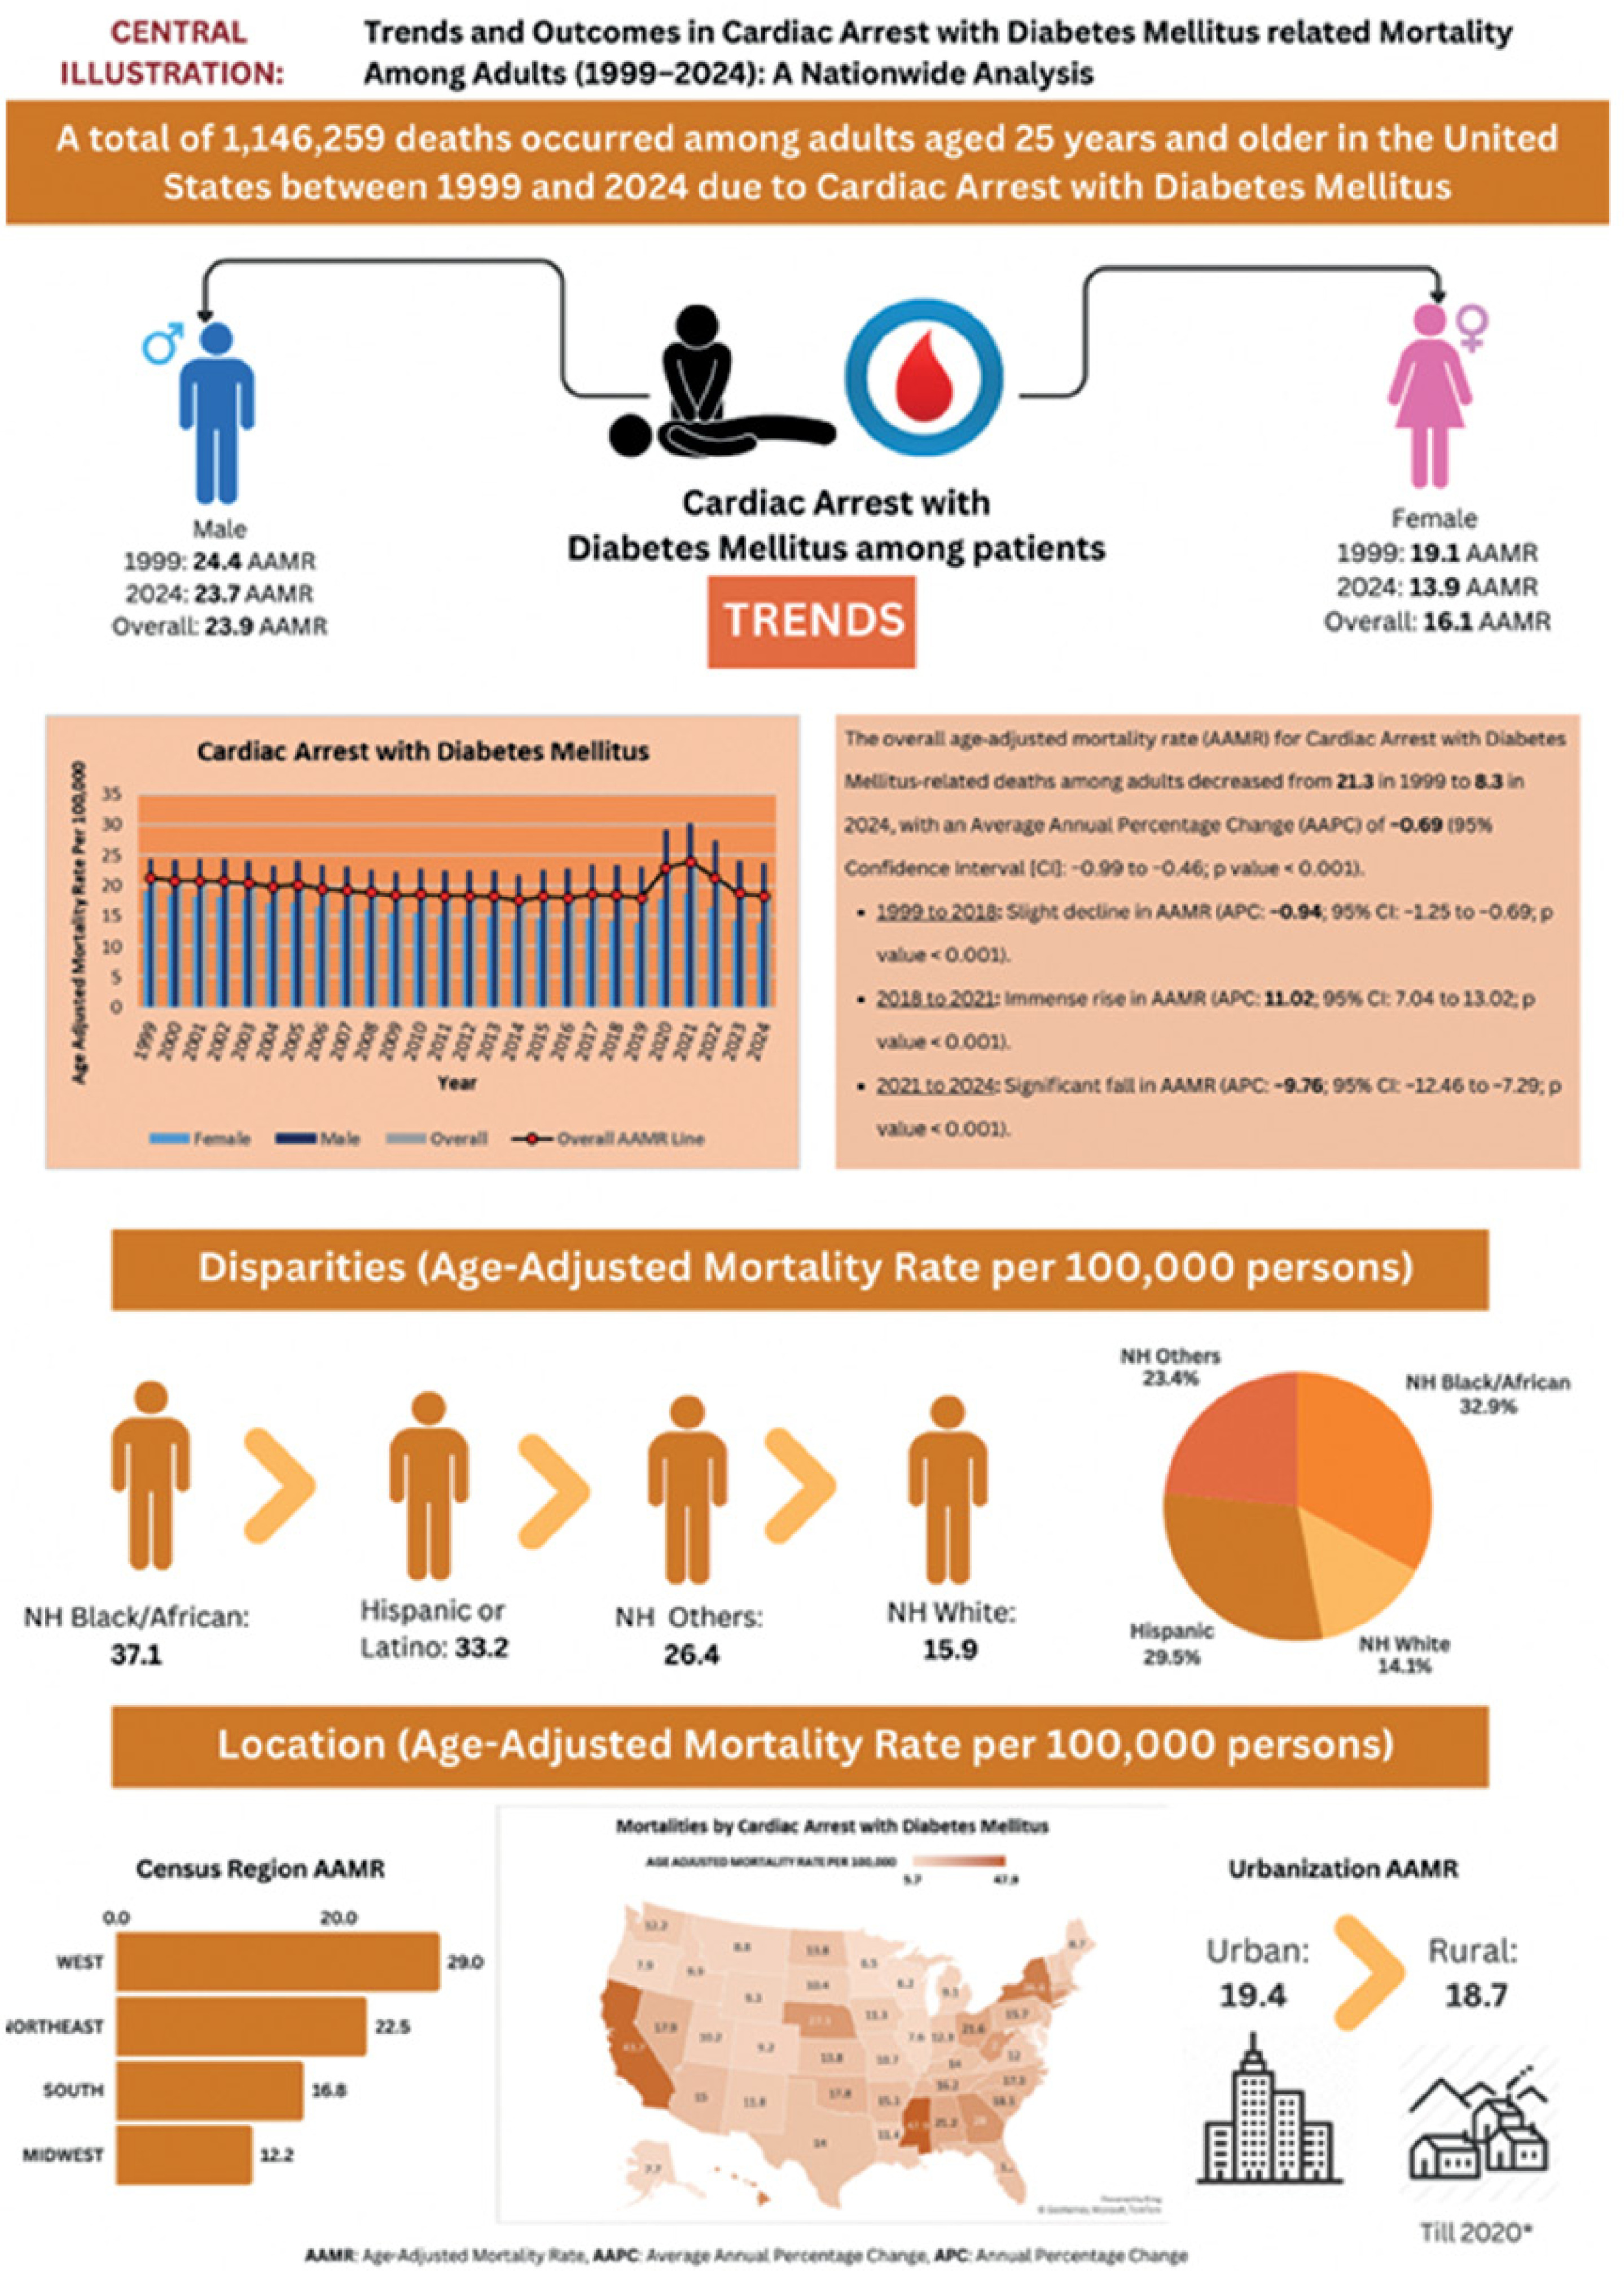
Table I
Demographic characteristics of deaths in the United States between 1999 and 2024
Annual trends in age-adjusted mortality rates for cardiac arrest with diabetes mellitus
All age-adjusted mortality rates (AAMRs) reported in this study are expressed per 100,000 population. The overall AAMR for cardiac arrest with diabetes mellitus among adults decreased from 21.3 in 1999 to 18.3 in 2024, with an average annual percentage change (AAPC) of –0.69 (95% confidence interval [CI]: –0.99 to –0.46; p < 0.001). Notably, the AAMR showed only a slight decline from 1999 to 2018 (APC: –0.94; 95% CI: –1.25 to –0.69; p < 0.001), followed by a marked increase during the COVID-19 pandemic period (2018 to 2021) (APC: 11.02; 95% CI: 7.04 to 13.02; p < 0.001), then a significant decline from 2021 to 2024 (APC: –9.76; 95% CI: –12.46 to –7.29; p < 0.001) (Table II, Supplementary Tables SIII and SIV, Figure 2).
Table II
Annual percentage changes (APCs) and average annual percentage changes (AAPCs)
Cardiac arrest with diabetes mellitus-related AAMR stratified by sex
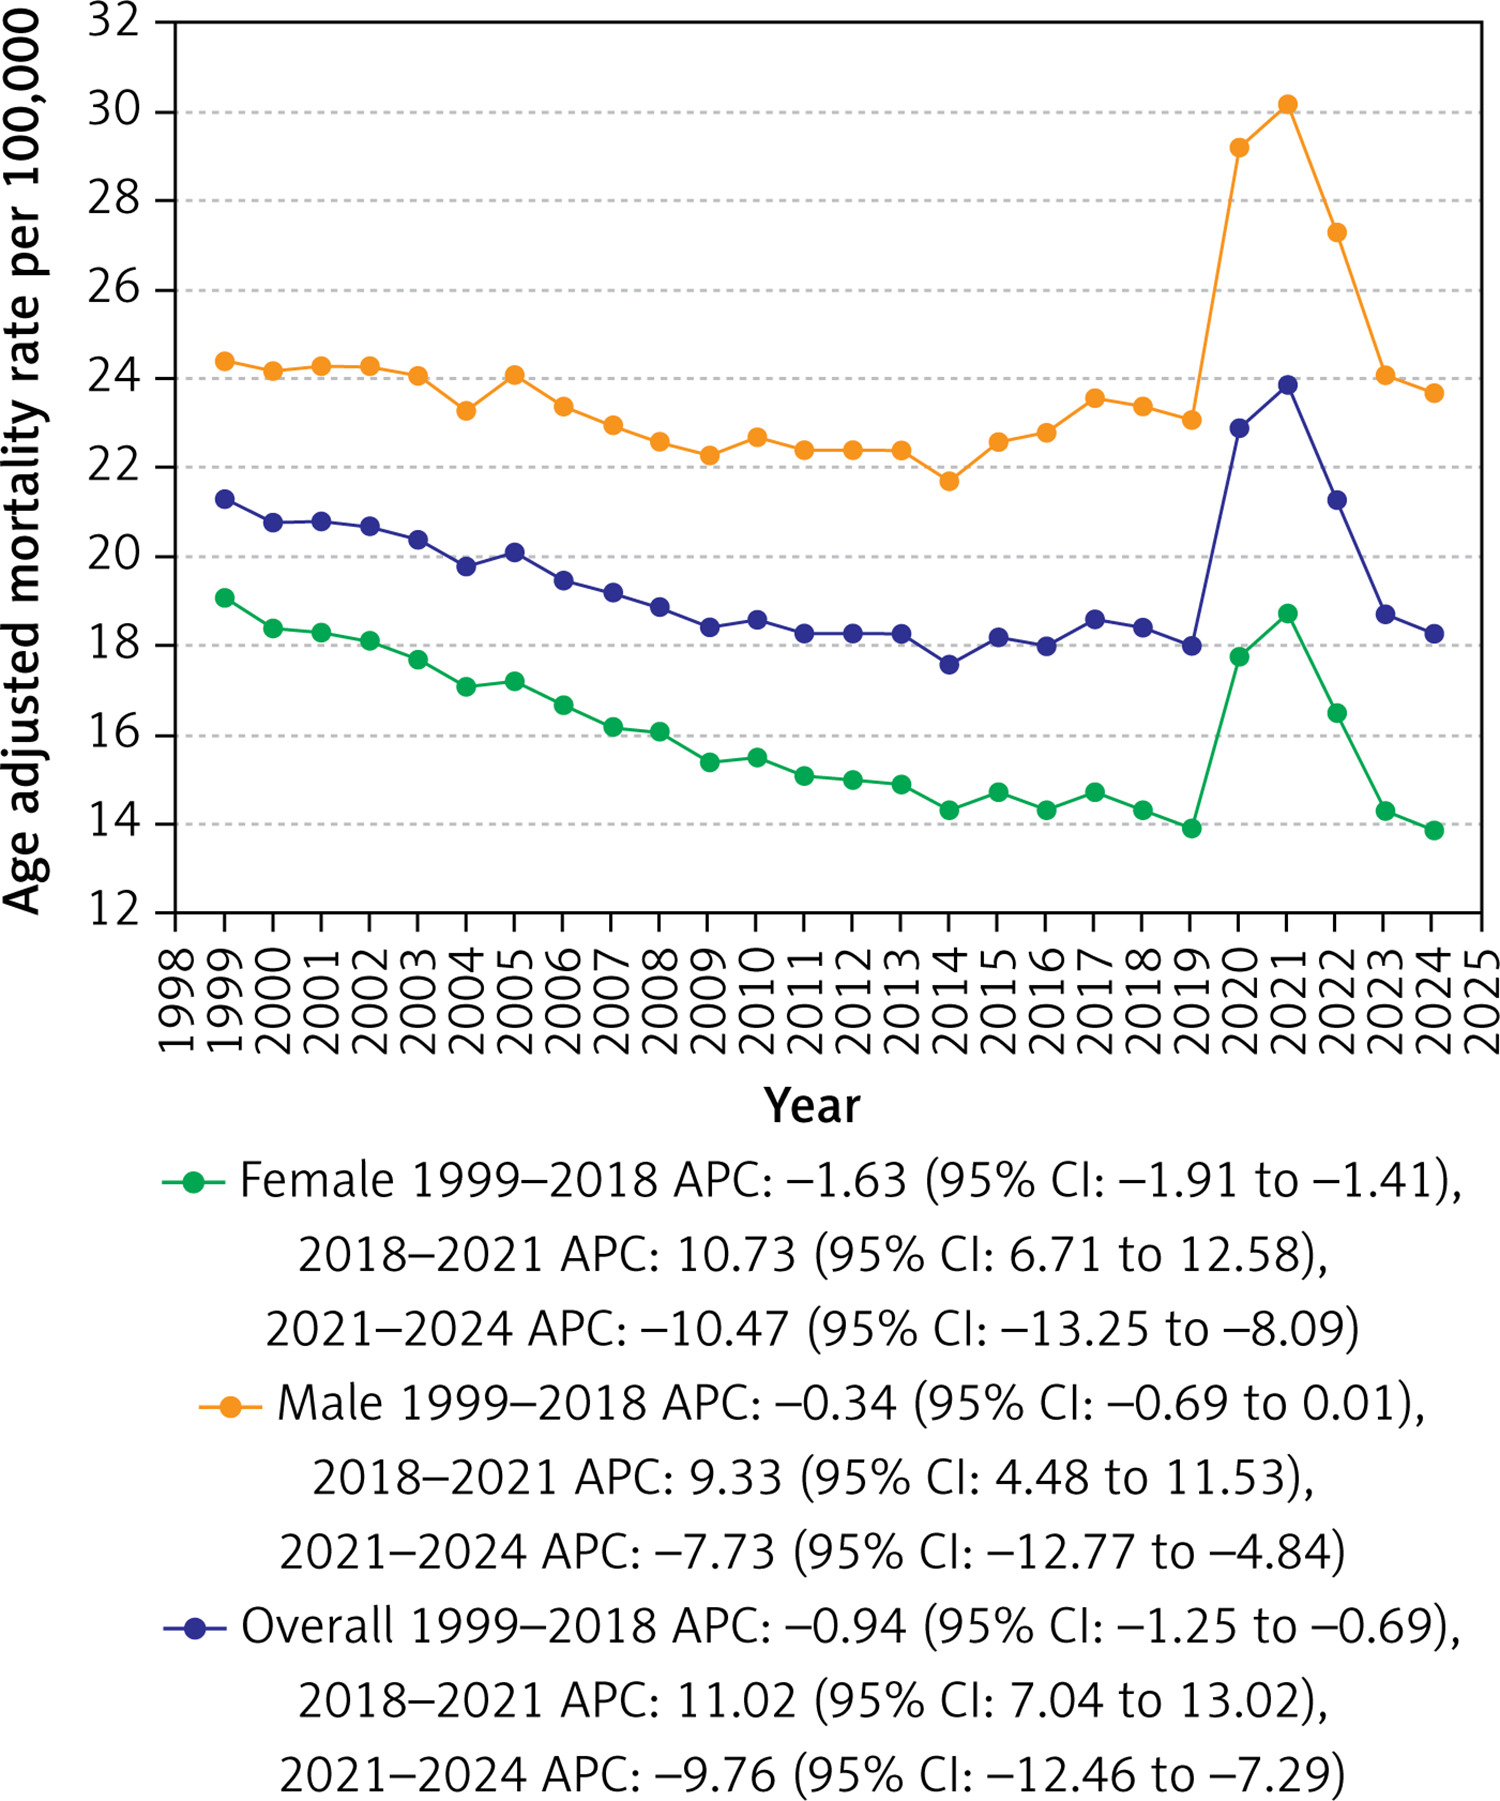
Adult men exhibited considerably higher AAMRs than adult women throughout the study period (overall AAMR for men: 23.9, 95% CI: 23.6–24.2; for women: 16.1, 95% CI: 15.9–16.3). On average, the AAMR of women decreased from 1999 to 2024, whereas that of men did not show a statistically significant change (men: AAPC: –0.15; CI: –0.41 to 0.11; p = 0.2; women: AAPC: –1.35; CI: –1.65 to –1.13; p < 0.001).
The AAMR for adult men showed no appreciable change from 1999 to 2018, falling only marginally from a value of 24.4 in 1999 to 23.4 in 2018 (APC: –0.34; 95% CI: –0.69 to 0.009; p = 0.05). It then surged drastically from 2018 to 2021, with a peak of 30.2 in 2021 (APC: 9.33; 95% CI: 4.48 to 11.53; p < 0.001), followed by a remarkable drop in the post-pandemic period of 2021 to 2024, with a value of 23.7 in 2024 (APC: –7.73; 95% CI: –12.77 to –4.84; p < 0.001). The AAMR for adult women showed a notable decrease from 19.1 in 1999 to 14.3 in 2018 (APC: –1.63; 95% CI: –1.91 to –1.41; p < 0.001), a marked rise from 2018 to 2021, reaching its peak value of 18.7 in 2021 (APC: 10.73; 95% CI: 6.71 to 12.58; p < 0.001) and then a similar substantial fall to 13.9 by 2024 (APC: –10.47; 95% CI: –13.25 to –8.09; p < 0.001) (Table II, Supplementary Tables SIII and SIV, Figure 2).
Cardiac arrest with diabetes mellitus-related AAMR stratified by race/ethnicity
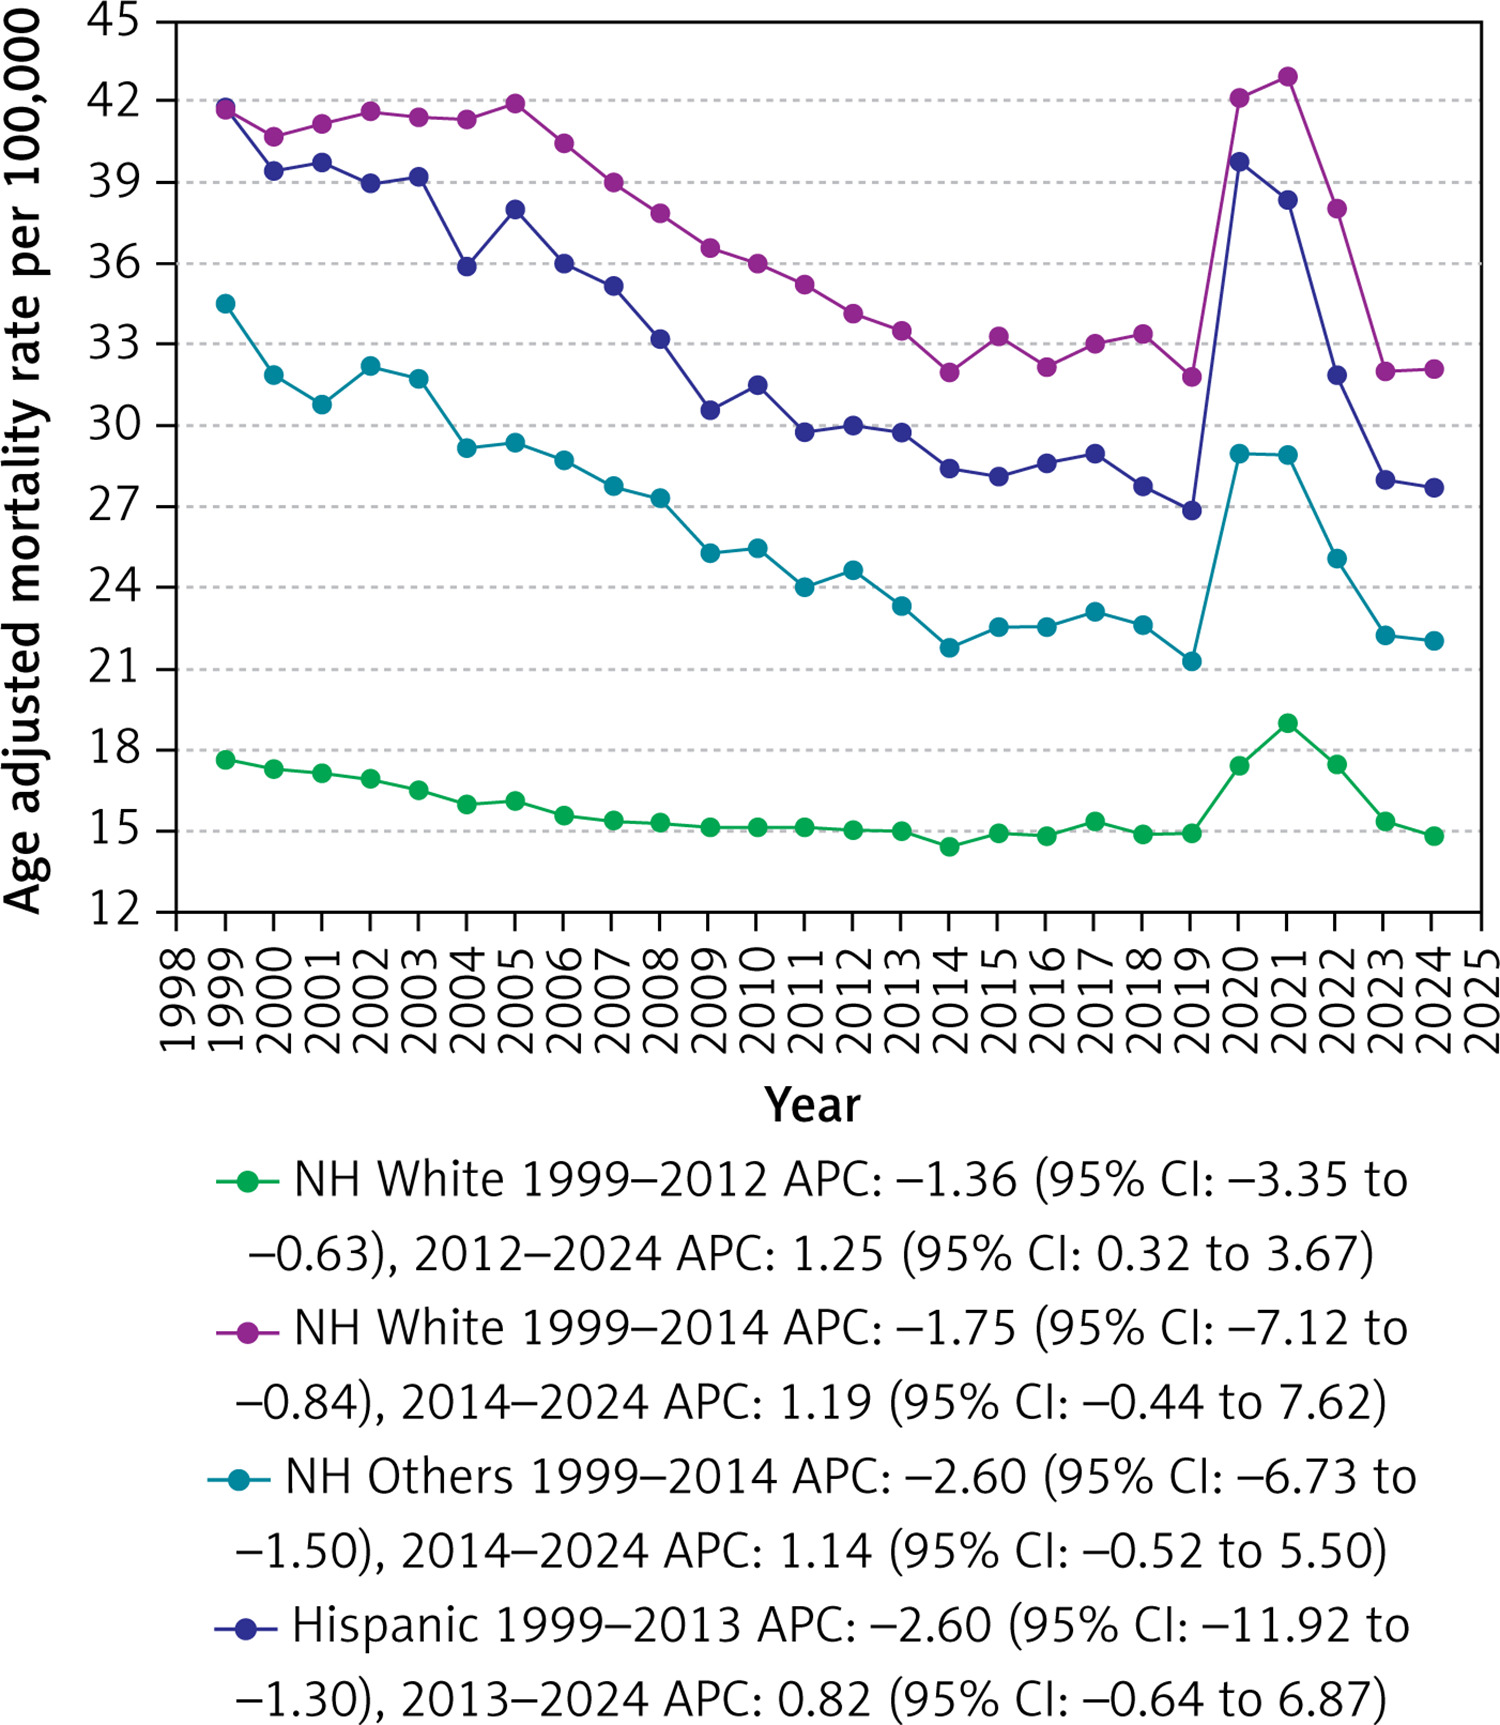
Significant variability in AAMRs was found among different racial/ ethnic groups. The AAMRs were highest among Non-Hispanic (NH) Blacks, followed by Hispanics, NH Others, and were the lowest in NH Whites, which showed AAMRs as low as half of those of NH Blacks and Hispanics (overall AAMR: NH Black: 37.1, 95% CI: 36.3–38.0; Hispanic: 33.2, 95% CI: 32.3–34.1; NH Others: 26.4, 95% CI: 25.3–27.5; NH White: 15.9, 95% CI: 15.7–16.0).
The AAMR of all the races decreased to varying degrees from 1999 to 2024, with the decrease being most pronounced in Hispanics and NH Others and the least in NH Whites (Hispanic: AAPC: –1.84; CI: –2.30 to –1.39; p < 0.001; NH Others: AAPC: –1.84; CI: –2.27 to –1.43; p < 0.001; NH Black: AAPC: –1.40; CI: –1.84 to –1.07; p < 0.001; NH White: AAPC: –0.67; CI: –0.97 to –0.47; p < 0.001). The most significant increase from 2018 to 2021 was noted in Hispanics, with AAMRs of 27.7 and 38.3 in the 2 years, respectively (APC: 13.23; 95% CI: 5.86 to 13.07; p < 0.001). Hispanics also showed the most substantial decline in the post-pandemic period of 2021 to 2024, with the AAMR falling from 38.3 in 2021 back to 27.7 in 2024 (APC: –12.42; 95% CI: –19.41 to –8.07; p < 0.001) (Table II, Supplementary Tables SIII and SV, Figure 3).
Cardiac arrest with diabetes mellitus-related AAMR stratified by age
AAMRs differed markedly between the various age groups. The AAMRs were highest among older adults, followed by middle-aged adults, and were the lowest in younger adults (overall AAMR: older adults: 75.3; 95% CI: 74.47–76.12; middle-aged adults: 12.24; 95% CI: 12–12.48; Younger adults: 1.3, 95% CI: 1.22–1.38).
The AAMRs among the middle-aged and older adults experienced a dip of varying degrees across the study period (older adults: AAPC: –0.91; CI: –1.17 to –0.71; p < 0.001; middle-aged adults: AAPC: –0.19; CI: –0.59 to –0.09; p = 0.153). In contrast, younger adults experienced an overall increasing trend from 1999 to 2024 with an AAPC of 1.17 (CI: 0.65 to 1.56; p < 0.001) (Supplementary Tables SIII and SIX).
Cardiac arrest with diabetes mellitus-related AAMR stratified by geographical regions
Variations in AAMRs were observed among different states, with AAMRs ranging from as low as 5.7 (95% CI: 5.5–5.8) in Maryland to as high as 47.9 (95% CI: 47.2–48.5) in Mississippi. States falling within the top 90th percentile included California, Connecticut, Georgia, Hawaii, Mississippi, Nebraska, and New York, which had approximately three times higher AAMRs compared with states in the lower 10th percentile, which included Alaska, Delaware, Illinois, Maine, Maryland, Minnesota, Oregon, and Wisconsin (Supplementary Table SVI).
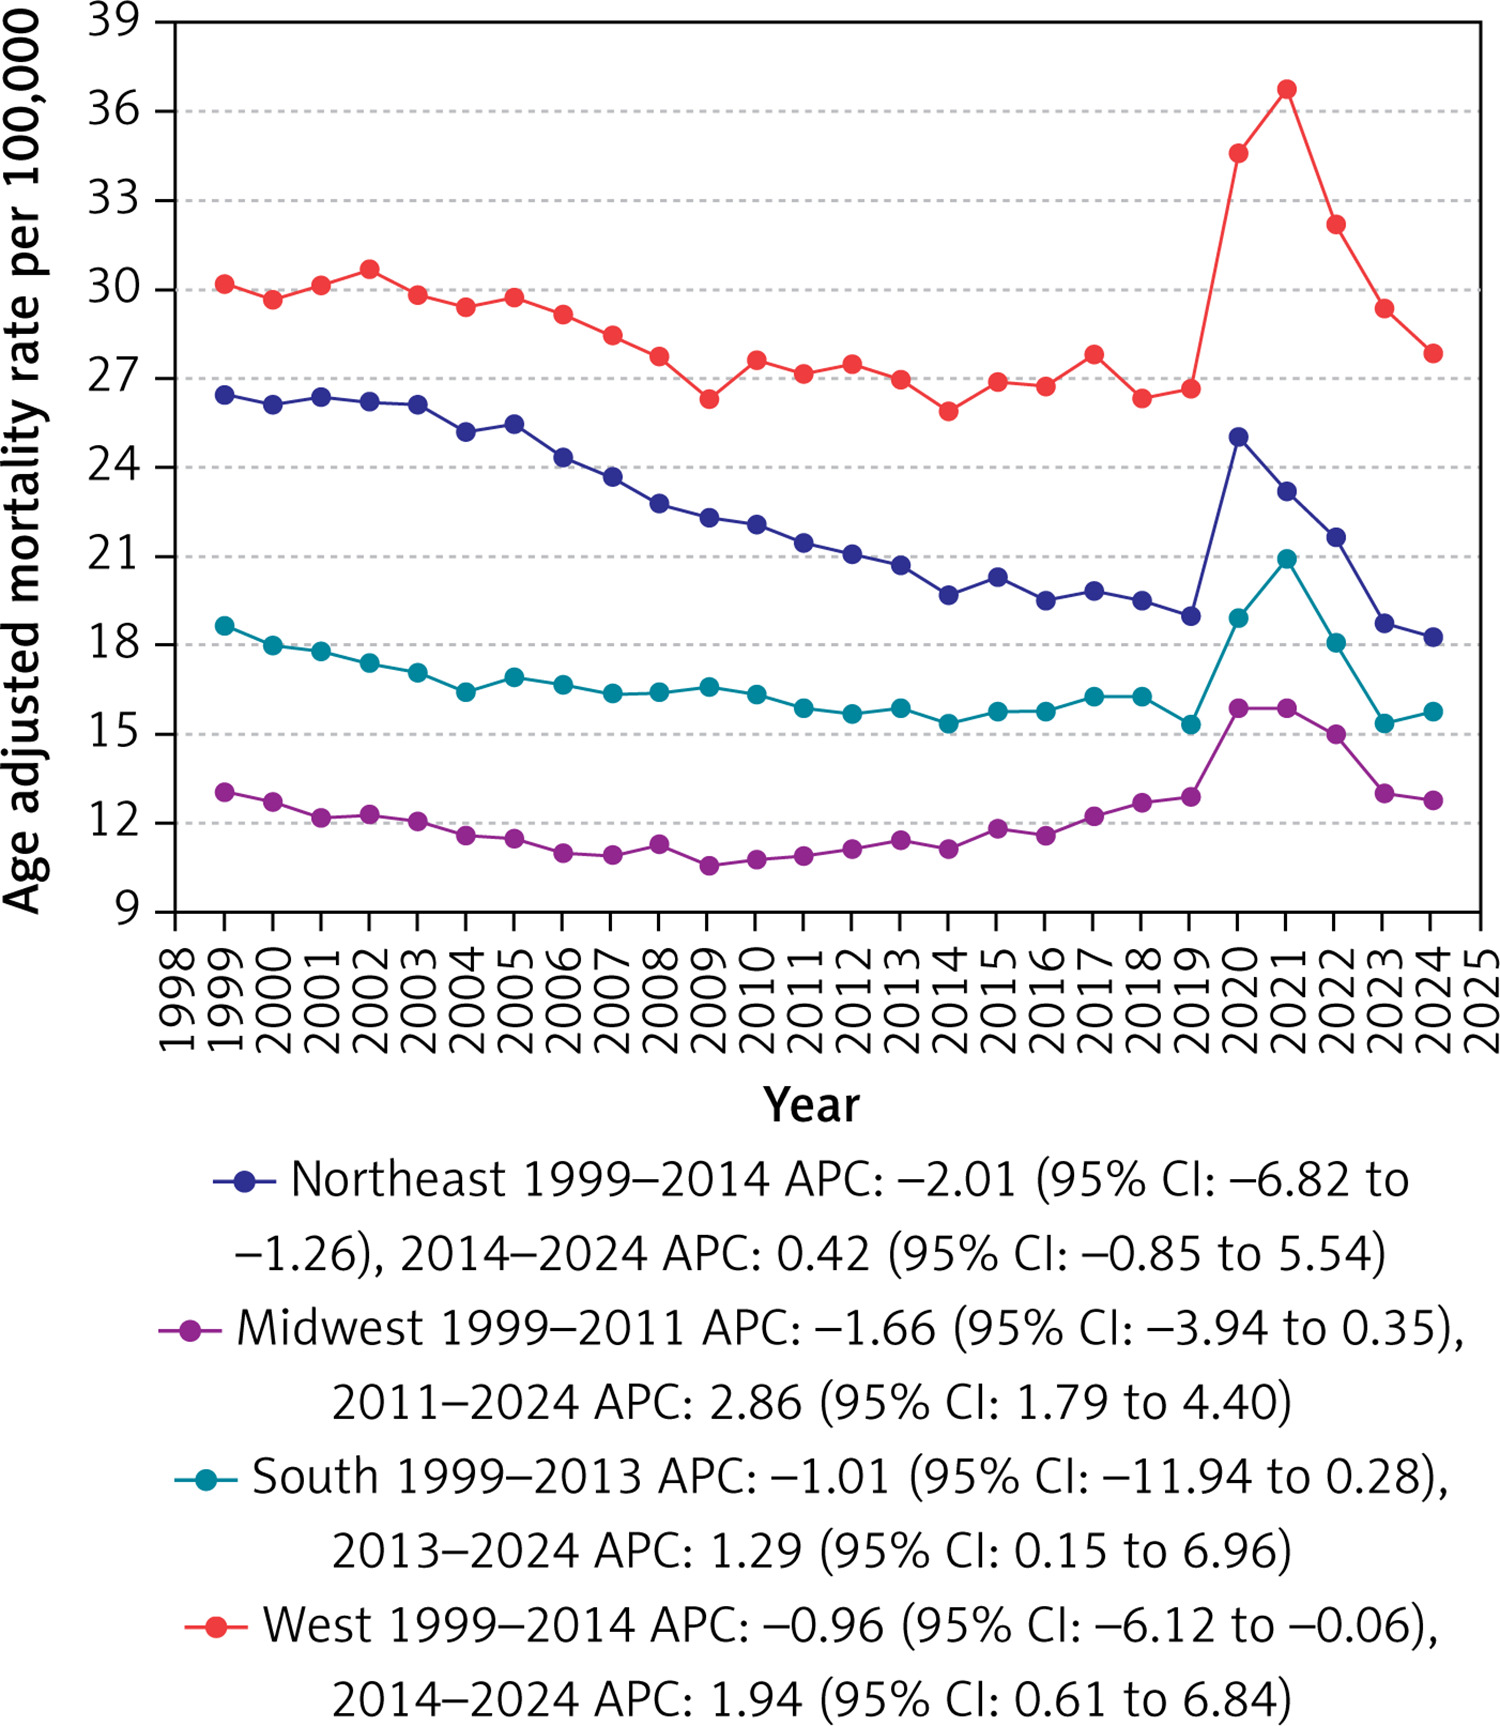
On average, over the study period, the highest mortality rates were observed in the Western (AAMR: 29.0; 95% CI: 28.5 to 29.4), followed by the Northeastern (AAMR: 22.5; 95% CI: 22.1 to 23.0), Southern (AAMR: 16.8; 95% CI: 16.5 to 17.0), and Midwestern regions (AAMR: 12.2; 95% CI: 11.9 to 12.6) (Table II, Supplementary Tables SIII and SVII, Figure 4).
Figure 4
Cardiac arrest with diabetes mellitus-related age-adjusted mortality rates per 100,000 stratified by Census regions among adults aged ≥ 25 years in the United States, 1999 to 2024
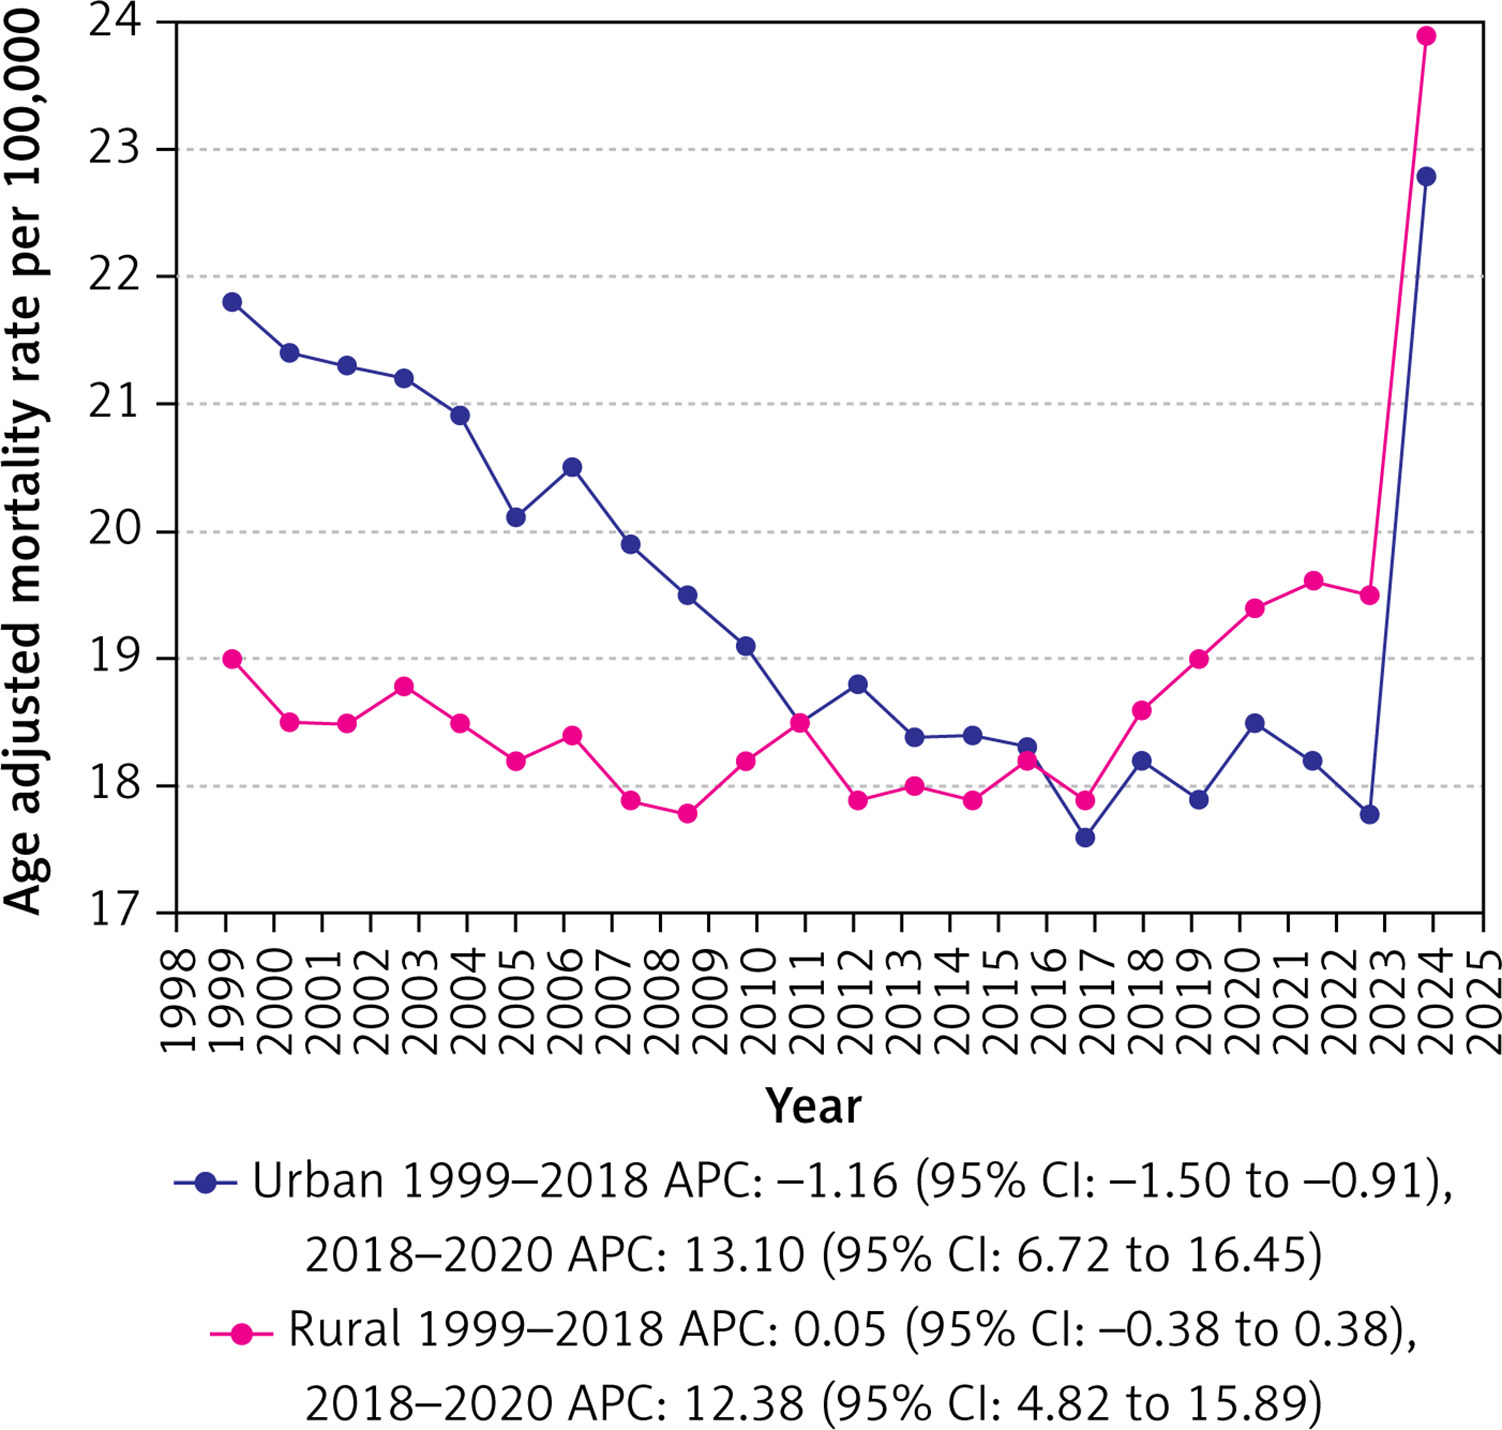
Urban areas exhibited slightly higher AAMRs than rural areas throughout the study period, with overall AAMRs of 19.4 (95% CI: 19.3 to 19.4) and 18.7 (95% CI: 18.6 to 18.8), respectively. On average, the AAMR of urban areas decreased from 1999 to 2020, whereas that of rural areas showed an increase (urban: AAPC: –0.62; 95% CI: –1.11 to –0.13; p = 0.01; rural: AAPC: 1.17; 95% CI: 0.66 to 1.45; p < 0.001) (Supplementary Tables SIII and SVIII, Figure 5).
Sensitivity analysis
1) Mortality trends with CA as the underlying cause of death
Across 1999–2024, 432,178 deaths had cardiac arrest coded as the underlying cause of death. The AAMR declined from 11.8 in 1999 to 6.0 in 2024 with an AAPC of –2.4 (95% CI: –2.94 to –1.94; p < 0.001). Mortality rates experienced a statistically significant decline from 1999 to 2001 (APC –10.31%; 95% CI: –13.51 to –3.82; p < 0.001), followed by more gradual, non-significant decreases from 2001 to 2012 (APC –2.92%; 95% CI: –4.75 to 0.54; p = 0.066), and finally a modest decrease till 2024 (APC –0.52%; 95% CI: –6.34 to 4.08; p = 0.586) (Supplementary Tables SXI and SXII, Supplementary Figure S1).
2) CA with CVD mortality trends
CA with other CVDs accounted for a total of 9,237,793 deaths between 1999 and 2024 with AAMRs decreasing from 203.9 in 1999 to 133.4 in 2024 with an AAPC of –1.79 (95% CI: –2.09 to –1.58; p < 0.001). AAMRs experienced a significant decline during 1999–2007 (APC –3.03%; 95% CI: –6.03 to –2.22; p = 0.006), a smaller, non-significant decline from 2007–2018 (APC –1.13%; 95% CI: –1.92 to 0.18; p = 0.078), a significant increase during 2018–2021 (APC 5.13%; 95% CI: 1.53 to 6.77; p < 0.001), and a subsequent significant decrease from 2021–2024 (APC –7.42%; 95% CI: –10.33 to –5.02; p < 0.001) (Supplementary Tables SXI and SXII, Supplementary Figure S2).
Discussion
Our detailed analysis of mortality data from CDC WONDER, spanning from 1999 to 2024, highlights critical trends in cardiac arrest (CA) mortality among individuals with diabetes. The insights gained from our study are vital for effectively understanding and combating cardiac arrest mortality, and they include the following key findings: 1) from 1999 to 2024, 1,146,259 deaths listed both cardiac arrest (I46.x) and diabetes (E10–E14). 2) from 1999 to 2018, the AAMR for diabetes-related CA decreased significantly, reaching an APC of –0.94, following a rise from 2018 to 2021 with an APC of 11.02, 3) Men face higher AAMRs than women, reflecting a greater decrease for women, 4) NH Blacks and Hispanic individuals have the highest AAMRs, with significant decreases across all racial groups.
Our analysis shows that between 1999 and 2024, CA and diabetes-related mortality decreased until 2018, followed by a subsequent increase after 2021. The continuous decline in mortality has been closely linked to significant improvements in both cardiac emergency response and chronic disease management. Since diabetic individuals have twice the risk for heart disease, special measures targeting this group have shown promising outcomes [21]. The long-term decline may be consistent with improvements in OHCA systems of care (e.g., bystander CPR, AED availability, EMS response), but we cannot ascribe causality because treatment/exposure data are not present in WONDER [22, 23]. Also, there is improvement through stricter adherence to Advanced Life Support (ALS) guidelines, along with compliance with post-cardiac arrest management, such as the chain of survival concept by the American Heart Association [24].
Furthermore, these trends may coincide with increasing use of cardioprotective therapies and revascularization strategies; however, our dataset lacks medication/procedure linkage, so these remain hypotheses requiring external corroboration [25–28]. Lastly, increasing access to BP-lowering medications and statin use, along with preventative interventions such as PCI, CABG, and ICDs among high-risk diabetic populations, lowers the risk of fatal arrhythmias and ischemic events that commonly lead to CA [29, 30]. However, the COVID-19 pandemic had a multifaceted impact on this population, as diabetic patients were at higher risk for severe illness, such as systemic inflammation, thrombotic events, and direct myocardial injury [31]. The isolation and lockdown further led to reduced exercise, poor chronic disease management, delayed care, and avoidance of checkups, both routine and emergency [32]. Furthermore, there was a marked rise in out-of-hospital cardiac arrests (OHCA), with emergency response delays and reduced bystander CPR resulting in lower survival rates [33, 34]. Overall, the mortality is still considerable, and there is a dire need for continued management and improvement of cardiovascular health for diabetic patients.
Our findings are consistent with higher AAMRs among men than women. This aligns with previous data showing that men had a higher prevalence of hypertension, dyslipidemia, and smoking [35]. Also, biological factors such as androgen-driven differences in cardiac electrophysiology and central adiposity may further heighten risk [36, 37]. Although cardiac care for women has historically lagged behind men, recent decades have witnessed growing awareness of female-specific cardiovascular risk, increased inclusion of women in clinical trials, and improved adherence to guideline-directed therapies, which may partly explain this trend [36], In contrast, men with diabetes continue to carry a disproportionately high burden of clustered risk factors, including higher rates of smoking, visceral obesity, and metabolic syndrome, while showing slower improvements in risk factor control over time, which may explain the relatively stagnant mortality trends in this group [35]. Still, women often present with atypical symptoms and remain underdiagnosed for cardiovascular risk, which delays and worsens outcomes [38–41], highlighting the importance of sex-specific prevention and timely diagnosis.
Accordingly, CA with DM-related AAMRs were by far the highest for older adults, consistent with the cumulative burden of coronary atherosclerosis, heart failure, autonomic neuropathy, and competing multimorbidity that amplify arrhythmic risk with advancing age [42, 43]. Middle-aged adults demonstrated intermediate rates, with only a modest decline, suggesting that improvements in risk-factor control and cardioprotective therapies (e.g., statins, revascularization, SGLT2 inhibitors) may only partially offset rising obesity and diabetes duration in this group [21]. In contrast, although younger adults had the lowest absolute AAMRs, their significantly increasing trend is of concern and mirrors reports of worsening cardiometabolic profiles and premature cardiovascular events in younger populations with diabetes [44, 45]. This pattern suggests that gains apparent in older adults are not being fully replicated earlier in the life course, and efforts to achieve earlier identification of diabetes, aggressive risk-factor modification, and tailored prevention of sudden cardiac arrest in younger and middle-aged patients are necessary.
NH Black and Hispanic adults consistently exhibited the highest AAMRs from 1999 to 2024. This is supported by national data showing that NH Black adults with diabetes have nearly double the risk of sudden cardiac death compared with NH Whites [46]. Contributing factors include higher prevalence of obesity, hypertension, and socioeconomic disadvantage, along with structural barriers to advanced therapies and timely emergency response [47]. Moreover, hypertension and poverty lead to an excess cardiovascular disease burden, measured in thousands of additional cases per 100,000, in these groups relative to NH White adults. While all groups experienced mortality declines, the persistence of gaps for NH Blacks and Hispanics underscores the influence of systemic inequities. These groups have consistently poorer access to cardiovascular care, particularly advanced heart failure treatment, and are burdened due to higher financial barriers to care [48]. Additionally, 29% of NH Blacks and 13% of Hispanics were uninsured, as compared to 7% of NH Whites [49]. Also, therapeutic drug access is striking, as the people have significantly lower odds of receiving SGLT2 inhibitors and GLP-1 receptor agonists than White patients, even after adjusting for relevant variables [50]. Therefore, culturally tailored interventions, equitable access to cardioprotective agents (e.g., SGLT2 inhibitors, GLP-1 receptor agonists), and strengthened community-based cardiovascular prevention remain crucial to narrowing these disparities. The observed disparities persisted in sensitivity analyses; interpretation should consider potential misclassification in race/ethnicity reporting and differences in diabetes prevalence across groups.
Geographic variation also significantly affects diabetes-related cardiac arrest mortality. While prior CDC analyses have consistently found that the “Stroke Belt” (a cluster of Southeastern states) experiences disproportionately higher cardiovascular and diabetes-related mortality compared to the rest of the nation [51], our analysis shows that the West has the highest burden of deaths (mean AAMR: 29.0) from cardiac arrest in diabetic individuals, highlighting the need to shift the healthcare attention to the West. This higher mortality may stem from elevated obesity and diabetes prevalence, higher incidence of in-hospital cardiac arrest, higher hospital and treatment costs, and potential concentration of underserved populations in large rural areas [52]. Our analyses indicate that urban adults with diabetes had higher CA-with-DM AAMRs compared with their rural counterparts, consistent with evidence that urbanization and deprived city neighborhoods cluster obesity, diabetes and hypertension, increasing cardiometabolic risk [53]. Short-term exposure to fine particulate air pollution in highly urbanized settings also increases out-of-hospital cardiac arrest risk [54]. In contrast, lower rural AAMRs may partly reflect misclassification and underreporting of deaths on medical certificates, particularly for out-of-hospital events [55]. Considering this evidence, newer studies are needed to ascertain the reasons behind high AAMR in urban regions in patients with CA and DM. Similarly, states in the highest mortality percentile were California, Connecticut, Georgia, Hawaii, Mississippi, Nebraska, and New York, reflecting overlapping cardiometabolic and systemic challenges. Geographic variation persisted across states. Part of this heterogeneity may reflect age structure and diabetes prevalence, with regional differences attenuated. Urban–rural comparisons are reported only until 2020 due to data availability, with urban AAMR slightly higher than rural (19.4 vs. 18.7). These results should be interpreted with attention to terminal-event coding, provisional status of recent years, and the use of population denominators rather than per-diabetic denominators. We have therefore treated subgroup trend tests as exploratory and outlined specific methodological extensions (e.g., CVD-underlying sensitivity, per-diabetic rates, and an ITS with a 2020 intervention) as priorities for future work.
Efforts to reduce diabetes-related cardiac arrest disparities must center on equitable access to proven therapies, strengthened emergency infrastructure, and systemic policy reform. Increasing the affordability and utilization of agents such as SGLT2 inhibitors, GLP-1 receptor agonists, and statins, along with culturally tailored prevention programs, may help reduce the disproportionate burden on minority communities. Concurrently, investments in AED deployment, bystander CPR training, telemedicine, and enhanced EMS capacity are critical for improving outcomes in underserved rural and regional settings. Simultaneously, prioritizing research on sex-based disparities and implementing policy reforms to eliminate financial and geographic barriers are critical to securing lasting, equitable reductions in mortality.
This analysis relies on death certificate data from CDC WONDER and is therefore subject to misclassification of causes and terminal-event coding (ICD-10 I46.x often reflects the terminal mode of dying rather than the etiologic cause). Our primary estimand was the age-adjusted mortality rate per 100,000 U.S. adults; we did not re-express rates per diabetic population, which would require consistent age-standardized diabetic denominators across geographies and years. As such, population AAMRs reflect both risk among people with diabetes and changes in diabetes prevalence, and should be interpreted accordingly.
For trend modeling, we used standard Joinpoint defaults and reported APC/AAPC, but we did not impose a minimum segment-length constraint or report BIC tables, and we did not fit an interrupted time series with a 2020 intervention; our year-by-year tables are provided to aid visual assessment of pre- and post-pandemic behavior. Urban–rural analyses are limited to 1999–2020 because urbanization is only available until 2020 in WONDER; post-2020 urbanicity trends were not evaluated. Race/ethnicity categories were harmonized over time; some analyses necessarily used an aggregate “Non-Hispanic Other” category for stability, and we did not present age-specific rates or rate ratios for disaggregated groups where suppression risks were high. Subgroup APC/AAPC tests should be viewed as exploratory, as we did not adjust for multiple comparisons (no FDR control). Finally, 2024 data are provisional and may be revised; while we reference a 2023-truncated sensitivity in Supplemental Figure S3, residual uncertainty remains for the most recent years.
In conclusion, from 1999 to 2024, although there was a decline in mortality from diabetes-related cardiac arrest in the United States, disparities by sex, race/ethnicity, and geography exist, which underscores the disproportionate burden borne by men, NH Black and Hispanic adults, and residents of high-burden regions. There have been advances in cardiovascular care and increased recognition of diabetes as a serious health concern. However, the recent surges in mortality between 2018 and 2021 and the COVID-19 pandemic highlight the vulnerability of these populations. Therefore, long-term and continued investment in equitable access to cardioprotective agents, culturally tailored prevention [56, 57], and strengthening of rural and regional emergency response systems is essential for progress and to end the persistent mortality gaps.