

Introduction
In 2023, the worldwide incidence of cardiometabolic multimorbidity (CMM) had risen significantly. In China, the incidence escalated from 2.41% in 2010 to 5.94% in 2016, indicating an almost twofold increase [1]. In European countries, the mean annual increase of CMM from 2004 to 2017 ranged from 2.3% to 6.9%, corresponding to 1.3–2.2 times the level recorded in 2004 [2]. CMM has become a major global risk factor for mortality rates and a key burden on health budgets worldwide. Notably, among patients with depression, CMM is correlated with a substantially elevated all-cause mortality risk, showing a 10-year cumulative mortality of 39.51% – far exceeding the 25.05% observed in non-depressed individuals [3]. These findings underscore the urgent need to address CMM among individuals with depression.
A growing body of evidence reveals a complex and closely interrelated relationship between depression and CMM [4, 5]. Specific indicators of metabolic dysfunction, such as the atherogenic index of plasma (AIP) and the triglyceride-glucose (TyG) index, are thought to mediate or amplify this risk. As there is currently no standardized nomenclature for the co-occurrence of depression and CMM, we propose the term “depression-metabolic-CMM syndrome” (DMC). This terminology aims to bridge the existing conceptual gap in research regarding this multidimensional clinical entity, thereby providing a theoretical framework for precise risk stratification and personalized interventions in populations at high risk of depressive symptoms. The synergistic association between depression and CMM can substantially increase the risk of cardiovascular events, multi-organ dysfunction, and adverse overall prognosis. Epidemiological data from 2015 to 2020 indicate that the prevalence of DMC among adults is approximately 18–25%, with higher rates observed in low-income and socioeconomically disadvantaged groups [6, 7]. This population also faces a significantly increased healthcare burden; depressive symptoms can raise total medical costs by approximately 30–85%, with combined direct and indirect costs accounting for over 30% of total expenditures [8]. Accordingly, the European Society of Cardiology emphasizes the importance of pre-clinical depression screening in high-risk cardiovascular individuals and recommends prioritizing psychological and metabolic interventions in low- to moderate-risk populations to prevent cardiovascular disease (CVD)-related events [9]. Given that the clinical burden of DMC is more substantial than that of isolated CVD, a comprehensive approach to preventing and treating depression, metabolic disorders, and cardiovascular disease is essential for mitigating the rapid progression of DMC.
The AIP is an integrated lipid-based risk indicator used to evaluate the relative strength of pro-atherogenic factors. It reflects the dynamic balance between triglycerides (TG) and high-density lipoprotein cholesterol (HDL-C) and is closely linked to dyslipidemia and the risk of cardiovascular events [10]. However, current evidence remains inconsistent. Several meta-analyses support AIP as an independent biomarker, showing its significant elevation in patients with metabolic syndrome (MetS) and its superiority to traditional lipid ratios [11]. On the other hand, some cohort studies question its sensitivity in non-Asian populations or early, low-risk stages of cardiometabolic kidney disease (CKM). For example, although its association with cardiometabolic disease (CMD) shows significant gender differences, this relationship may be influenced by genetic and environmental factors, leading to predictive heterogeneity [12]. The TyG, a substitute predictor of insulin resistance based on fasting TG and glucose levels, is associated with impaired insulin signaling and vascular injury [13]. Evidence regarding TyG also remains controversial. Some cohort studies support TyG as an independent biomarker, suggesting that elevated TyG levels increase CMD risk in individuals with metabolically healthy obesity (MHO) and that combining TyG with high-sensitivity C-reactive protein (hsCRP) enhances the prediction of multimorbidity [14]. In contrast, several recent studies (2023–2025) have challenged its specificity in non-diabetic or low-risk populations, revealing a U-shaped relationship with death rate from cardiovascular causes and potential overestimation of early CMD risk [15].
Elevated AIP is strongly associated with an increase in self-reported depression risk [15]. Similarly, the TyG index independently predicts incident depression and anxiety, particularly among young adults [16]. Depression, a CMM comorbidity, also profoundly alters metabolic regulation via mechanisms such as chronic inflammation and hypothalamic-pituitary-adrenal (HPA) axis dysregulation [17]. Consequently, it remains unclear whether the CMM risk patterns and thresholds associated with AIP and TyG in this high-risk population differ from those in the general population. Addressing this gap by examining these associations specifically among individuals with depression is essential for improving precision risk stratification in this vulnerable group.
Therefore, given that depressive symptoms and metabolic disturbances are both components of CMM, this cross-sectional study draws on two large community-based cohorts – the China Health and Retirement Longitudinal Study (CHARLS) and the English Longitudinal Study of Ageing (ELSA) – to systematically examine the association patterns, threshold effects, and subgroup variations of AIP and TyG indices in relation to CMM risk among individuals with depression. By employing a dual-cohort validation strategy, this study aimed to generate robust epidemiological evidence to facilitate early risk stratification of DMC, thereby offering a theoretical and practical foundation for identifying individuals at high risk for depression and for developing targeted prevention and intervention strategies, with substantial potential for clinical translation and public health implications.
Material and methods
Study design and sample
Since 2011, the CHARLS has administered a longitudinal study with national representation, focusing on Chinese individuals aged 45 or over, using an intricate, stratified, multistage probability cluster sampling strategy for assessing the health, economic, and social conditions of middle-aged and older adults [18]. Data are collected biennially via household interviews and physical examinations and are released in successive waves. Similarly, since 2002, the ELSA has prospectively followed a cohort of community-based individuals in England who are 50 years of age or older, employing a stratified random probability sampling design derived from the Health Survey for England to examine health and well-being during ageing [19]. ELSA collects data through household interviews, clinical assessments conducted at mobile examination centers, and self-administered questionnaires. This cross-sectional analysis draws on data from CHARLS (2011–2013) and ELSA (2002–2015), including individuals aged 50 years or older who provided complete information on depressive symptoms, blood biomarkers, and CMM. Participants with missing information on age, depressive symptoms status, blood biomarkers, or CMM were excluded. A summary of the CHARLS and ELSA overall design and implementation framework can be found in the supplementary methods.
Depression
Depression was assessed using the Center for Epidemiologic Studies Depression Scale (CES-D), a self-report instrument designed to screen for depressive symptoms by assessing their frequency over the past week [20]. This study applied the 10-item CES-D scale to the CHARLS cohort and the 8-item version to the ELSA cohort. Scoring and depression criteria are in the Supplementary material method. Although the CHARLS cohort employed a 10-item version of the CES-D whose cutoff was ≥ 10/30, and the ELSA cohort used an 8-item version with a cutoff of ≥ 4/8, a recent cross-national harmonization study demonstrated that these version differences have no significant impact on cross-cohort comparability, as differential item functioning adjustments resulted in minimal score discrepancies [21].
Definition of CMM
CMM was considered the concurrent presentation of at least two of the following conditions: hypertension, diabetes, coronary heart disease, and stroke [5]. The prevalence of having ≥ 2 of these cardiometabolic conditions was estimated among individuals with depression. Depression frequently coexists with these cardiometabolic diseases, sharing mutual underlying mechanisms, for example, chronic inflammation, insulin resistance, and autonomic dysfunction [22]. Diabetes and coronary heart disease were operationalized as self-report of a diagnosis established by a physician or qualified health provider, including a history of angina pectoris or myocardial infarction. Stroke was based on a participant’s reported history of a physician- or healthcare professional–confirmed diagnosis [23]. This definition was selected for the following reasons. First, it is consistent with the framework adopted in prior studies using CHARLS and ELSA data, ensuring cross-study comparability [24]. Second, these three conditions were systematically ascertained using standardized protocols in both cohorts, with complete and reliable data availability.
Assessment of metabolic indices
The AIP and the TyG index were employed to quantitatively assess metabolic dysregulation. AIP was computed as log[triglycerides (TG, mmol/l)/HDL cholesterol (HDL-C, mmol/l)] and acts as a proxy for atherogenic risk linked to metabolic abnormalities [25]. The TyG index was determined as ln[fasting TG (mg/dl) × fasting glucose (mg/dl)/2] and was used to indicate insulin resistance and the susceptibility to metabolic syndrome [25]. All biochemical indicators were derived from fasting blood samples.
Covariates
Covariates included age (< 65 vs. ≥ 65 years), marital status (married/cohabiting vs. unmarried, including widowed, divorced, or single), educational level (high school or below vs. above high school), smoking status (non-smoker vs. smoker), and drinking status (non-drinker vs. drinker). All covariates were based on self-reports and used for multivariable adjustment and subgroup analyses [18].
Statistical analysis
In both the CHARLS and ELSA cohorts, baseline characteristics were summarized as prevalence estimates for the overall sample and stratified by CMM status, age, gender, marital status, education level, smoking, and drinking status. We employed multivariable logistic regression to investigate the association. Three hierarchical models were established: Model 1 was a crude model (containing no covariates), Model 2 controlled for age, gender, and marital status, and Model 3 additionally controlled for education level, smoking, and drinking. We assessed the dose–response relationships between AIP and TyG and CMM by stratifying each index into quartiles. We then calculated the odds ratios (ORs) and their 95% confidence intervals (CIs), setting the lowest quartile (Q1) as the reference group. P-values for trends across quartiles were also calculated [26]. Threshold effect analyses were conducted using a two-piecewise logistic regression model to explore potential nonlinear associations. Supplementary material details the statistical analyses. To assess the potential influence of unmeasured confounders on the robustness of our findings, E-value analyses were conducted for the primary associations. The E-value represents the minimum strength of association that an unmeasured confounder would need to have with both the exposure and the outcome to fully explain away the observed association, on the risk ratio scale. All statistical analyses were performed using two-sided tests, and a p-value of less than 0.05 was considered statistically significant.
Results
Participant characteristics
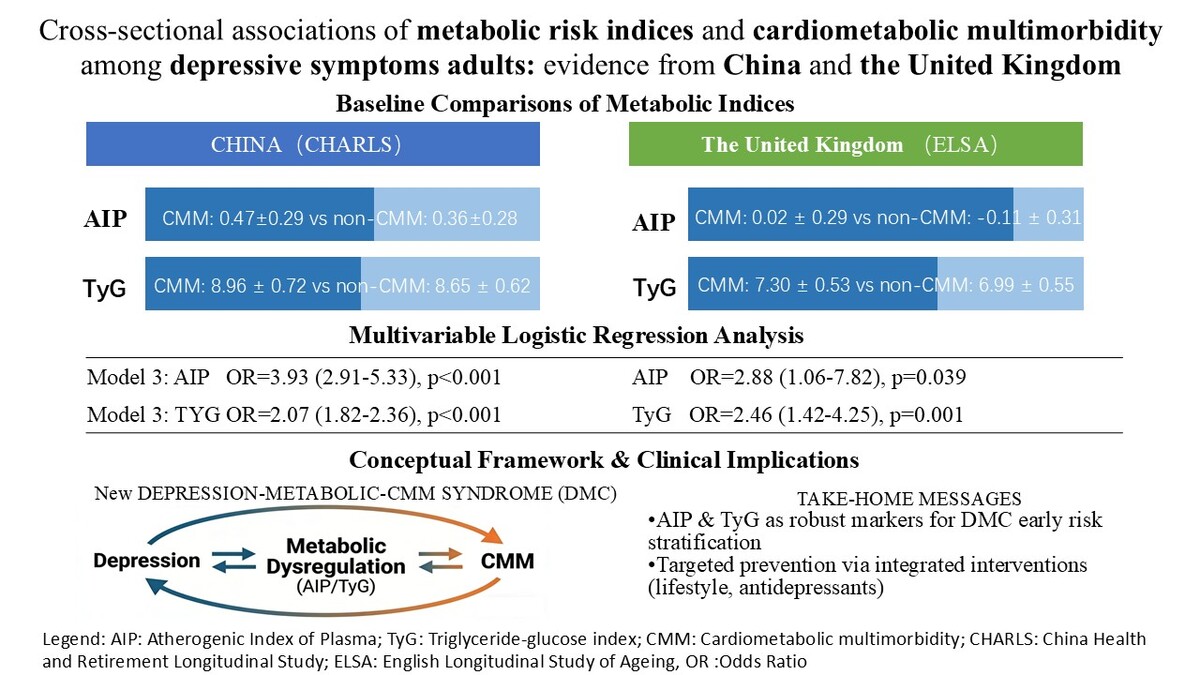
In the CHARLS cohort, 21,097 participants were initially included, excluding 4,621 with missing age information or aged below 50, 7,354 with missing depression information or non-depressed individuals, 4,761 with missing blood test information, and 1,136 with missing CMM information. Ultimately, 3,225 patients with depression were included for analysis. Among them, 676 (21.0%) had CMM. CMM is defined by the coexistence of at least two cardiometabolic diseases, including type 2 diabetes, coronary heart disease, and stroke. Table I summarizes the baseline characteristics stratified by CMM status: compared to the non-CMM group, participants in the CMM group were significantly older (p < 0.001), had a higher proportion of unmarried individuals (p = 0.003), and a higher proportion with high school or above education level (p = 0.015). There were no significant differences in gender (p = 0.092), smoking status (p = 0.856), or drinking status (p = 0.057). The AIP index (0.47 ±0.29 vs. 0.36 ±0.28, p < 0.001), TyG (8.96 ±0.72 vs. 8.65 ±0.62, p < 0.001), and CES-D score (16.2 ±4.8 vs. 15.2 ±4.7, p < 0.001) were all considerably above the average in the CMM group.
Table I
Patient demographics and baseline characteristics in the CHARLS and ELSA cohorts
In the ELSA cohort, 10,601 participants were initially included, excluding 229 with missing age information or aged below 50, 9,056 with missing depression information or non-depressed individuals, and 960 with missing blood test information, ultimately including 353 depression patients for analysis, of whom 56 (15.9%) had CMM. The baseline characteristics of volunteers, stratified by CMM status, are shown in Table I. The comparison of CMM and non-CMM groups showed no significant differences in age (p = 0.314), marital status (p = 0.290), education level (p = 0.486), smoking (p = 0.862), or drinking (p = 0.605). However, a significant gender difference was noted, characterized by a male predominance in the CMM group (50.0% vs. 29.6%, p = 0.003). At the same time, the TyG index (7.30 ±0.53 vs. 6.99 ±0.55, p < 0.001) and AIP (0.02 ±0.29 vs. –0.11 ±0.31, p = 0.004) were also above the average in the CMM group (Supplementary Figure S1).
Association of AIP and TyG with CMM
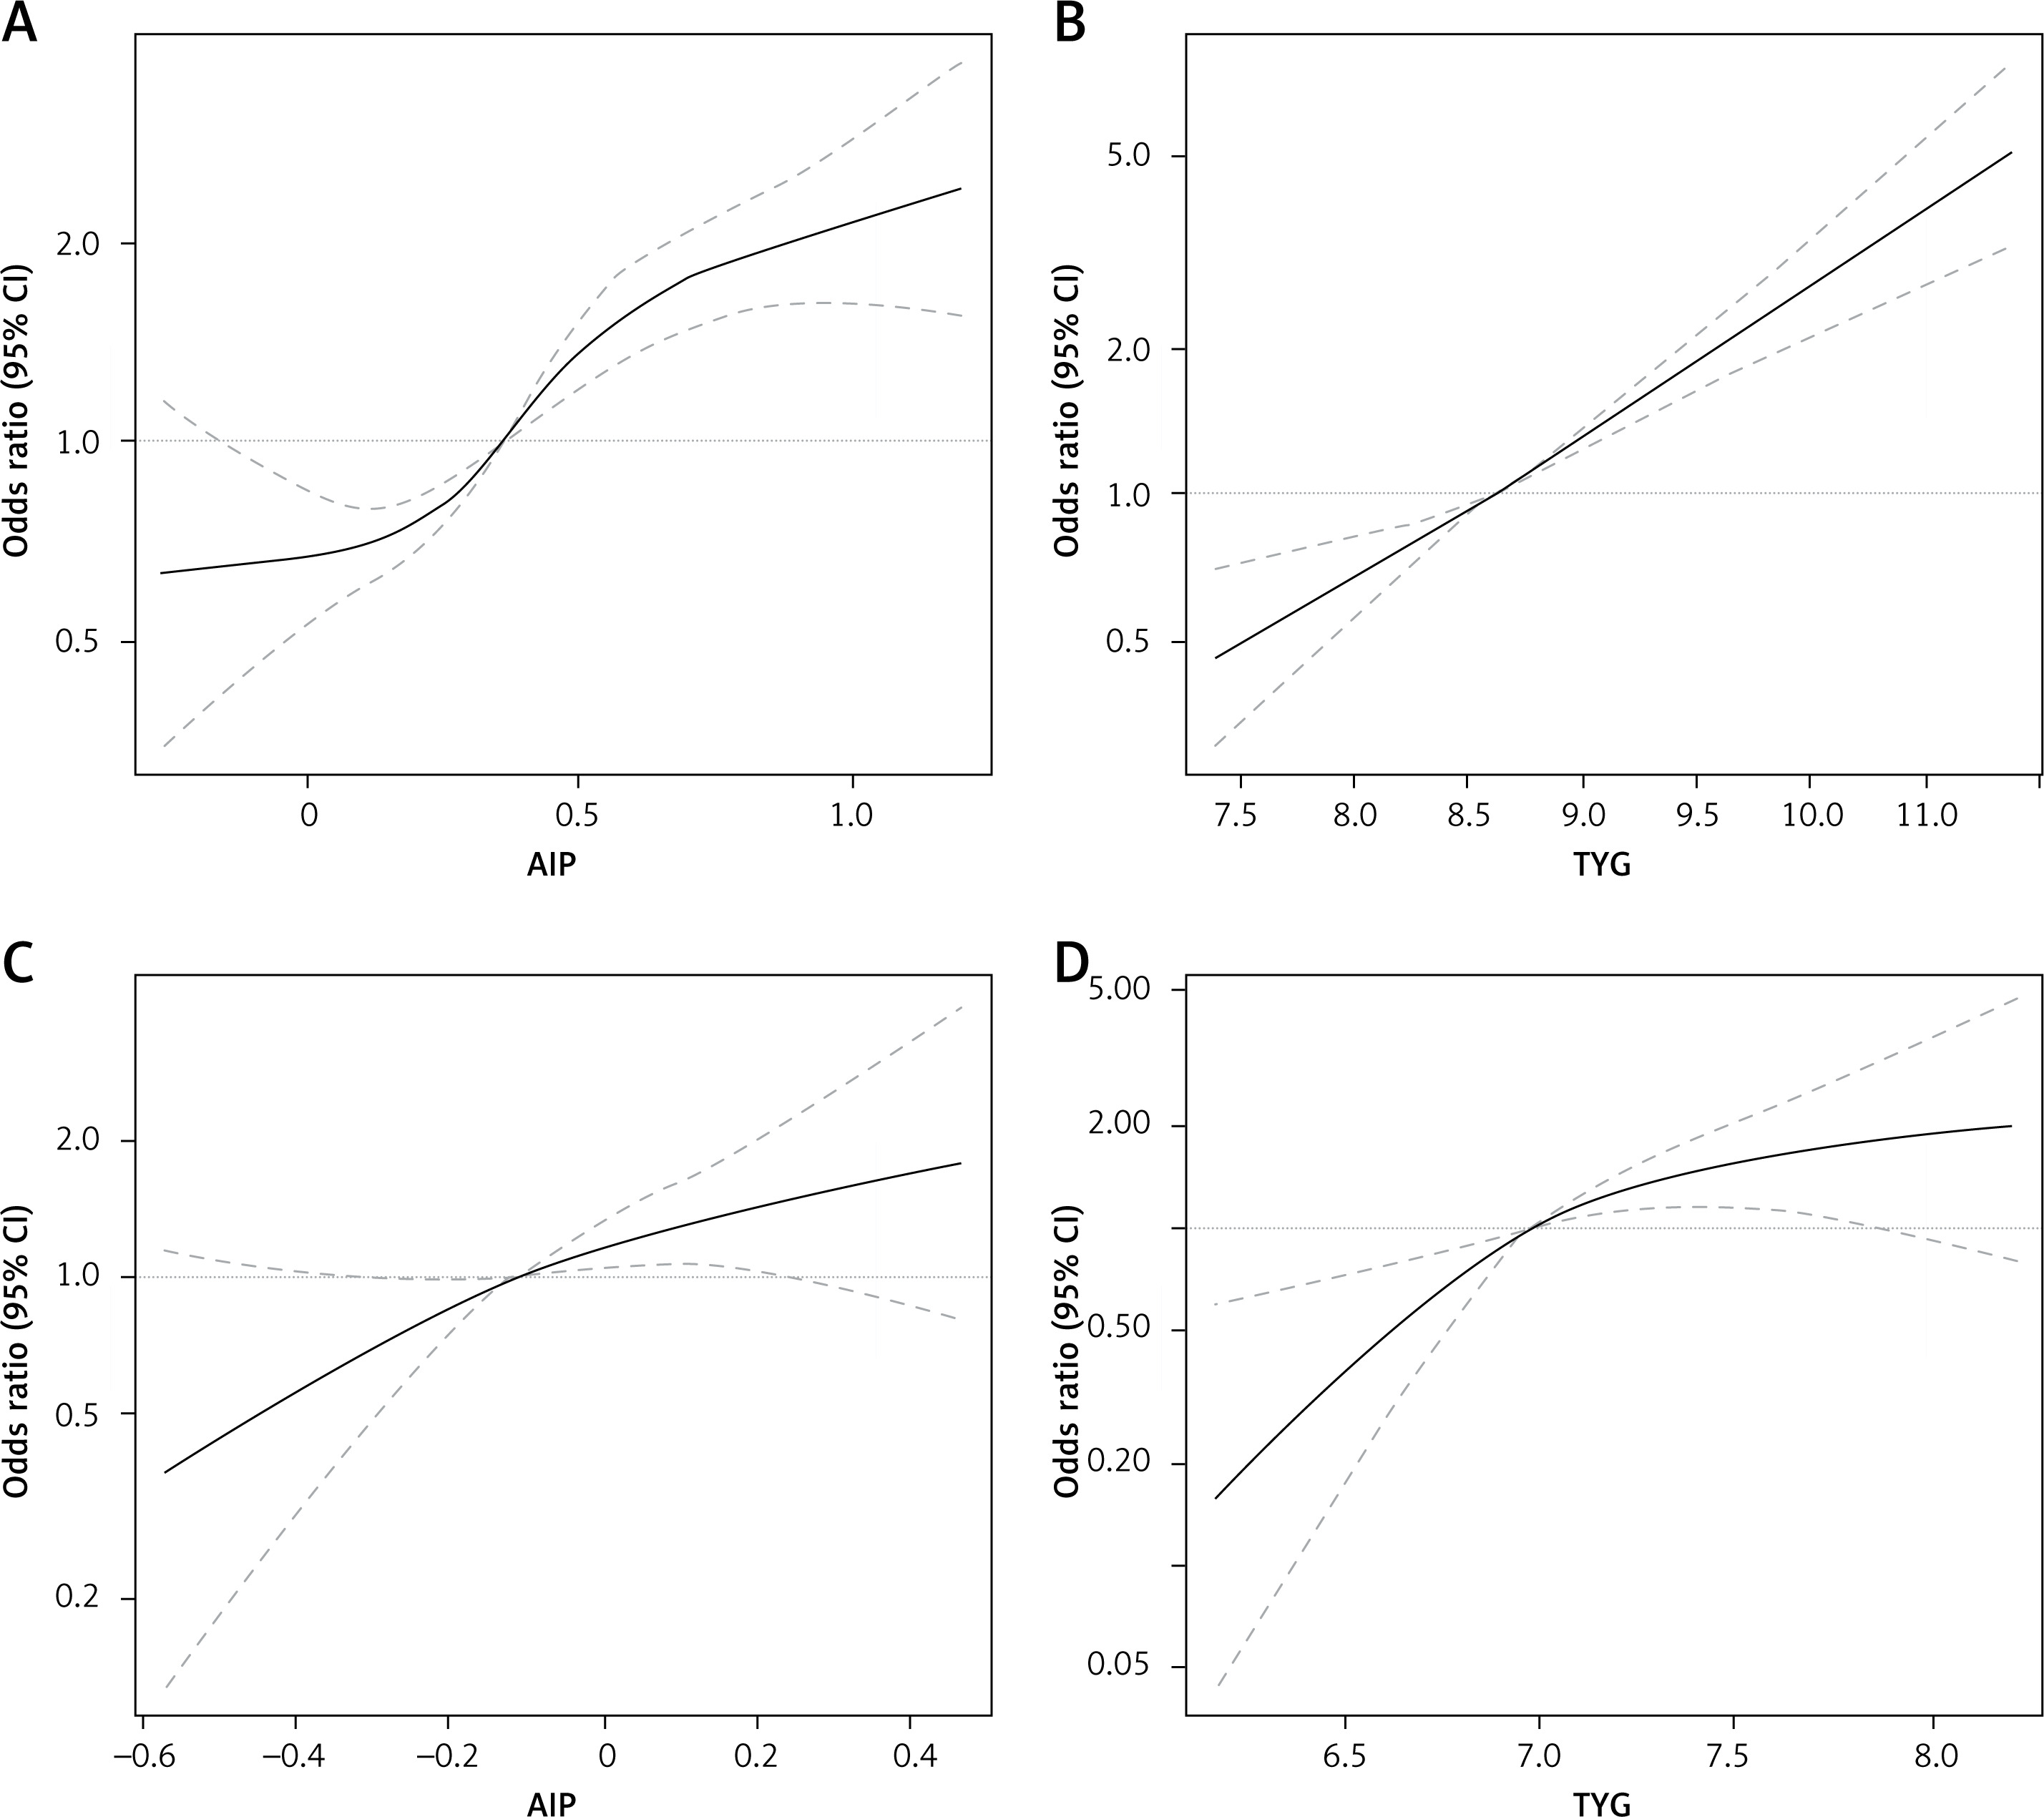
AIP and TyG were significantly positively associated with the risk of CMM in both cohorts. In Model 3, which was completely adjusted (controlling for factors such as age, gender, marital status, education level, smoking, and drinking status), in the CHARLS cohort, the OR per unit increase of AIP was 3.93 (95% CI: 2.91–5.33, p < 0.001), and for TyG the per unit increase was 2.07 (95% CI: 1.82–2.36, p < 0.001) (Figures 1 A, B). In the ELSA cohort, the OR per unit increase of AIP was 2.88 (95% CI: 1.06–7.82, p = 0.039), and for TyG the per unit increase was 2.46 (95% CI: 1.42–4.25, p = 0.001) (Figures 1 C, D).
Figure 1
Adjusted dose-response associations between atherogenic index of plasma (AIP) and triglyceride-glucose (TyG) index and odds ratio (OR) of cardiometabolic multimorbidity (CMM) in the China Health and Retirement Longitudinal Study (CHARLS) and English Longitudinal Study of Ageing (ELSA) cohorts. A – Association between AIP and CMM in the CHARLS cohort. B – Association between the TyG index and CMM in the CHARLS cohort. C – Association between AIP and CMM in the ELSA cohort. D – Association between the TyG index and CMM in the ELSA cohort
Quartile analysis further demonstrated significant dose-response relationships: in the CHARLS cohort, compared to Q1, the ORs for AIP in Q3 and Q4 were 1.69 (95% CI: 1.31–2.19, p < 0.001) and 2.61 (95% CI: 2.04–3.35, p < 0.001), respectively. For TyG, the ORs in Q3 and Q4 were 1.67 (95% CI: 1.28–2.17, p < 0.001) and 2.86 (95% CI: 2.22–3.69, p < 0.001), respectively. All p-values for trend were < 0.001. (Supplementary Tables SI, SII). In the ELSA cohort, for AIP, the OR for Q4 versus Q1 was 2.43 (95% CI: 0.97–6.13, p = 0.059, p for trend = 0.042), and for TyG, ORs for Q3 and Q4 versus Q1 were 4.53 (95% CI: 1.57–13.03, p = 0.005) and 5.18 (95% CI: 1.79–15.03, p = 0.002), with p for trend < 0.001 (Supplementary Tables SIII and SIV).
Threshold effect analysis
In the CHARLS cohort, a piecewise logistic regression analysis was employed to identify the factors associated with the non-linear relationship between AIP, TyG, and CMM, aiming to identify potential threshold effects. This method fits piecewise linear models to detect changes in risk at specific turning points. For AIP (Supplementary Table SV), the identified point was 0.879. Below this threshold, the OR was 4.36 (95% CI: 3.01–6.32, p < 0.001), indicating a strong positive correlation with CMM risk when AIP was below 0.879. However, above this threshold, the correlation was not quite significant (OR = 0.67, 95% CI: 0.05–9.50, p = 0.770). The result suggests that AIP may have a risk turning point at 0.879, with risk increasing rapidly as AIP rises below this value. The log-likelihood ratio was 0.179 (p > 0.05), indicating inadequate proof for such a significant non-linear relationship, but the turning point analysis still provided valuable clues for risk stratification. For TyG (Supplementary Table SVI), the turning point was 9.939. At levels lower than this threshold, the OR was 1.88 (95% CI: 1.59–2.21, p < 0.001). At levels above this threshold, the OR increased to 3.60 (95% CI: 1.20–10.82, p = 0.022), indicating that the risk further increases when TyG exceeds 9.939. This suggests that TyG at higher levels may reflect more severe metabolic abnormalities. The log-likelihood ratio was 0.336 (p > 0.05), similarly not supporting a significant non-linear relationship, but the higher OR values in the high-threshold group emphasized the clinical importance of TyG exceeding 9.939.
In the ELSA cohort, the threshold analysis for AIP (Supplementary Table SVII) identified a turning point at 0.428. Below this threshold, AIP was positively associated with CMM risk (OR = 5.68, 95% CI: 1.81–17.82, p = 0.003). Above the threshold, the correlation was not significant (OR = 0.03, 95% CI: 0.00–1290.65, p = 0.516), possibly because of the limited sample size in individuals with high AIP values, leading to unstable results. These findings suggest that an AIP value of 0.428 may represent a potential threshold, below which AIP was significantly associated with CMM risk. The log-likelihood ratio was 0.271 (p > 0.05), not supporting a significant non-linear relationship, but the turning point analysis still provided a useful reference for risk assessment. For TyG (Supplementary Table SVIII), the turning point was 7.244. At levels lower than the threshold, the OR was 6.48 (95% CI: 1.46–28.78, p = 0.014), while at levels higher than this threshold, it was not significant (OR = 1.27, 95% CI: 0.42–3.83, p = 0.672), suggesting that TyG below 7.244 is most strongly associated with the risk of CMM, possibly reflecting the sensitivity to early metabolic risk. The log-likelihood ratio was 0.196 (p > 0.05), similarly not confirming a significant non-linear relationship, but the high OR in the low-threshold group indicates the predictive value of TyG at lower levels.
ROC curve analysis and predictive value of AIP and TyG
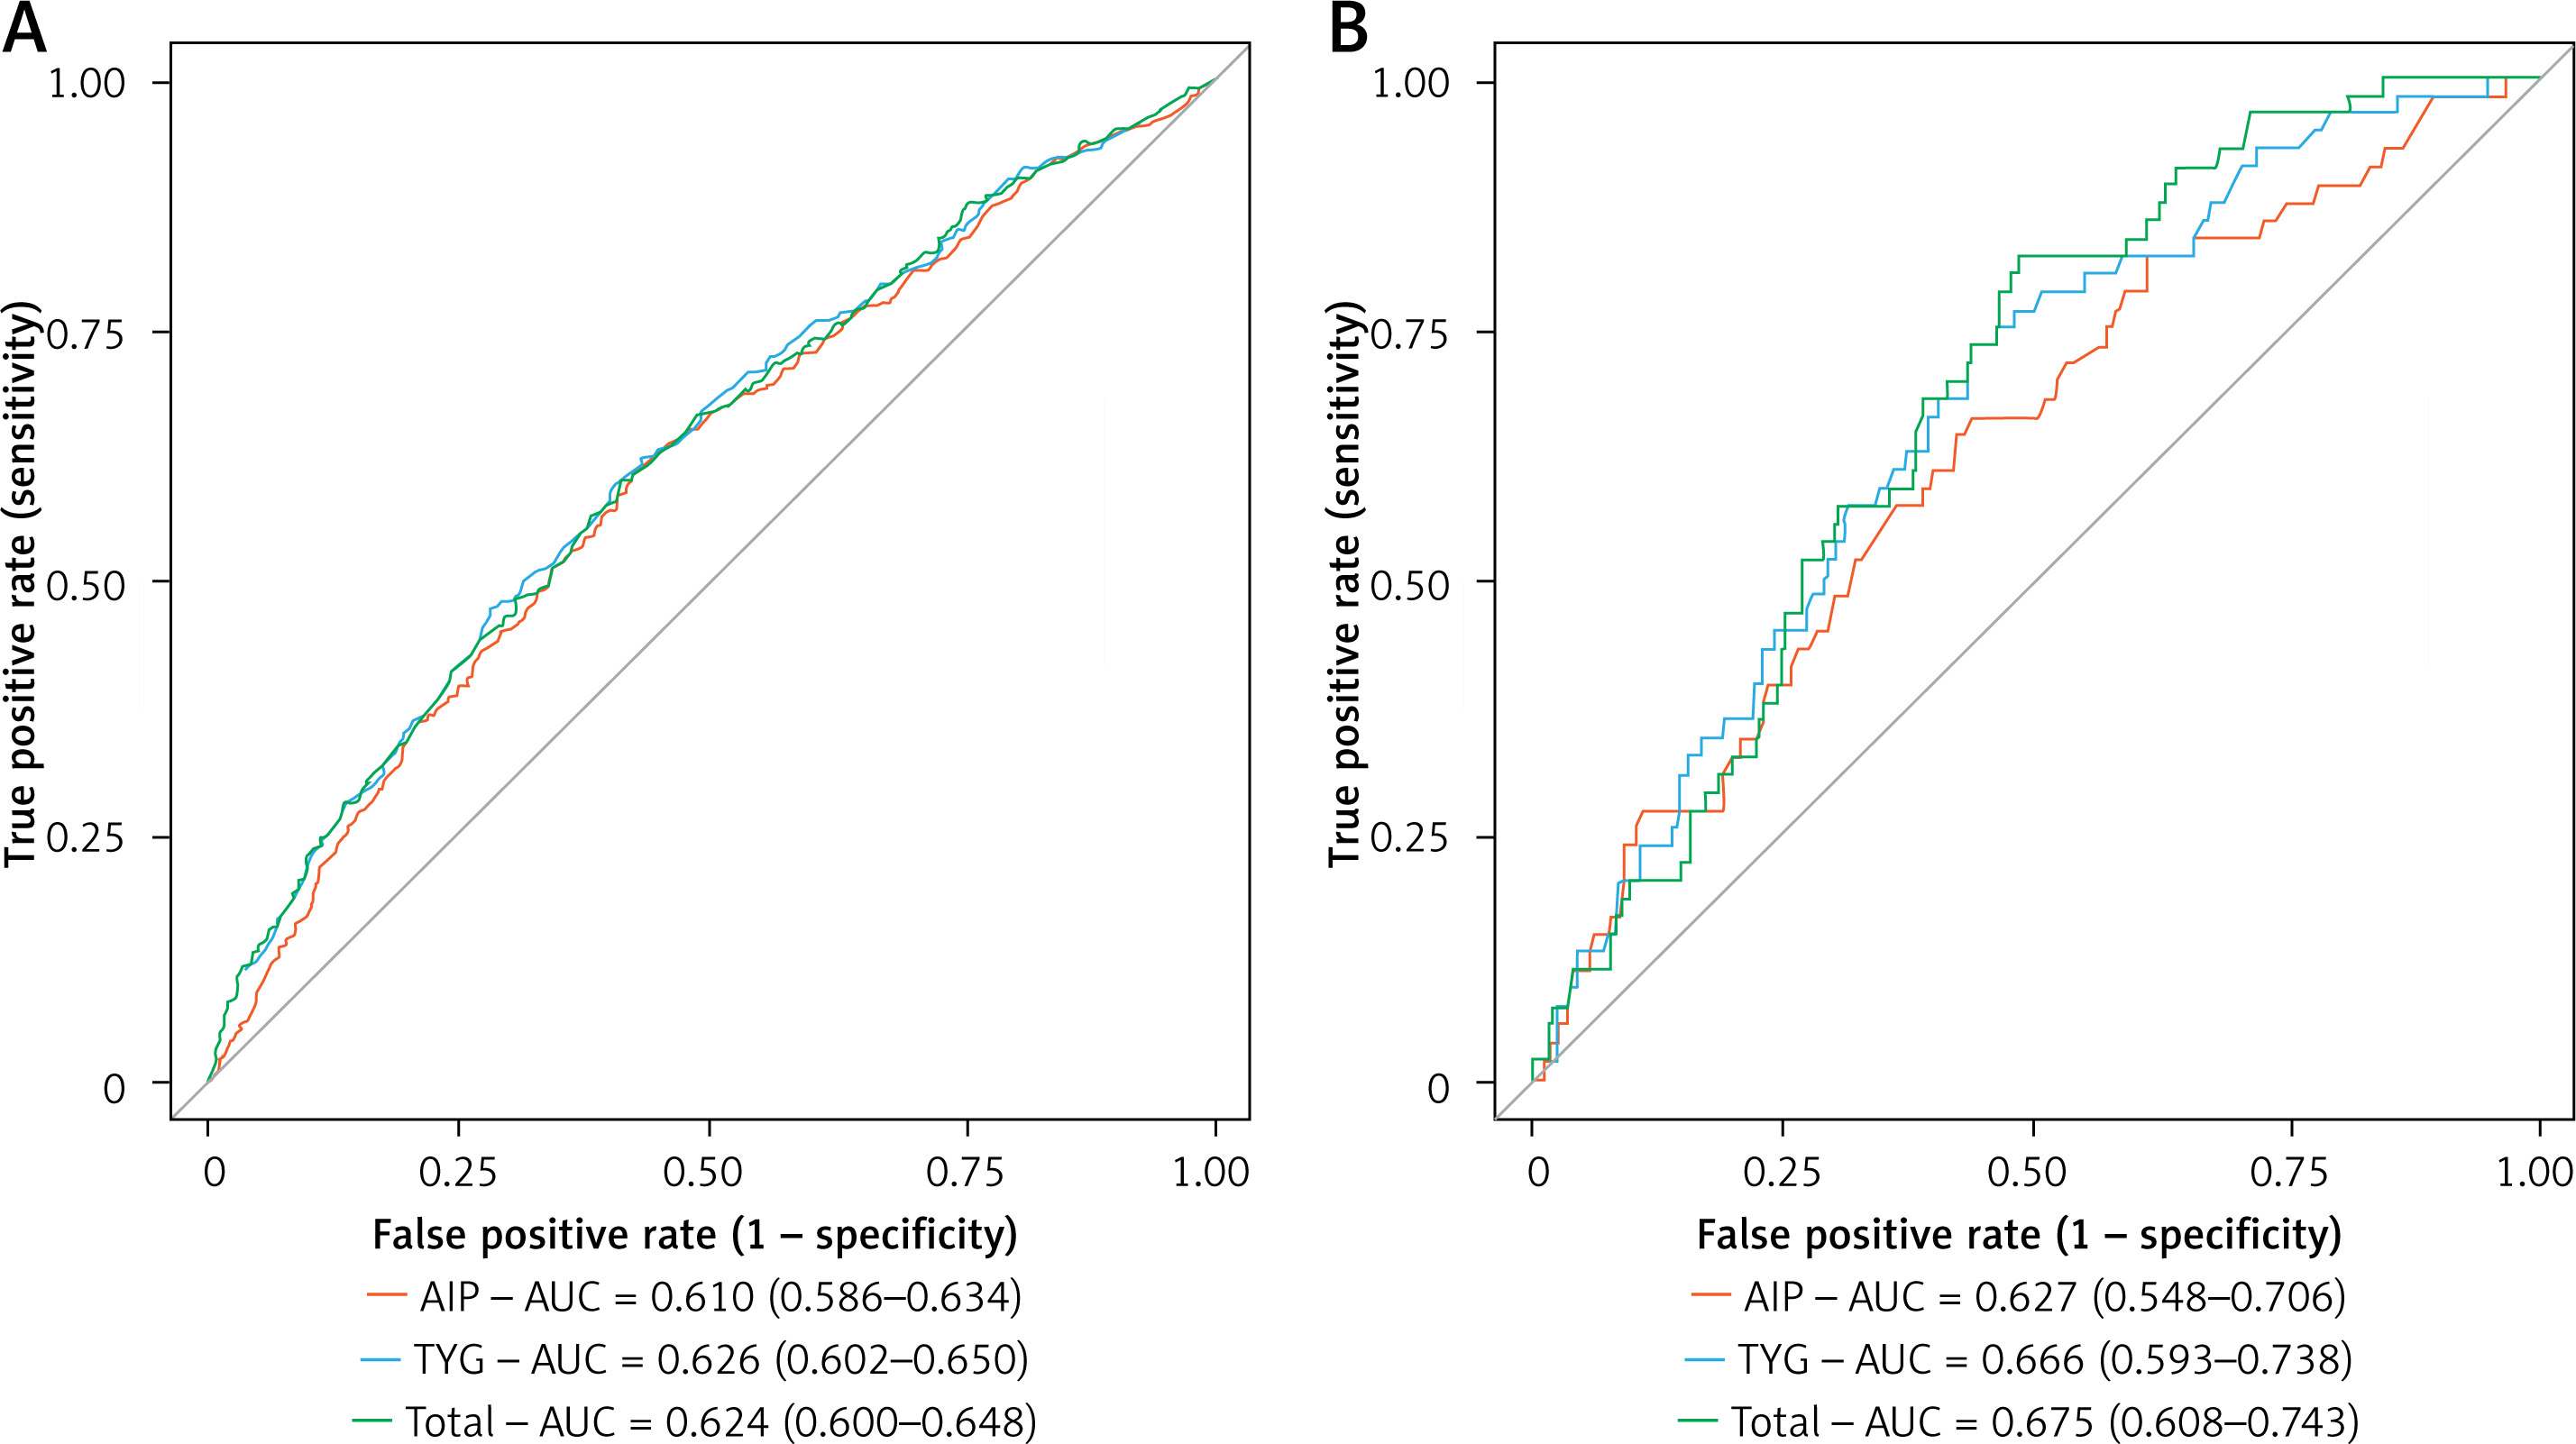
To further evaluate and compare the predictive performance of AIP and TyG for CMM, we conducted receiver operating characteristic (ROC) curve analyses. In the CHARLS cohort, the area under the curve (AUC) values for AIP and TyG were 0.610 (95% CI: 0.586–0.634) and 0.626 (95% CI: 0.602–0.650), respectively. The combined model (integrating both AIP and TyG) yielded an AUC of 0.624 (95% CI: 0.600–0.648), which did not show a significant improvement in predictive sensitivity compared to TyG alone (Figure 2 A). Similarly, in the ELSA validation cohort, the AUCs for AIP and TyG were 0.627 (95% CI: 0.548–0.706) and 0.666 (95% CI: 0.593–0.738), respectively. The combined model achieved an AUC of 0.675 (95% CI: 0.608–0.743), indicating that the combination of the two metabolic indices provided only a negligible predictive gain over the individual markers (Figure 2 B).
Subgroup analysis
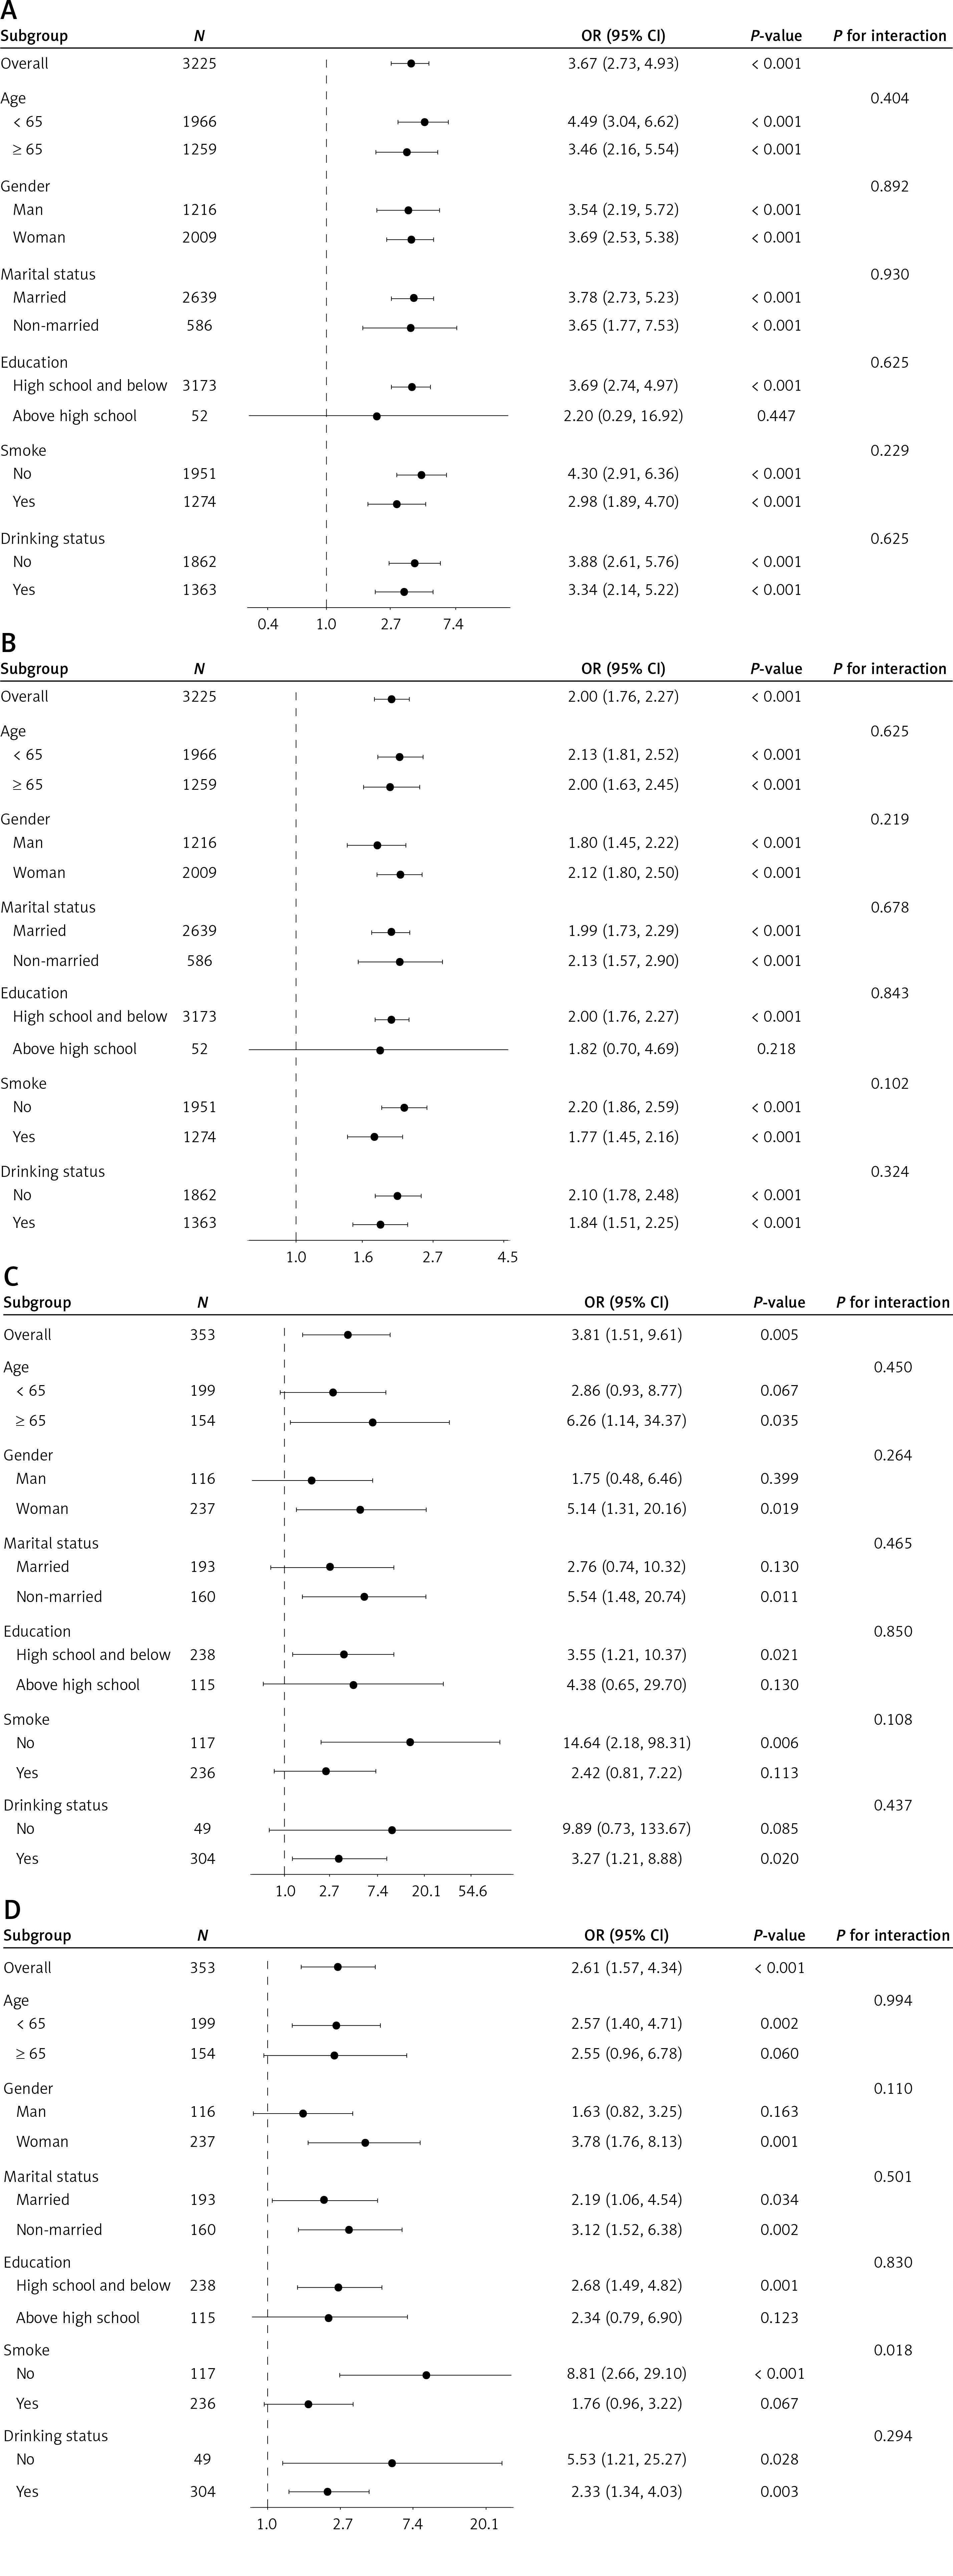
In the CHARLS cohort, the overall OR for AIP (Supplementary Table SIX) was 3.67 (95% CI: 2.73–4.93, p < 0.001), which was significant in all subgroups of age, sex, marital status, smoking, and drinking (p < 0.001), but not significant in the high school or above education level group (OR = 2.20, 95% CI: 0.29–16.92, p = 0.447). No significant interactions were noted among these subgroups (p > 0.05) (Figure 3 A). For TyG (Supplementary Table SX), the overall OR was 2.00 (95% CI: 1.76–2.27, p < 0.001), consistently significant among all subgroups (p < 0.001). Except for the high school or above education level group (p = 0.218), there were no significant interactions (p > 0.05) (Figure 3 B). In the ELSA cohort, the overall OR for AIP (Supplementary Table SXI) was 3.81 (95% CI: 1.51–9.61, p = 0.005), which was significant in subgroups of aged ≥ 65, female, unmarried, high school or below education level, non-smoking, and drinking (p < 0.05), with no significant interactions (p > 0.05) (Figure 3 C). For TyG (Supplementary Table SXII), the overall OR was 2.61 (95% CI: 1.57–4.34, p < 0.001), which was significant in multiple subgroups (p < 0.05). The smoking subgroup showed a significant interaction (p = 0.018), with higher OR in the non-smoking group (8.81 vs. 1.76) (Figure 3 D).
Figure 3
Subgroup analyses of the associations between AIP and TyG and CMM in the CHARLS and ELSA cohorts. A – Subgroup analysis for the association between AIP and CMM in the CHARLS cohort. B – Subgroup analysis for the association between TyG index and CMM in the CHARLS cohort. C – Subgroup analysis for the association between AIP and CMM in the ELSA cohort. D – Subgroup analysis for the association between TyG index and CMM in the ELSA cohort
Sensitivity analysis
To evaluate the potential influence of unmeasured confounders on the robustness of the primary findings, E-value analyses were conducted based on the fully adjusted Model 3 estimates. The E-values for the associations between AIP and CMM were 7.32 and 5.21 in the CHARLS and ELSA cohorts, respectively, and those for TYG and CMM were 3.56 and 4.36, respectively. These substantial E-values indicate that an unmeasured confounder would need to have a risk ratio of at least 3.56-fold with both the exposure and the outcome – above and beyond the measured covariates – to fully explain the observed associations, suggesting that the primary results are unlikely to be attributable to unmeasured confounding alone.
Discussion
This cross-sectional study, based on two large community cohorts – CHARLS and ELSA – investigated the associations of AIP and TyG with the risk of CMM among individuals with depression. Our main findings were as follows: 1) Elevated plasma AIP and TyG levels were independently associated with an increased risk of CMM among individuals with depression, with adjusted odds ratios of 3.93 (95% CI: 2.91–5.33) and 2.07 (95% CI: 1.82–2.36) in CHARLS, and 2.88 (95% CI: 1.06–7.82) and 2.46 (95% CI: 1.42–4.25) in ELSA. 2) Quartile analyses confirmed a dose–response relationship, indicating a progressively increasing risk with higher levels of metabolic dysregulation. 3) Threshold effect modeling identified nonlinear inflection points (AIP: 0.879 in CHARLS vs. 0.428 in ELSA; TyG: 9.939 in CHARLS vs. 7.244 in ELSA), suggesting potential cross-cultural differences in metabolic sensitivity between Chinese and European populations. These findings provide preliminary, exploratory evidence for the possible utility of these indices in risk stratification of DMC; however, prospective studies are warranted to confirm their clinical applicability.
Consistent with previous literature, our findings suggest that that AIP and TyG, as indicators of insulin resistance (IR) and atherosclerosis, are associated with CMM risk. A meta-analysis using the NHANES cohort reported that each one-unit increase in TyG was associated with a 1.31-fold higher risk of cardiovascular events (95% CI: 1.20–1.43), with the association being particularly pronounced in the depression subgroup [27]. Similarly, the potential value of AIP as a marker for atherosclerotic cardiovascular disease risk and its observed correlation with cardiovascular events such as stroke and coronary artery disease have been reported in recent systematic reviews, although this evidence is primarily derived from Asian populations [28]. However, the threshold effects observed in our study are relatively novel. In CHARLS, a TyG value exceeding 9.939 was associated with a sharp escalation in risk, possibly reflecting a “saturation effect” under severe metabolic dysregulation. In contrast, the lower threshold observed in ELSA (TyG 7.244) may indicate earlier metabolic sensitivity among European populations, which could be modulated by genetic and dietary factors [29]. These inter-cohort discrepancies highlight the potential modifying roles of cultural and environmental factors, and suggest the possible cross-cultural relevance of the DMC framework, though further prospective validation is needed. Notably, as shown in Table I, mean TyG and AIP values were consistently higher in the CHARLS cohort than in the ELSA cohort, indicating a greater degree of lipid metabolic disturbance and insulin resistance tendency among the Chinese population. Several factors may account for these inter-cohort differences. First, dietary patterns differ substantially between the two nations, with traditional Chinese diets characteristically higher in refined carbohydrates and animal fats, which may contribute to elevated triglyceride levels and consequently higher TyG and AIP values [30, 31]. Second, racial differences in obesity phenotype, body fat distribution, and genetic metabolic background between Chinese and European populations may further explain the observed discrepancies, as visceral fat accumulation – more prevalent in Asian populations at lower BMI thresholds – is closely associated with dyslipidemia and insulin resistance [32]. These findings highlight the importance of population-specific reference values when applying TyG and AIP in clinical or public health settings across different cultural contexts.
Putative mechanisms include chronic inflammation and the abnormal functioning of the hypothalamic–pituitary–adrenal (HPA) axis may together contribute to insulin resistance (IR). Depressive symptoms may contribute to chronic inflammation, linking elevated cortisol levels to lipid metabolic abnormalities, thereby potentially increasing AIP and TyG levels and possibly exacerbating vascular endothelial injury through activation of the NF-kB signaling pathway [33]. Additionally, TyG, as one surrogate indicator of IR, may be implicated in the progression of CMM in individuals with depression. A longitudinal study reported that elevated baseline TyG was associated with a higher 5-year incidence of diabetes (HR = 1.45, 95% CI: 1.22–1.72) [34]. Beyond these neuroendocrine pathways, behavioral factors may also serve as important intermediary mechanisms linking depression to CMM. Physical inactivity and poor sleep quality (including short sleep duration and sleep fragmentation) have been shown to independently and significantly increase the risk of multimorbidity, with physical activity potentially moderating the relationship between sleep disturbance and CMM [35]. Concurrently, depressive symptoms are associated with poorer adherence to healthy dietary patterns such as the Mediterranean diet, while the combination of healthy diet and higher physical activity levels has been shown to synergistically reduce the risk of multimorbidity and all-cause mortality [36, 37]. Furthermore, individuals with depression frequently exhibit reduced adherence to pharmacological treatments for chronic conditions, which may further accelerate cardiometabolic disease progression. Collectively, these behavioral factors not only mediate the impact of depression on CMM but also represent actionable targets for integrated intervention strategies. The nonlinear thresholds identified in this study support the “U-shaped” curve hypothesis, suggesting that clinical interventions should focus on the pre-threshold window to prevent excessive metabolic burden, with particular attention to both neuroendocrine and behavioral risk factors in high-risk depressive populations.
These findings may have relevance to both clinical practice and public health. First, this study integrates data from two large, multiethnic community-based cohort databases (CHARLS and ELSA), and simultaneously examined the associations of two complementary metabolic dysregulation indices (AIP and TyG) with the risk of CMM among midlife-and-beyond individuals with depression, observing dose–response relationships and nonlinear threshold effects. These findings may offer preliminary reference values for the early assessment of DMC, though their clinical utility requires further validation in prospective studies.
Second, the present study introduces the concept of DMC, which integrates depressive symptoms, metabolic disorders, and CMM into a unified framework. Similar to the American Heart Association’s CKM syndrome, DMC places greater emphasis on depression as an “intervention entry point” for the prevention of multi-organ diseases. These findings may help address gaps in existing literature limited to single cohorts or linear analyses, and provide a preliminary basis for cross-cultural precision interventions, such as threshold-guided metabolic monitoring combined with multimodal therapies (e.g., lifestyle optimization and antidepressant treatment), which may contribute to efforts aimed at reducing global CMM incidence. At the same time, optimized resource allocation could help alleviate the global burden of depression-related health problems.
This study has several limitations. First, comorbidity diagnoses primarily relied on self-reports, which may have resulted in recall bias and misclassification of disease status. To assess the potential impact of unmeasured confounders, including behavioral factors such as dietary habits, physical activity, sleep quality, and treatment adherence, which were not systematically collected in either CHARLS or ELSA, E-value analyses were conducted. The E-values for the associations between AIP and CMM were 7.32 and 5.21 in the CHARLS and ELSA cohorts, respectively, and those for TYG and CMM were 3.56 and 4.36, respectively. These substantial E-values indicate that a confounder would need to be strongly associated with both the exposure and the outcome to fully explain the observed associations, supporting the robustness of the present findings. Second, the observational and cross-sectional design inherently limits the strength of causal inference, and all associations should be interpreted in a descriptive rather than causal manner. Third, the subgroup analyses in this study provided preliminary insights but were limited by statistical power. Although the data revealed such differences, the limited sample sizes within subgroups in the ELSA validation cohort (by smoking status or educational level) warrant cautious interpretation. These potential differences in specific populations should be further explored and validated in larger, well-powered prospective cohort studies in the future.
In conclusion, this study demonstrates the robust association with AIP and TyG for CMM risk among individuals with depression, as well as their threshold effects. Through cross-cultural cohort validation of the DMC framework, we provide a solid empirical foundation for early intervention, effectively bridging the gap in risk classification and enabling the design of individualized intervention strategies and more efficient healthcare resource management.

