Introduction
Long non-coding RNA (lncRNA) molecules are defined as non-protein-coding RNAs longer than 200 nucleotides [1, 2]. They play diverse regulatory roles depending on their cellular localization. In the nucleus, lncRNAs participate in chromatin remodeling and RNA processing, whereas in the cytoplasm, they are involved in maintaining mRNA stability, regulating translation, and modulating signaling cascades [1–6]. lncRNAs are recognized as key regulators of cellular states, and alterations in their expression and function have been linked to various pathologies, including cancer. Additionally, they hold potential as prognostic markers and indicators of sensitivity to chemo- and radiotherapy, and could be used as potential targets for treatment personalization using nano-delivery systems [1–9].
One of the analyzed lncRNA is the eosinophil granule ontogeny transcript (EGOT). The human EGOT gene is located on the antisense strand of the intron of the inositol 1,4,5-trisphosphate receptor type 1 (ITPR1) gene. It should be noted that the EGOT transcript has two known splicing variants with the same transcriptional start site, both polyadenylated. However, they have different lengths; the longer variant, known as EGO-A is unspliced, while the shorter version, EGO-B, is spliced. EGOT functions as a non-coding RNA in eosinophil cell development by regulation of specific eosinophil granule proteins [10]. Our previously published analysis of the EGOT based on the TCGA indicated that expression levels of this lncRNA were slightly downregulated. Moreover, EGOT expression varies according to age, N stage, grade and lymph node dissection. Moreover, its expression levels were helpful for the assessment of patients’ survival, and EGOT lncRNA seems to be a prognostic biomarker. It should be emphasized that EGOT was also associated with genes connected with cell division, proliferation, protein modification, drug response, and cell motility [6]. Numerous recent, mostly in vitro studies have been dedicated to understanding the role of EGOT in breast cancer [11–15], gastric cancer [16], renal cell carcinoma [17], glioma [18], rectal cancer [19], colon cancer [20], thyroid cancer [21], papillary thyroid carcinoma [22], laryngeal squamous cell carcinoma [23], cirrhotic hepatocellular carcinoma [24], and in non-cancerous cells such as renal tubular cells, where its regulates hypoxia-induced autophagy [25]; EGOT also has a role in the attenuation of hypoxia-induced injury of cardiomyocytes [26], immune processes in periodontal tissues [27], as well as in regulation of the process of heart failure [28]. Moreover, it was reported that EGOT was associated with viral infections, including those with oncogenic properties such as human papillomavirus (HPV) in head and neck squamous cell carcinoma (HNSCC) and hepatitis C virus (HCV) [29, 30] as well as in the case of infection by SARS-CoV-2 virus [31].
In this study, based on the TCGA project and the RNA expression database portals [32–35], we analyzed 27 types of cancers and verified available data about EGOT in the context of its biological role, association with viral-induced tumorigenesis and potential diagnostic utility.
Material and methods
Patients
We used the available patient datasets of the TCGA cancers and analyzed them using the cBioPortal, GEPIA2, the UALCAN, and the ENCORI databases [34]. The study included, in the case of breast invasive carcinoma (BRCA), 1,072 female and 12 male patients; for head and neck squamous cell carcinoma (HNSC), 141 female and 382 male patients; for kidney renal clear cell carcinoma (KIRC), 186 female and 326 male patients; and for liver hepatocellular carcinoma (LIHC), 121 female and 251 male patients, with the median ages of 58, 61, 60, and 61 years at the time of diagnosis, respectively. The analyzed groups consisted mostly of white race patients, with 69.3% for BRCA, 85.7% for HNSC, 86.3% for KIRC, and 49.2% for LIHC; of these, those identified as ethnically non-Hispanic or Latino constituted 80.9%, 88.0%, 66.8%, and 90.3% of the respective cancer groups. In terms of tumor subtype for BRCA, the following distribution was observed: luminal A with 46.0%, luminal B with 18.2%, basal with 15.8%, Her2 with 7.2%, normal with 3.3%, and 9.5% of patients were not analyzed; for HNSC: 79.3% were human papillomavirus (HPV) positive, 13.8% were HPV negative, and 6.9% had an undefined HPV status; for KIRC and LIHC, 68.8% and 93.5% were classified as kidney renal clear cell carcinoma and liver hepatocellular carcinoma, respectively. All data are presented in Figure 1. The number of patients included in the analyses is summarized in Tables I and II, along with the databases used.
Figure 1
Patient characteristics used in the study among breast invasive carcinoma (BRCA), head and neck squamous cell carcinoma (HNSC), kidney renal clear cell carcinoma (KIRC), and liver hepatocellular carcinoma (LIHC) type of cancers. Graphs taken from cBioPortal
NA – not analyzed.
Table I
Expression levels of EGOT in cancer and normal samples in different types of tumors
Table II
Association of EGOT expression level and patients’ survival; HR – hazard ratio; p < 0.05 considered significant
Next, we focused on the expression levels of EGOT in BRCA, HNSC, KIRC and in LIHC, utilizing the TCGA PanCancer Atlas data: mRNA expression z-scores threshold ± 2 relative to diploid samples (RNA Seq V2 RSEM), downloaded from cBioPortal. For the analysis of immune subtype, TCGA subtype, cellular features such as proliferation, wound healing ability, stromal fraction and intratumor heterogeneity, we applied supplementary materials published by Thorsson et al. [36].
Survival analyses
We used the overall survival (OS) and relapse-free survival (RFS) parameters as the main clinical feature for selection of only those types of cancers where EGOT could have potential diagnostic and biological effects. We applied the GEPIA2 (Gene Expression Profiling Interactive Analysis, version 2.0) portal and patients were divided into two groups with EGOT-low and EGOT-high expression levels based on the median expression measured within the whole specific type of cancer cohort. Next, log-rank (Mantel–Cox) tests with 95% confidence interval (CI) were applied. We took for further analysis only those of types of cancer where p < 0.05 was achieved.
Analysis of molecular pathways and biological processes
For the assessment of cellular phenotype, which is connected with the EGOT, we used data obtained from cBioPortal. Due to the need for a deeper analysis of all pathways, the cut-off values of R < –0.1 and R > 0.1 were selected for the Spearman correlation, which allows detection of even subtle trends in data and facilitates identification of pathways or cellular processes that are enhanced or weakened. Obtained gene lists were then analyzed using the REACTOME pathway browser with a p-value ≤ 0.05 as the cut-off value, similarly as described previously [37].
Genomic and cellular analyses
Based on the data presented by Thorsson et al. [36], patients were divided into EGOT-low (negative z-score) and EGOT-high (positive z-score) groups, and the associations of EGOT with cellular features including TCGA subtype, proliferation ratio, wound healing ability, stromal fraction, and intratumor heterogeneity were assessed.
Statistical analysis
Statistical analyses were performed using GraphPad Prism 8 (GraphPad, San Diego, CA, USA) and verified using Statistica 12.0 (StatSoft). In all analyses, the Shapiro-Wilk test was used to assess the normality of the data distribution. Next, depending on the distribution, the t-test or Mann-Whitney U test was used for comparison of two groups. For the analysis of three or more groups, one-way ANOVA with an appropriate post-test was performed. In all analyses, p < 0.05 was considered statistically significant [6, 37].
Results
EGOT is a potential prognostic marker for breast, head and neck, kidney, and liver carcinomas
The association between EGOT expression levels and patients’ survival was examined (Table II). Better overall survival for patients with high expression of EGOT was observed in the case of breast invasive carcinoma (131 vs. 115 days, HR = 0.63, p = 0.0042), head and neck squamous cell carcinoma (65 vs. 35 days, HR = 0.69, p = 0.0062), kidney renal clear cell carcinoma (118 vs. 74 days, HR = 0.63, p = 0.017), kidney renal papillary cell carcinoma (> 130 vs. 98 days, HR = 0.52, p = 0.037) and cutaneous melanoma (106 vs. 62 days, HR = 0.76, p = 0.039) compared to the group of patients with low expressions of this lncRNA. However, in the case of liver hepatocellular carcinoma (48 vs. 70 days, HR = 1.48, p = 0.027) and mesothelioma (14 vs. 22 days, HR = 1.61, p = 0.044), patients with lower expression of EGOT had longer survival than patients with higher expression (Figure 2, Table I).
Figure 2
Characteristics of EGOT across the different types of cancers analyzed during the TCGA project. Association of EGOT expression levels with patients’ overall survival (OS) taken from StarBase 3.0 database (A) OS and relapse-free survival (RFS) data obtained from the GEPIA2 database (B); log-rank test, with high and low expression groups divided based on the median; green (high EGOT expression) and red (low EGOT expression) solid lines indicate survival, while dashed lines represent 95% CI; HR – hazard ratio C – median expression of EGOT in tumor and normal samples, graph taken from GEPIA2 database; D – differences in expression level of EGOT between cancer and normal samples in different types of tumors; graphs from ENCORI database, modified; the graphs represent the median of the value presented as fragments per kilobase million + 0.01 (FPKM + 0.01)
BRCA – breast invasive carcinoma, HNSC – head and neck squamous cell carcinoma, KIRC – kidney renal clear cell carcinoma, LIHC – liver hepatocellular carcinoma; n – number of cases, ns – not significant, ****p < 0.0001, *p < 0.05 (considered significant).
Based on available databases, the ENCORI Pan-Cancer Analysis Platform, and the UALCAN database, we analyzed and compared expression data of EGOT lncRNA in 17 different cancers (Table I). In the case of eleven tumors, we observed significant changes (p > 0.05) between normal and cancer samples (Table I). For BRCA (1.45 vs. 1.41, p = 0.00042), HNSC (0.19 vs. 0.26, p = 0.00011), KIRC (2.66 vs. 4.43, p = 1.1e-5), prostate adenocarcinoma (PRAD) (0.24 vs. 0.49, p = 2.9e-9) and kidney chromophobe (KICH) (0.82 vs. 6.28, p = 7.8e-18), expression levels of EGOT were downregulated. For six types of cancer – CHOL (0.53 vs. 0.08, p = 0.0012), COAD (0.17 vs. 0.03, p = 2.5e-7), esophageal carcinoma (ESCA) (0.2 vs. 0.06, p = 0.0054), lung adenocarcinoma (LUAD) (0.59 vs. 0.09, p = 1.8e-7), stomach adenocarcinoma (STAD) (0.13 vs. 0.08, p = 0.031), and thyroid carcinoma (THCA) (0.49 vs. 0.19, p = 8.4e-7) – EGOT expression was upregulated in cancer samples compared to the normal tissue samples. All data are presented in Figure 2 and Table II. Moreover, we determined the median expression of EGOT in tumor and normal samples, based on the GEPIA2 database, for BRCA, HNSC, KIRC, and LIHC, and found that higher fold change (FC) in expression levels of EGOT is characteristic for LIHC (FC = 1.3333) and KIRC (FC = 1.0185), and lower for BRCA (FC = 0.6795) and HNSC (FC = 0.4706); Figure 2 C.
EGOT is associated with cellular pathways and processes important for cancer development and progression
Next, we analyzed the list of genes with Spearman’s correlation (R < –0.1 and R > 0.1) relative to EGOT taken from cBioPortal. Cellular pathways and processes were assessed based on the negatively and positively correlated genes with EGOT for four types of cancers. From the analysis of REACTOME results we identified processes common for BRCA, HNSC, KIRC, and LIHC, and changes specific for each type of cancer. In the case of genes positively correlated with EGOT, patients displayed changes in: GTPase cycle, tissue architecture (including changes in collagen), cellular interactions and structures, O-glycosylation and N-glycan synthesis, signaling pathways, and processes connected with genetic defects, as well as changes in mRNA regulation and RNA polymerase activity. The negatively correlated genes were associated with ubiquitination and protein degradation, metabolism (specifically ornithine decarboxylase (ODC) and amino acids), regulation of cell cycle, signal transduction, interaction with cytoskeleton, GTPase activity, RNA polymerase dynamics, cross-presentation of antigens, and DNA repair mechanisms. All results are presented in Figures 3 A, B.
Figure 3
Assessment of cellular pathways and processes based on genes negatively and positively correlated with EGOT for breast invasive carcinoma (BRCA), head and neck squamous cell carcinoma (HNSC), kidney renal clear cell carcinoma (KIRC) and liver hepatocellular carcinoma (LIHC). Genes showing Spearman’s correlation (R < –0.1 and R > 0.1) with EGOT taken from cBioPortal and analyzed using the REACTOME tool with p-value ≤ 0.05 as cut-off value
Expression level of EGOT depends on the type of cancer and its immune subtype and cellular features for specified cancers
Next, we determined the characteristics of EGOT levels in BRCA, HNSC, KIRC, and LIHC, depending on the immune subtypes based on the TCGA classification. We observed no differences in expression levels in the case of the head and neck and liver carcinomas (p > 0.05). Only in the case of BRCA were the most changes in the expression levels of EGOT observed between immune subtypes: C1 vs. C3 (–0.1051 vs. 0.6433; p < 0.0001), C2 vs. C3 (–0.3752 vs. 0.6433; p < 0.0001), and C3 vs. C4 (0.6433 vs. –0.1159; p < 0.0001). Moreover, in kidney renal clear cell carcinoma, expression levels of EGOT significantly differed between C1 vs. C3 (–1.762 vs. 0.2717; p < 0.01) and C2 vs. C3 (–0.5846 vs. 0.2717; p < 0.0059) immune subtypes; Figure 4 A.
Figure 4
Characteristics of EGOT in breast invasive carcinoma (BRCA), head and neck squamous cell carcinoma (HNSC), kidney renal clear cell carcinoma (KIRC) and liver hepatocellular carcinoma (LIHC), depending on (A) immune and (B) TCGA subtypes, (C) cellular features such as proliferation, wound healing ability, stromal fraction, and intratumor heterogeneity
ns – not significant, ****p < 0.0001, ***p < 0.001, **p < 0.01 and *p < 0.05 (considered significant).
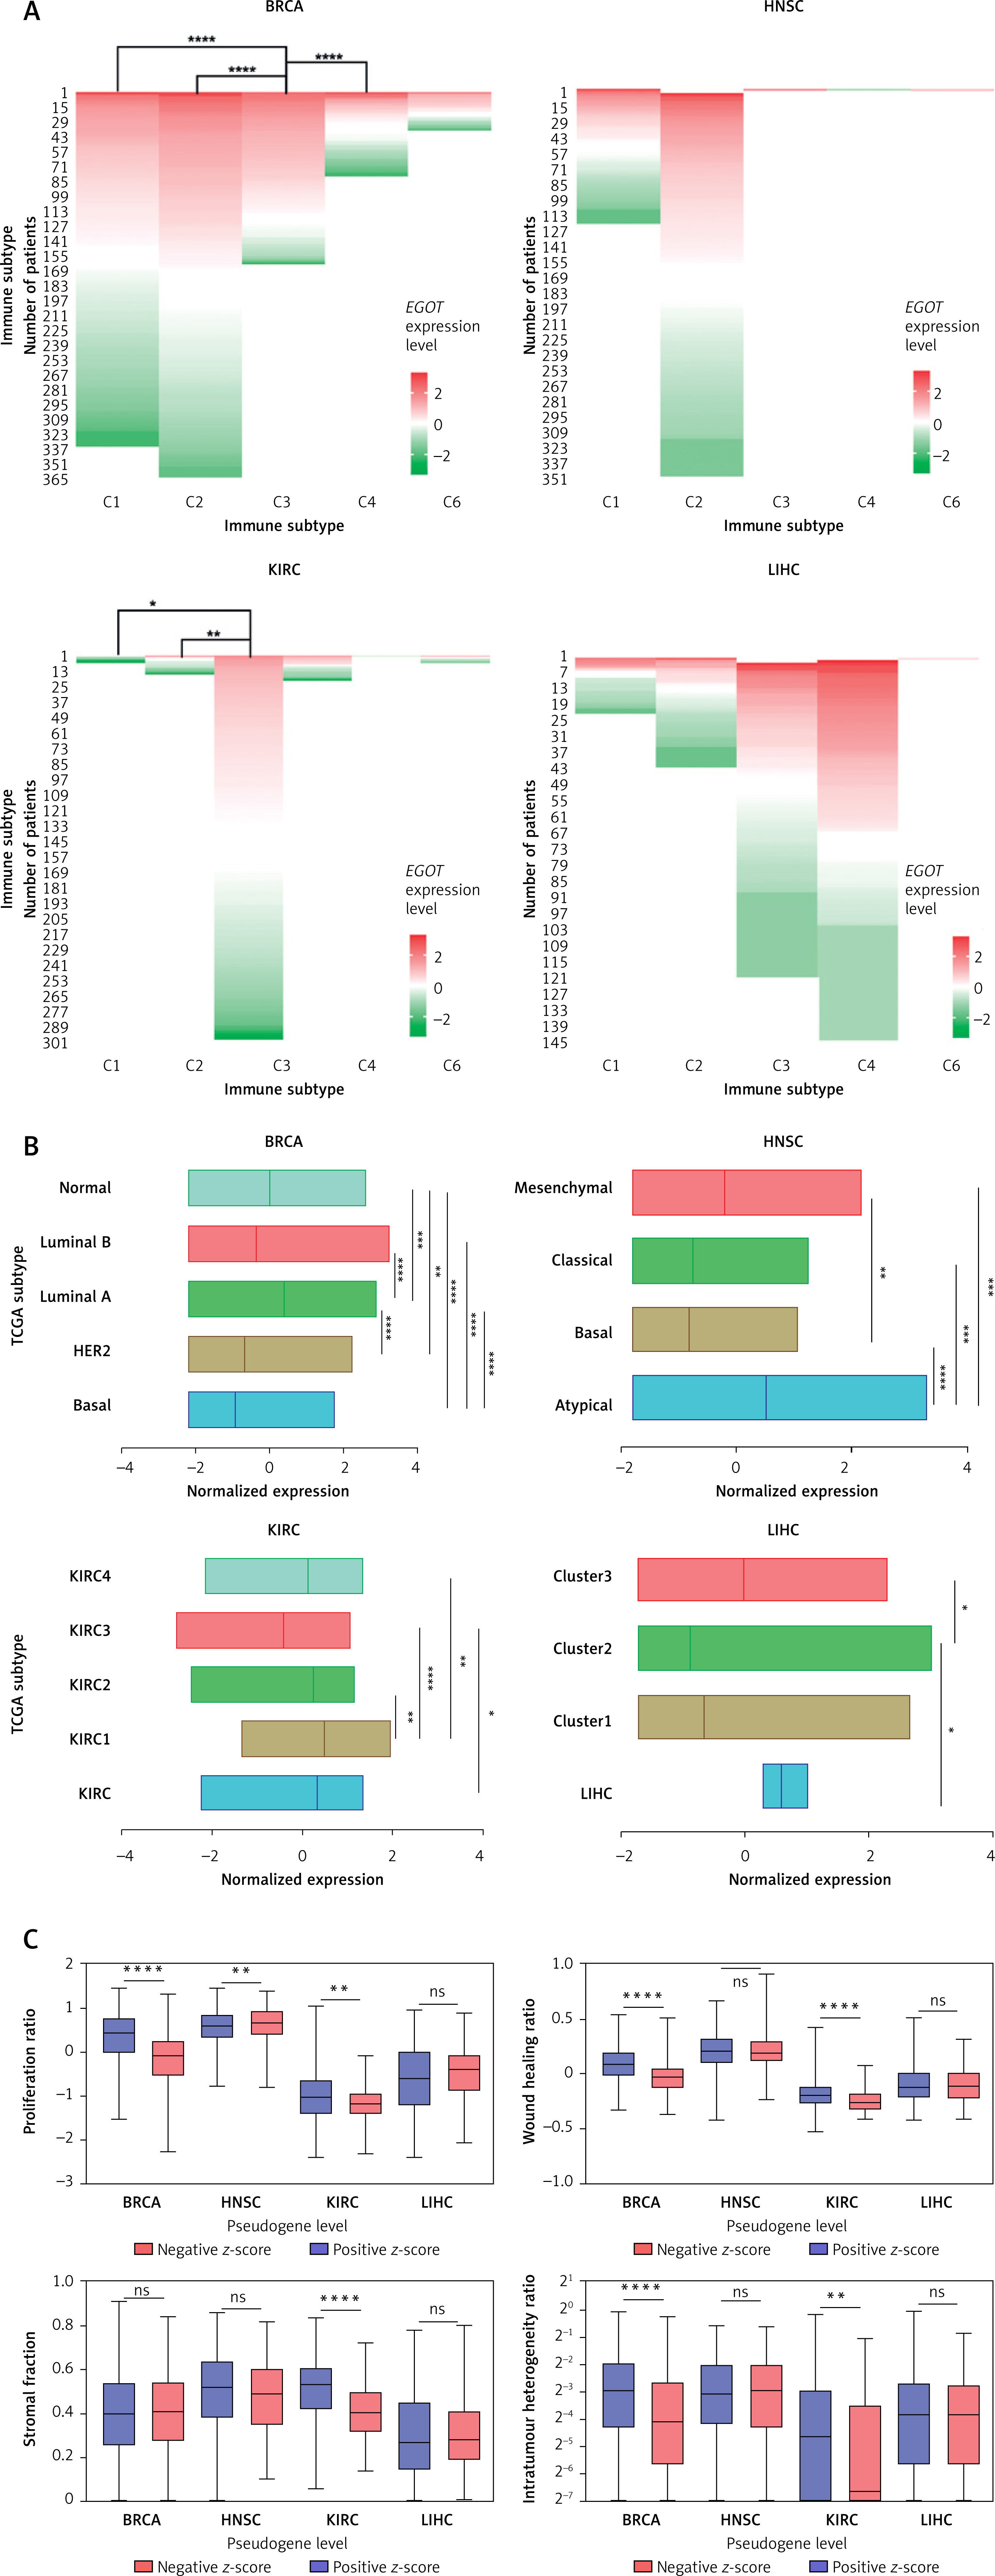
Next, we checked the expression level of EGOT lncRNA depending on the TCGA cancer subtypes. Differences were observed for all four types of analyzed cancers: in the case of BRCA, basal vs. luminal A, basal vs. luminal B, basal vs. normal, HER2 vs. luminal A, luminal A vs. luminal B (p < 0.0001), luminal A vs. normal (p = 0.0002) and HER2 vs. normal (p = 0.0021), with median expression levels –0.9107, 0.3955, –0.3494, 0.0261, and –0.6712, respectively. For HNSC we observed differences between the following subtypes: atypical vs. basal and atypical vs. classical (with median 0.5189, –0.7936, –0.7529; p < 0.0001), atypical vs. mesenchymal (0.5189 vs. –0.2342; p = 0.0006), and basal vs. mesenchymal (–0.7936 vs. –0.2342; p = 0.0084). Similarly, among the four TCGA subtypes, differences in EGOT expression were observed for KIRC, including KIRC vs. KIRC3 (p = 0.0334), KIRC1 vs. KIRC2 (p = 0.0033), KIRC1 vs. KIRC3 (p < 0.0001) and KIRC1 vs. KIRC4 (p = 0.0015), with median expression of 0.3339, –0.4254, 0.4887, 0.2342, and 0.127, respectively. In contrast, for LIHC, differences in the expression levels of EGOT were observed only for Cluster 2 vs. Cluster 3 (–0.8772 vs. –0.0198; p = 0.0199) and LIHC vs. Cluster 2 (0.5972 vs. –0.8772; p = 0.0151).
Moreover, cellular features such as proliferation, wound healing ability, stromal fraction and intratumor heterogeneity were examined. Lower EGOT expression levels were associated with higher proliferation (0.4452 vs. –0.1037; p < 0.0001, and –1.021 vs. –1.176; p = 0.0058) and greater wound healing ability (0.08050 vs. –0.03950; p < 0.0001, and –0.1970 vs. –0.2615; p < 0.0001) compared with groups of BRCA and KIRC patients with higher expression of this lncRNA. In the case of HNSC, higher EGOT expression was associated with higher proliferation (0.6896 vs. 0.6104; p = 0.0058), and no difference in wound healing ability was noted (p > 0.05). The third parameter, stromal cell fraction, was higher in the case of KIRC patients with lower expression levels of EGOT (0.5300 vs. 0.4100; p < 0.0001), and no significant differences were observed for the remaining types of analyzed cancers (p > 0.05). Moreover, we found that lower intratumor heterogeneity was associated with higher EGOT expression only in the case of BRCA and KIRC (0.06000 vs. 0.1300; p < 0.0001, and 0.01000 vs. 0.04000; p = 0.0012). Surprisingly, for LIHC no differences (p > 0.05) for all analyzed parameters were noted; Figure 4 C.
Discussion
In our opinion, despite the improvement of treatment protocols in oncology and progress in technology, e.g., in radiotherapy and cancer diagnostic methods, we have still not observed a spectacular breakthrough in personalized oncology [38–46]. However, the introduction of RNA-based biomarkers, especially those RNA molecules that take part in epigenetics mechanisms, could be a big step towards personalized oncology [1–5]. However, before it happens, many issues need to be solved, including creation and validation of the diagnostics panels of specific RNA molecules, which provide us with information about patients [7, 9, 33, 34].
Our study is the first comprehensive description of the biological and clinical role of EGOT. Numerous recent studies have been dedicated to understanding the role of EGOT in glioma, breast cancer, gastric cancer, head and neck cancer, and other malignancies [12–25] and in viral infections, including HCV [29, 30]. Moreover, our observation is supported by the results of Tomar S. (PhD dissertation, 2013) where, based on microarray analysis of 65 samples of oropharyngeal HPV-positive and HPV-negative cancer, variation of EGOT expression levels depending on HPV status and viral activity was observed [38]. In the case of HNSC, expression of EGOT is slightly downregulated in the whole group of patients (HPV-positive and HPV-negative), depending on tumor grade and location. EGOT is only upregulated in grade 4 tumors and those located in the pharynx (including the nasopharynx, oropharynx, and hypopharynx). EGOT expression levels were found to vary according to age, N stage, grade, lymph node dissection, and HPV infection. Patients with higher levels of EGOT expression have longer survival rates, including both disease-free survival and overall survival outcomes. Further analysis revealed that EGOT’s targets are associated with cell division, proliferation, protein modification, drug response, and cell motility [6]. However, further studies are needed to elucidate the function of EGOT in HNSC as well as other types of cancers.
Pathway analysis based on gene correlation with EGOT revealed that genes correlated with this lncRNA involve cell division, proliferation, protein modification, drug response, and cell motility. Based on our findings, we suggest that EGOT is involved in the progression of HNSCC and seems particularly associated with virus-related forms of HNSCC [6, 47]. However, validation of our results using different data and a larger group of patients is needed. Similarly, Xu et al. found that EGOT expression was lower in breast cancer cells compared to non-cancerous samples and varied according to the molecular subtypes of breast cancer. Furthermore, it was also found that tumor size, lymph node metastasis, and Ki-67 expression were positively correlated with low EGOT expression. This evidence shows that the downregulation of EGOT is involved in the progression of more invasive types of cancer [14]. In glioma, the expression of EGOT is significantly lower in the cancer than in the adjacent non-cancerous tissues [19]. An in vitro study revealed that overexpression of EGOT inhibits cell proliferation and migration and promotes cell apoptosis by increasing protein expression levels of caspase-3, caspase-9, and cytochrome c in U251 and U87 glioma cell lines [19]. Similarly, in renal cell carcinoma, the expression of EGOT is downregulated in tumor samples compared to paired, healthy tissues. An in vitro study found that upregulation of EGOT expression suppressed proliferation, migration, and invasion and induced apoptosis in 786-O and ACHN renal cell lines [18]. Taken together, these results suggest that EGOT serves as a suppressor gene. Surprisingly, our analysis of clinical pathology parameters in patients with HNSC identified low expression of EGOT in the group of patients with lower N stage, lower grade, and higher age of patients. It should be emphasized that some authors have suggested that EGOT may function as an oncogenic lncRNA. Based on a study performed using patients’ gastric carcinoma samples and a cell line model, Peng et al. found that EGOT was upregulated and high expression levels were correlated with more aggressive forms of cancers. Moreover, they reported that changes in EGOT levels influenced the Hedgehog pathway, but the mechanism of this phenomenon was not elucidated [17]. Furthermore, downregulated EGOT expression in vitro results in the inhibition of the Hedgehog signaling pathway, cell proliferation, and cycle progression arrest in the case of gastric cancer and breast cell lines [13, 17]. Based on the TCGA data of HNSC, it was observed that patients with high EGOT expression levels had better prognosis (longer DFS and OS) than those with low expression [6]. Similarly, in the case of breast cancer, patients with lower expression levels of EGOT displayed shortened OS time [14]. However, the opposite pattern was observed for gastric cancer, in which higher EGOT expression was associated with shorter survival times [17]. The genes that were upregulated in the high expression group are involved in the regulation of cellular processes, including differentiation, adhesion, developmental processes, cell communication, signal transduction, division and proliferation, protein phosphorylation and other modifications, cellular component organization, cellular homeostasis, drug response and cell motility. In the group of downregulated genes, processes connected with cell cytoskeleton and filaments, localization/binding, cellular transport, and protein activity were observed.
The changes in these processes indirectly or directly influence the treatment response and survival of patients with HNSC. It must also be noted that the location of HNSC is a crucial clinical factor in terms of treatment strategy and survival prediction. The observed upregulation of EGOT expression in the pharyngeal cancers is probably due to HPV infection, which is characteristic of the oropharynx, such as the tonsils and base of the tongue, but is sometimes also associated with other locations [6]. Indeed, our observations confirmed that EGOT expression is mainly upregulated in HPV p16-positive HNSC. It has been reported that the expression of some other lncRNAs is associated with viral infections [29–31]. Another study showed that EGOT expression is upregulated in HPV-positive HNSC [39]. However, the authors did not propose a mechanism of EGOT function in HPV infection, so the role of this lncRNA in viral infection remains unclear [39]. Based on patient samples and cell lines, Carnero et al. demonstrated that the lncRNA EGOT is involved in, and required for, hepatitis C virus replication. They also observed that cells with lower EGOT levels have lower content of viral genomes [30]. They proposed that the viral replication process in the host cell cytoplasm causes upregulation of EGOT, which is required to overcome the cellular mechanism of the antiviral response [30]. It was observed that EGOT is upregulated after exposure to dsRNA or synthetic analogs and viral RNA as well as after exposure of tumor necrosis factor α (TNF-α). In the proposed mechanism, expression of EGOT is stimulated by NF-kB (nuclear factor-κB), in the response to TNF-α, which binds to the promoter of the gene coding lncRNA EGOT [30]. These results suggested that EGOT is involved in the progression of HNSC [6]. Furthermore, it seems likely that the role of EGOT is connected to HPV infection, given the association between high EGOT expression levels and pharyngeal tumors, younger patients, better DFS and OS, and p16 expression, as these are all characteristic of HPV-positive HNSC cases [6]. We suggest that EGOT could potentially serve as a new biomarker of HPV infection and probably has an important role in viral response and biology of HPV-positive oropharynx cancers. It is known that EGOT plays some regulatory functions as a “molecular sponge”, and by binding miRNAs, it causes a change in their levels in the cell, which ultimately affects the expression level of other transcripts, including mRNA [20–22].
However, this relationship has not been established for all cancer types included in this study, and a gap remains in the mechanism between EGOT and observed biological and clinical features associated with this lncRNA.
We believe that defining the role of EGOT will allow us to better understand and characterize BRCA, HNSC, KIRC, and LIHC, and to determine whether EGOT lncRNA will be able to become a biomarker of detection, treatment response, or disease stage in the future. However, the precise role of EGOT in the case of BRCA, HNSC, KIRC, and LIHC remains unclear so far. Possible factors connecting HNSC and LIHC cancers and changes in EGOT expression are viral activity and immunological responses to viral infection. The role of HPV, mostly HPV-16, and HPV-18 in HNSC, and the hepatitis B virus (HBV), hepatitis C virus (HCV), and hepatitis D virus (HDV) in the case of LIHC development is well known [48, 49]. Recent studies about KIRC postulated the possible role of endogenous retrovirus (ERV) reactivation in renal cell carcinoma oncogenesis, which is connected with hypotheses about its immunogenicity and, interestingly, with the response to the treatment based on inhibitors of immune checkpoints [50]. In the case of BRCA, the role of some viruses in BRCA-oncogenesis remains inconclusive and enigmatic. However, Epstein-Barr virus (EBV) and bovine leukemia virus (BLV) have been suggested to potentially cause this type of cancer, although the authors underlined that it is not so common, and viral infection could be one of the factors in the oncogenesis process [51]. We observed that the results of the association of EGOT with BRCA are also connected with virus-mediated changes in the cell genome or epigenome as well as changes in the tumor microenvironment, including the immune response. However, strong evidence is needed to support this statement.
Our study is the first comprehensive description of lncRNA EGOT across 17 different cancer types included in the TCGA project. Based on our results, we conclude that:
Expression levels of lncRNA EGOT are higher in non-cancerous samples in the case of HNSC and lower in the case of KIRC and LIHC in comparison to cancer samples;
Higher expression levels of EGOT are associated with better overall survival for patients with lower levels of this lncRNA for BRCA, HNSC, and KIRC cancers compared to those with lower levels of this lncRNA;
For all analyzed cancer types, patients exhibited changes in genes positively correlated with lncRNA EGOT which were associated with GTPases in signaling pathways, alterations in extracellular collagen, changes in glycolytic pathways, and some genetic defects important for cancerogenesis. In contrast, genes negatively correlated with lncRNA EGOT were linked to changes in cell cycle regulation, protein homeostasis, metabolic processes, and DNA repair mechanisms.
However, we acknowledge some limitations of our study, despite using various analytical platforms with the TCGA data concerning the lncRNA EGOT. It should be noted that some of the presented results were calculated by us. Nevertheless, all results are based on the same project and data, which has positive and negative consequences. The advantage is that generated data were obtained under the same conditions and quality control. Moreover, the TCGA database is the biggest collection of cancer samples available. Unfortunately, a limitation of our study is the lack of other datasets similar to the TCGA for validation purposes.
In conclusion, our results provide an excellent starting point for further studies by other teams that can validate these findings based on their own data or in vitro cell models.