Current issue
Archive
Manuscripts accepted
About the Journal
Editorial office
Editorial board
Section Editors
Abstracting and indexing
Subscription
Contact
Ethical standards and procedures
Most read articles
Instructions for authors
Article Processing Charge (APC)
Regulations of paying article processing charge (APC)
GASTROENTEROLOGY / RESEARCH PAPER
Association of insulin resistance with chronic diarrhea: based on the NHANES database 2005-2010
1
Department of Endocrine, Jinhua Hospital of Traditional Chinese Medicine, China
2
Department of Spleen and Stomach Diseases, Jinhua Hospital of Traditional Chinese Medicine, China
These authors had equal contribution to this work
Submission date: 2025-12-02
Final revision date: 2026-02-04
Acceptance date: 2026-02-17
Online publication date: 2026-06-04
Corresponding author
Xue Huang
Department of Spleen and Stomach Diseases, Jinhua Hospital of Traditional Chinese Medicine, China
Department of Spleen and Stomach Diseases, Jinhua Hospital of Traditional Chinese Medicine, China
KEYWORDS
TOPICS
ABSTRACT
Introduction:
The evidence regarding the association of insulin resistance (IR) with chronic diarrhea (CD) remains scarce, especially without robust epidemiological support from large-scale population cohorts. Therefore, we aimed to explore the association of IR with CD by a cross-sectional study of data drawn from the National Health and Nutrition Examination Survey(NHANES) from 2005 to 2010.
Material and methods:
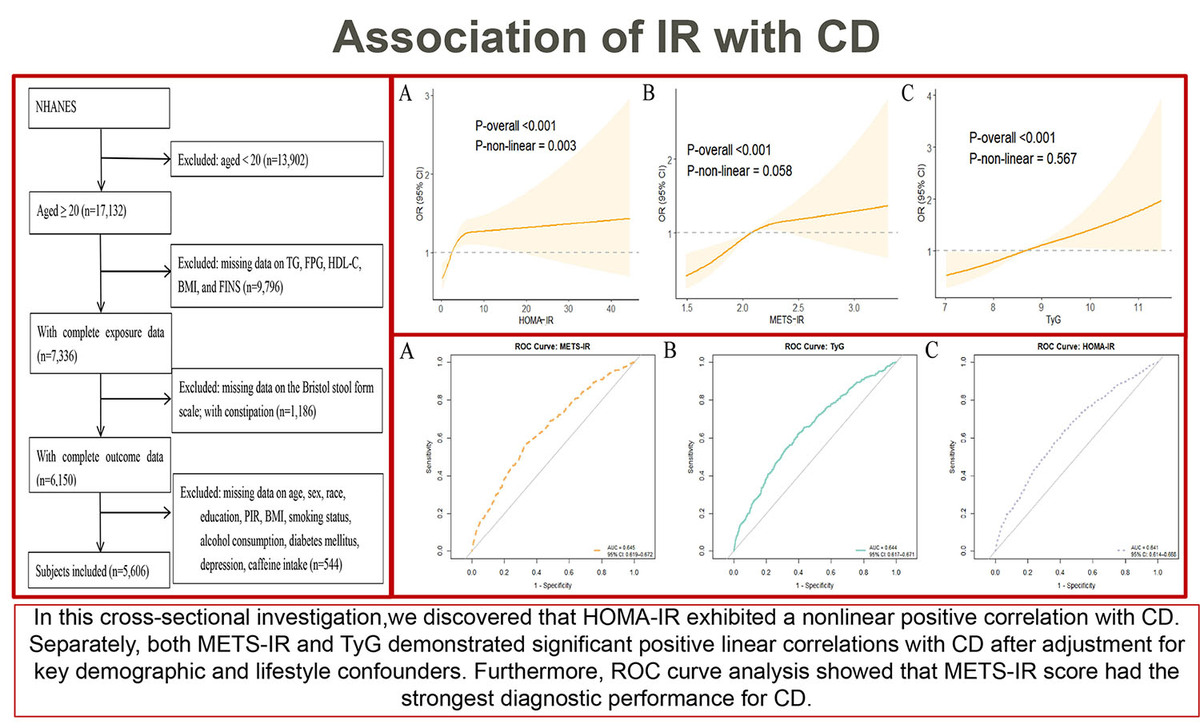
Multiple logistic regression models combined with subgroup analyses were leveraged to explore the association of IR(triglyceride-glucose[TyG] index, metabolic score for IR [METS-IR] score, and Homeostasis Model Assessment of IR [HOMA-IR] score) with the prevalence of CD. Nonlinear correlations were measured by restricted cubic spline(RCS) curves. Finally, the diagnostic efficacy of these indicators was calculated and examined with the receiver operating characteristic(ROC) curve and area under the curve(AUC).
Results:
After full adjustment for covariates(e.g., sex, age, race, education, poverty-to-income ratio (PIR), body mass index (BMI), smoking status), the TyG index(OR: 1.35, 95% CI: 1.12-1.63), METS-IR score(OR: 2.00, 95% CI: 1.31-3.06), and HOMA-IR score (OR: 1.02, 95% CI: 1.00-1.03) showed positive associations with the prevalence of CD. The RCS curve analysis showed a non-linear association between HOMA-IR and CD (P-non-linear=0.003), with an inflection point at 2.423. METS-IR and TyG showed a significant positive linear association with CD(both P-non-linear > 0.05). The ROC curve analysis identified METS-IR score as the optimal diagnostic indicator for CD (AUC=0.645, 95% CI: 0.619-0.672).
Conclusions:
The present research discovered a significant positive association of IR with CD among a demographically representative cohort of US adults. Elevated IR scores are significantly associated with the prevalence of CD.
The evidence regarding the association of insulin resistance (IR) with chronic diarrhea (CD) remains scarce, especially without robust epidemiological support from large-scale population cohorts. Therefore, we aimed to explore the association of IR with CD by a cross-sectional study of data drawn from the National Health and Nutrition Examination Survey(NHANES) from 2005 to 2010.
Material and methods:
Multiple logistic regression models combined with subgroup analyses were leveraged to explore the association of IR(triglyceride-glucose[TyG] index, metabolic score for IR [METS-IR] score, and Homeostasis Model Assessment of IR [HOMA-IR] score) with the prevalence of CD. Nonlinear correlations were measured by restricted cubic spline(RCS) curves. Finally, the diagnostic efficacy of these indicators was calculated and examined with the receiver operating characteristic(ROC) curve and area under the curve(AUC).
Results:
After full adjustment for covariates(e.g., sex, age, race, education, poverty-to-income ratio (PIR), body mass index (BMI), smoking status), the TyG index(OR: 1.35, 95% CI: 1.12-1.63), METS-IR score(OR: 2.00, 95% CI: 1.31-3.06), and HOMA-IR score (OR: 1.02, 95% CI: 1.00-1.03) showed positive associations with the prevalence of CD. The RCS curve analysis showed a non-linear association between HOMA-IR and CD (P-non-linear=0.003), with an inflection point at 2.423. METS-IR and TyG showed a significant positive linear association with CD(both P-non-linear > 0.05). The ROC curve analysis identified METS-IR score as the optimal diagnostic indicator for CD (AUC=0.645, 95% CI: 0.619-0.672).
Conclusions:
The present research discovered a significant positive association of IR with CD among a demographically representative cohort of US adults. Elevated IR scores are significantly associated with the prevalence of CD.
Share
RELATED ARTICLE
| eISSN: | 1896-9151 |
| ISSN: | 1734-1922 |
We process personal data collected when visiting the website. The function of obtaining information about users and their behavior is carried out by voluntarily entered information in forms and saving cookies in end devices. Data, including cookies, are used to provide services, improve the user experience and to analyze the traffic in accordance with the Privacy policy. Data are also collected and processed by Google Analytics tool (more).
You can change cookies settings in your browser. Restricted use of cookies in the browser configuration may affect some functionalities of the website.
You can change cookies settings in your browser. Restricted use of cookies in the browser configuration may affect some functionalities of the website.