Introduction
The buildup of fatty and fibrous components in the artery wall is a hallmark of atherosclerosis, a chronic inflammatory disease resulting in plaque formation and subsequent narrowing of the arteries [1]. As the disease progresses, atherosclerosis may lead to serious cardiovascular events such as peripheral artery disease, stroke, and coronary heart disease [2]. Research has indicated that the incidence and progression of atherosclerosis are closely related to multiple risk factors, including blood pressure, smoking, diabetes, obesity, lack of exercise, and hyperlipidemia [2]. Among them, hyperlipidemia, especially hypercholesterolemia, is one of the main risk factors for atherosclerosis. In the state of hyperlipidemia, the lipid level in the blood is significantly elevated [3]. Long-term hypercholesterolemia not only accelerates the process of arteriosclerosis, but also increases the risk of thrombosis, thereby significantly increasing the incidence of cardiovascular events [4]. Therefore, controlling blood lipid levels, especially lowering cholesterol, is one of the key measures to prevent and treat atherosclerosis and its related cardiovascular diseases.
In the metabolism of cellular energy, mitochondria are essential, and hyperlipidemia can lead to lipid accumulation and affect mitochondrial function [5]. Fat accumulation caused by hyperlipidemia increases oxidative stress, damages mitochondria, and leads to impaired function, thereby promoting the occurrence of atherosclerosis and cardiovascular disease [6]. COX7C is one of the subunits of cytochrome C oxidase (COX) and belongs to complex IV of the mitochondrial electron transport chain (ETC) [7]. Reduced ATP synthase efficiency, impaired proton pump function and inhibited electron transport result from a mutation or absence of COX7C [8]. Studies have found that COX7C is related to a variety of cardiovascular and cerebrovascular diseases. Jia et al. demonstrated that dl-3-n-butylphthalide (NBP) protects against cerebral ischemia/reperfusion injury by upregulating COX7C, which inhibits mitochondrial apoptosis, reduces reactive oxygen species (ROS) release, improves adenosine triphosphate (ATP) production, and enhances mitochondrial function, thus contributing to neuroprotection [9]. Similarly, Wu et al. discovered that COX7C expression is strongly associated with venous thromboembolism (VTE) in colon cancer patients, with its upregulation strongly correlated with VTE [10]. These results emphasize the significance of COX7C in mitochondrial function and its potential usefulness as a therapeutic target for cardiovascular and cerebrovascular diseases.
One important modulator of the cellular reaction to low oxygen levels (hypoxia) is hypoxia-inducible factor 1-One important modulator of the cellular reaction to low oxygen levels (hypoxia) is hypoxia-inducible (HIF-1α) [11]. It can help protect mitochondria by shifting cellular metabolism from oxidative phosphorylation to glycolysis, thereby reducing mitochondrial oxidative stress and damage under hypoxic conditions [12]. However, chronic or excessive engagement of HIF-1α can result in imbalanced mitochondrial function and increased production of ROS, leading to mitochondrial damage [13]. Thus, HIF-1α is essential for regulating mitochondrial function and maintaining cellular homeostasis under stress conditions. Zhao et al. found that ischemic postconditioning (Postcon) reduced ischemia/reperfusion (I/R)-induced cardiac injury in both normolipidemic and hyperlipidemic rats, with HIF-1α upregulation playing a key role in Postcon-mediated cardioprotection [14]. Similarly, Wang et al. reported that disrupting adipocyte HIF-1α alleviated atherosclerosis in high-cholesterol diet-fed ApoE -/- mice by inhibiting ceramide generation, reducing cholesterol, inflammation, and atherogenesis [15]. This indicates that HIF-1α is a key target for improving cardiovascular disease and has research significance.
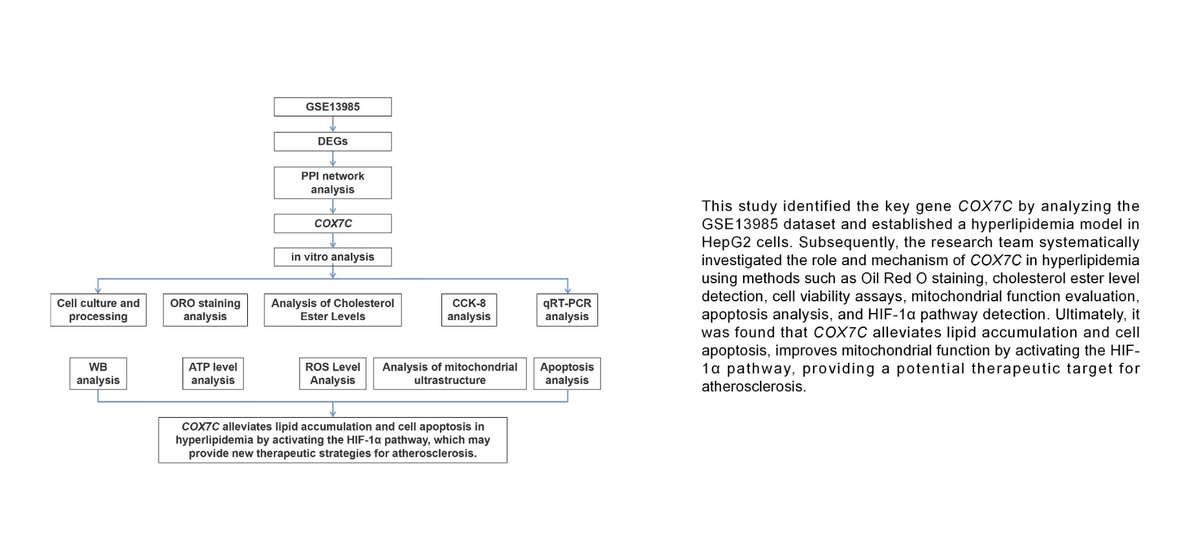
The objective of this study was to investigate the role of COX7C in hyperlipidemia-induced mitochondrial dysfunction and its potential therapeutic effect in the context of atherosclerosis. By analyzing differentially expressed genes (DEGs) from the GSE13985 dataset, we identified several key genes, including COX7C. The FFA-induced lipid loading model in HepG2 cells was established to investigate the result of COX7C overexpression on lipid accumulation, mitochondrial function, and apoptosis. Additionally, the HIF-1α pathway’s participation was investigated to determine its possible regulatory function in COX7C-mediated cellular responses. The results of this investigation may provide significant insight into the molecular processes behind hyperlipidemia and facilitate the development of therapeutic strategies targeting lipid metabolism and mitochondrial function.
Material and methods
Downloading and processing of the GSE13985 dataset
The R program was used to preprocess the microarray data set from GSE13985 retrieved from Gene Expression Omnibus (GEO, https://www.ncbi.nlm.nih.gov/gds/). It includes familial hypercholesterolemia samples (n = 5) and their corresponding controls (n = 5). The R programming language’s limma package was employed to convert the probe IDs to the gene symbols and carry out the differential analysis. Up-regulated DEGs were defined as those with a fold change (FC) threshold > 1.3, down-regulated DEGs as those with an FC < 0.77, and a p-value criterion < 0.05.
Analysis of DEGs’ protein-protein interaction (PPI) networks and discovery of key overlapping genes
The STRING tool (https://string-db.org/) was applied to conduct the PPI network analysis of the screened DEGs. The resulting PPI network was analyzed based on three topological measures: maximal neighborhood component (MNC), degree, and closeness. For network visualization, the open-source platform Cytoscape (Version 3.7.1) was employed. Subsequently, Venn diagram analysis was conducted using the bioinformatics tool available at https://bioinformatics.psb.ugent.be/webtools/Venn/ to determine which genes overlap across the three network modules. The R program was used for data processing and boxplot visualization in order to evaluate the expression levels of these important overlapping genes. The way these genes are expressed was contrasted between the case and control groups to determine their potential biological relevance.
Cell lines and culture
Human hepatocellular carcinoma cells (HepG2) and human normal liver cells (L02) were acquired at the Center for Type Culture Collection (Shanghai, China). Dulbecco’s Modified Eagle Medium (DMEM) was employed to culture the cells, supplemented with 10% fetal bovine serum (FBS) and 1% penicillin-streptomycin. Cell cultures were maintained at 37°C in a humidified atmosphere with 5% CO2.
Cell treatment and establishment of hyperlipidemia model
Oleic acid and palmitic acid were mixed in a ratio of 2:1 to form free fatty acid (FFA) [16]. HepG2 cells were induced with 0.2, 0.4, 0.6, 0.8, 1.0, 1.2, and 1.4 mmol/l FFA for 24 h. L02 cells without FFA induction were employed as the control group. After the experiment, HepG2 cells induced with 1.0 mmol/l FFA were selected as the hyperlipidemia model group. In addition, the HIF-1α inhibitor KC7F2 was used to induce the model during 24 h at a 20 μmol/l concentration. For the solvent control, dimethyl sulfoxide (DMSO) was applied to dissolve KC7F2, and the final DMSO content in the culture medium was 0.1%.
Cell transfection
Twenty-four-well plates were filled with HepG2 cells treated with FFA at a density of 2 × 10⁵ cells per well. The plasmid encoding COX7C (over-COX7C) or negative control (over-NC) was transfected into cells using a suitable transfection technique, enabling the cells to express the respective proteins for a certain amount of time, thereby achieving overexpression. As instructed by the manufacturer, Lipofectamine 3000 (Thermo Fisher Scientific, China) was employed to transfect cells.
Oil Red O (ORO) staining
To evaluate the buildup of lipids, HepG2 cells induced by varying concentrations of FFA were fixed with 4% paraformaldehyde (PFA) and subsequently cleaned three times with phosphate-buffered saline (PBS, Solarbio, Beijing, China). After that, the cells were stained with ORO for 0.5 h at room temperature. After staining, they were washed with 60% isopropanol to remove excess dye. ORO staining images were acquired using an optical microscope to observe lipid droplets.
Analysis of cholesterol ester levels
Blood lipid levels were measured via a free cholesterol assay kit (Applygen, Beijing, China) and a total cholesterol assay kit (Applygen, Beijing, China). The concentrations of free and total cholesterol were measured according to the manufacturer’s recommendations. The free cholesterol level was subtracted from the total cholesterol level to determine the cholesterol ester content. This approach allows for the precise quantification of cholesterol ester levels in the samples.
Reactive oxygen species (ROS) detection
ROS generation was assessed using an ROS detection kit (KeyGEN BioTECH, Jiangsu, China), observing the manufacturer’s instructions. Mod cells under different treatment conditions were seeded into 6-well plates. Afterward, 10 µM of 2,7-dichlorodihydrofluorescein diacetate (DCFH-DA) was added to each well, and the cells were treated for 30 min at 37°C in the dark. Fluorescence intensity was measured after incubation using a flow cytometer (Jiyuan, Guangzhou, China) to evaluate ROS production.
Adenosine triphosphate (ATP) detection
ATP production in Mod cells was measured by a Luminometric ATP Assay Kit (Beyotime, Shanghai, China). After growing cells in the appropriate medium for 30 h, they were lysed by a cell lysis buffer, and the resulting cell lysates were subjected to ATP quantification. Equal volumes of lysates from both control and transfected cells were combined with the ATP reaction mixture and kept in the dark at room temperature for 15 min. A Fluostar Omega plate reader (BMG LabTech, Germany) was then employed to measure luminosity in order to determine the amounts of ATP. ATP concentrations were determined by generating a standard curve following the manufacturer’s guidelines.
Cell Counting Kit-8 (CCK-8) assay
The CCK-8 assay was employed to assess cell viability. Cells were grown at a density of 5 × 10³ cells per well in 96-well plates. Following treatment, a CCK-8 reagent (KeyGEN BioTECH, Jiangsu, China) was added to each well. Absorbance at 450 nm was measured at 0, 24, 48, and 72 h using a microplate reader (Kehua Technologies, Inc., Shanghai, China).
Transmission electron microscopy (TEM)
TEM was used to assess mitochondrial ultrastructure under different experimental conditions. Prior to being treated in accordance with their respective experimental groups, cells were initially seeded onto 6-well plates. Following treatment, cells underwent two PBS washes, harvested by gentle scraping, then preserved for 12 h at 4°C via 2.5% glutaraldehyde in 0.1 M phosphate buffer (pH 7.4). Following primary fixation, cells were post-fixed in 1% osmium tetroxide (OsO4) for 2 h at 4°C after being cleaned three times with PBS. Following fixation, the samples underwent three 15-minute washes with 0.1 M PB. The samples were then dehydrated at room temperature and infiltrated with resin for embedding. An ultramicrotome was applied to cut resin blocks into 60–80 nm sections, which were mounted on 150 copper grids. After staining, the sections were examined under a transmission electron microscope (JSM-IT300LV, JEOL, Beijing, China) to evaluate and image mitochondrial morphology, including cristae integrity, swelling, and membrane structure.
Flow cytometry
Trypsin-EDTA (Life Technologies Inc., Beijing, China) was employed to separate the cells, and PBS was used to wash them before flow cytometry analysis. According to the manufacturer’s instructions, propidium iodide (PI, Solarbio, Beijing, China) and Annexin V staining was used to distinguish between live, apoptotic, and necrotic cells. The data were analyzed and the cell apoptosis rate was computed by FlowJo software (FlowJo, Hangzhou, China) and a flow cytometer (Jiyuan, Guangzhou, China).
Quantitative real-time polymerase chain reaction (qRT-PCR)
The experiment was conducted according to the conventional qRT-PCR experimental protocols [17]. The 2–ΔΔCT technique was applied to measure gene expression, and GAPDH was employed as the internal control. The primer sequences listed below were employed in the amplification process: COX7C forward: 5ʹ-TATGTTGGGCCAGAGCATCC-3ʹ, COX7C reverse: 5ʹ-GGAAGGGTGTAGCAAATGCAG-3ʹ. HIF-1α forward: 5ʹ-AGGTTGAGGGACGGAGATTT-3ʹ, HIF-1α reverse: 5ʹ-TGGCTGCATCTCGAGACTTT-3ʹ. Likewise, the following were the forward and reverse primers for GAPDH, which was utilized as the reference gene: GAPDH forward: 5ʹ-AATGGGCAGCCGTTAGGAAA-3ʹ, GAPDH reverse: 5ʹ-GCGCCCAATACGACCAAATC-3ʹ.
Western blot (WB) assay
Protease and phosphatase inhibitors (CoWin Biosciences, Nanjing, China) were combined with RIPA lysis buffer (Solarbio, Beijing, China) to create cell protein lysates. The BCA Protein Assay Kit (Beyotime, Shanghai, China) served to measure the protein concentration. Equal quantities of protein were transferred onto PVDF membranes (Beyotime, Shanghai, China) after being exposed to 10% SDS-PAGE. 5% skim milk was used to obstruct the membranes, and incubated sequentially with primary antibodies, including COX7C (11411-2-AP, 1 : 500, Wuhan Sanying, China), Bcl-2 (ab182858, 1 : 2000, Abcam, China), Bax (ab32503, 1 : 1000, Abcam, China), and HIF-1α (ab51608, 1 : 1000, Abcam, China). HRP-conjugated anti-rabbit IgG (ab6759, 1 : 5000, Abcam, China) was then added to the membranes for incubation. GAPDH (ab181602, 1 : 10000, Abcam, China) was used as the internal control. Bands of proteins were visualized using an enhanced chemiluminescence (ECL) kit (Tiangen, Beijing, China) and detected using the ChemiDoc imaging system (Bio-Rad, Shanghai, China). Image J (version 1.8.0) was applied to examine band intensities.
Immunofluorescence staining
Immunofluorescence staining was performed to assess the expression and mitochondrial localization of COX7C under different experimental conditions. In 6-well plates, cells were seeded onto glass coverslips and cultivated until they achieved confluence of 70–80%. After experimental treatment, cells were washed three times in PBS and fixed for 15 min at room temperature with 4% paraformaldehyde (PFA). Following fixation, cells underwent another PBS wash before being permeabilized for 10 min by 0.2% Triton X-100. To avoid nonspecific binding, cells were exposed to 5% bovine serum albumin (BSA) for 30 min at room temperature. At 4°C, primary antibodies were incubated overnight using anti-COX7C (Proteintech, 1 : 100 dilution) diluted in PBS containing 1% BSA. Cells were cleaned and then treated with Alexa Fluor 488-conjugated secondary antibodies (1 : 500, Invitrogen) for 1 h at room temperature in the dark. For mitochondrial staining, cells were incubated with MitoTracker Red CMXRos (Cell Signaling) at 37°C for 30 min and then fixed. Nuclei were counterstained with DAPI for 5 min at room temperature. After the final wash, Thermo Fisher’s antifade mounting material was used to adhere coverslips to slides. A confocal laser scanning microscope (Leica SP8, Germany) was employed for image acquisition, and the expression of COX7C and its colocalization with mitochondria were examined with Image J (version 1.8.0).
Statistical analysis
The R software was employed to conduct the statistical analysis. Each experiment was carried out in triplicate, and mean ± SD was employed to describe the results. Prior to conducting a one-way ANOVA, the normality of the data was assessed using the Shapiro-Wilk test, and all datasets used for ANOVA analysis were confirmed to be normally distributed (p > 0.05). One-way ANOVA was conducted to determine the significance of differences, and Tukey’s test was used for post hoc analysis. The criterion for statistical significance was p < 0.05.
Results
Screening of DEGs and identification of key overlapping genes
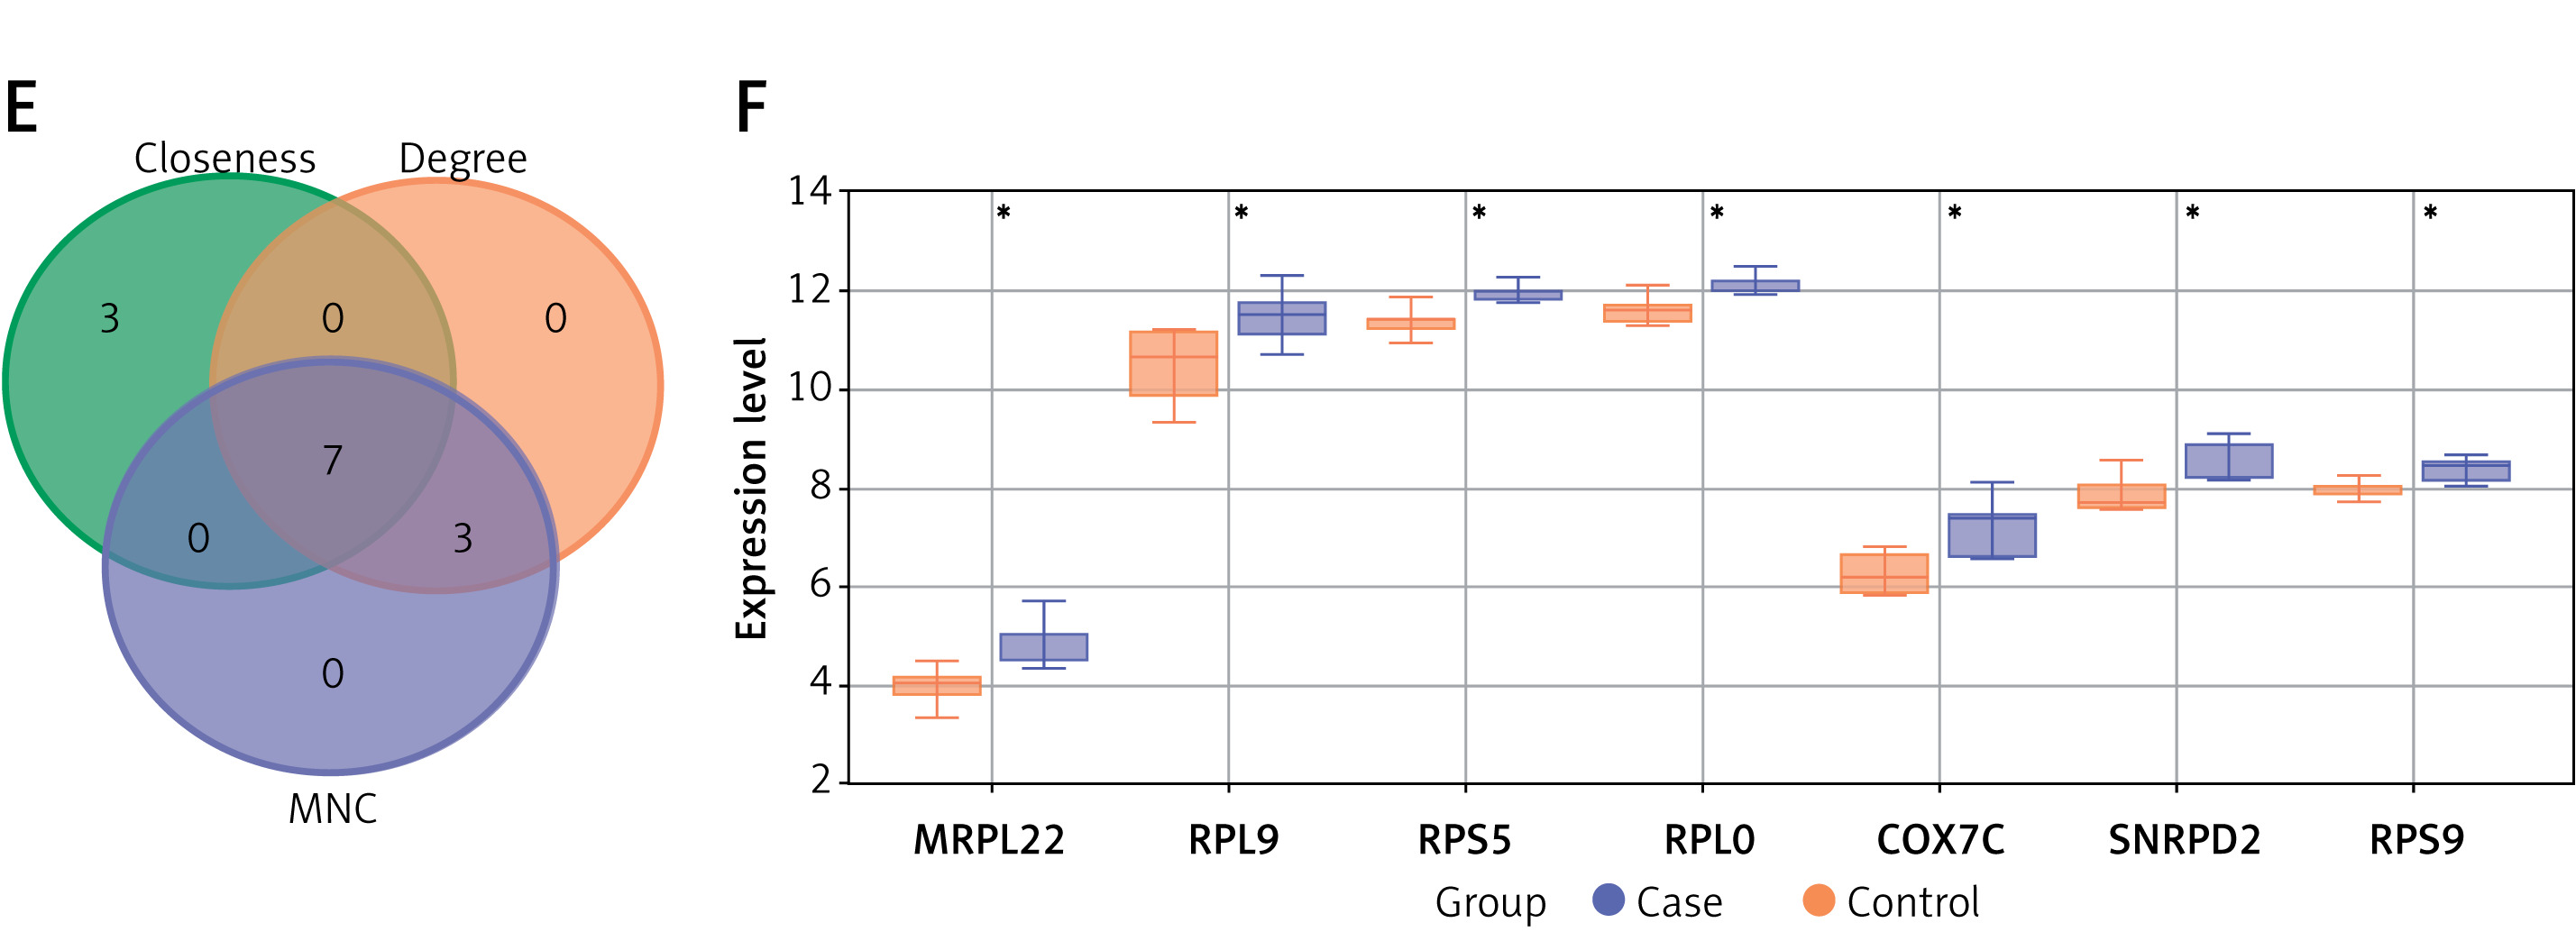
DEGs were identified from the GSE13985 dataset, which included samples from familial hypercholesterolemia (FH) and control groups. In all, 358 downregulated and 88 upregulated DEGs were detected, as shown in Figure 1 A. PPI network analysis was subsequently performed on these DEGs using three different topological measures: MNC, degree, and closeness. The top 10 genes for each measure are presented in Figures 1 B–D. Specifically, the MNC network comprised 10 nodes and 40 edges, the degree network contained 10 nodes and 40 edges, and the closeness network included 10 nodes and 29 edges. From these networks, seven overlapping genes were identified through bioinformatics analysis: MRPL22, RPL9, RPS5, RPLP0, COX7C, SNRPD2, and RPS9 (Figure 1 E). Expression analysis revealed that these genes were notably downregulated in the FH case group compared with the control group within the GSE13985 dataset (Figure 1 F).
Figure 1
Identification of DEGs and key overlapping genes in familial hypercholesterolemia (FH) and control groups. A – A total of 88 upregulated and 358 downregulated DEGs were identified from the GSE13985 dataset comparing the familial hypercholesterolemia and control groups. B–D – The top 10 genes from PPI network analysis were identified using three different topological measures: (B) MNC, (C) degree, and (D) closeness. The MNC network consisted of 10 nodes and 40 edges, the degree network contained 10 nodes and 40 edges, and the closeness network had 10 nodes and 29 edges. E – Seven overlapping genes – MRPL22, RPL9, RPS5, RPLP0, COX7C, SNRPD2, and RPS9 – were identified through bioinformatics analysis from three algorithms. F – Expression analysis of these seven genes showed significant downregulation in the FH case group compared to the control group within the GSE13985 dataset
DEGs – differentially expressed genes, PPI – protein-protein interaction, MNC – maximal neighborhood component, FH – familial hypercholesterolemia. *P < 0.05.
Establishment of hyperlipidemia model
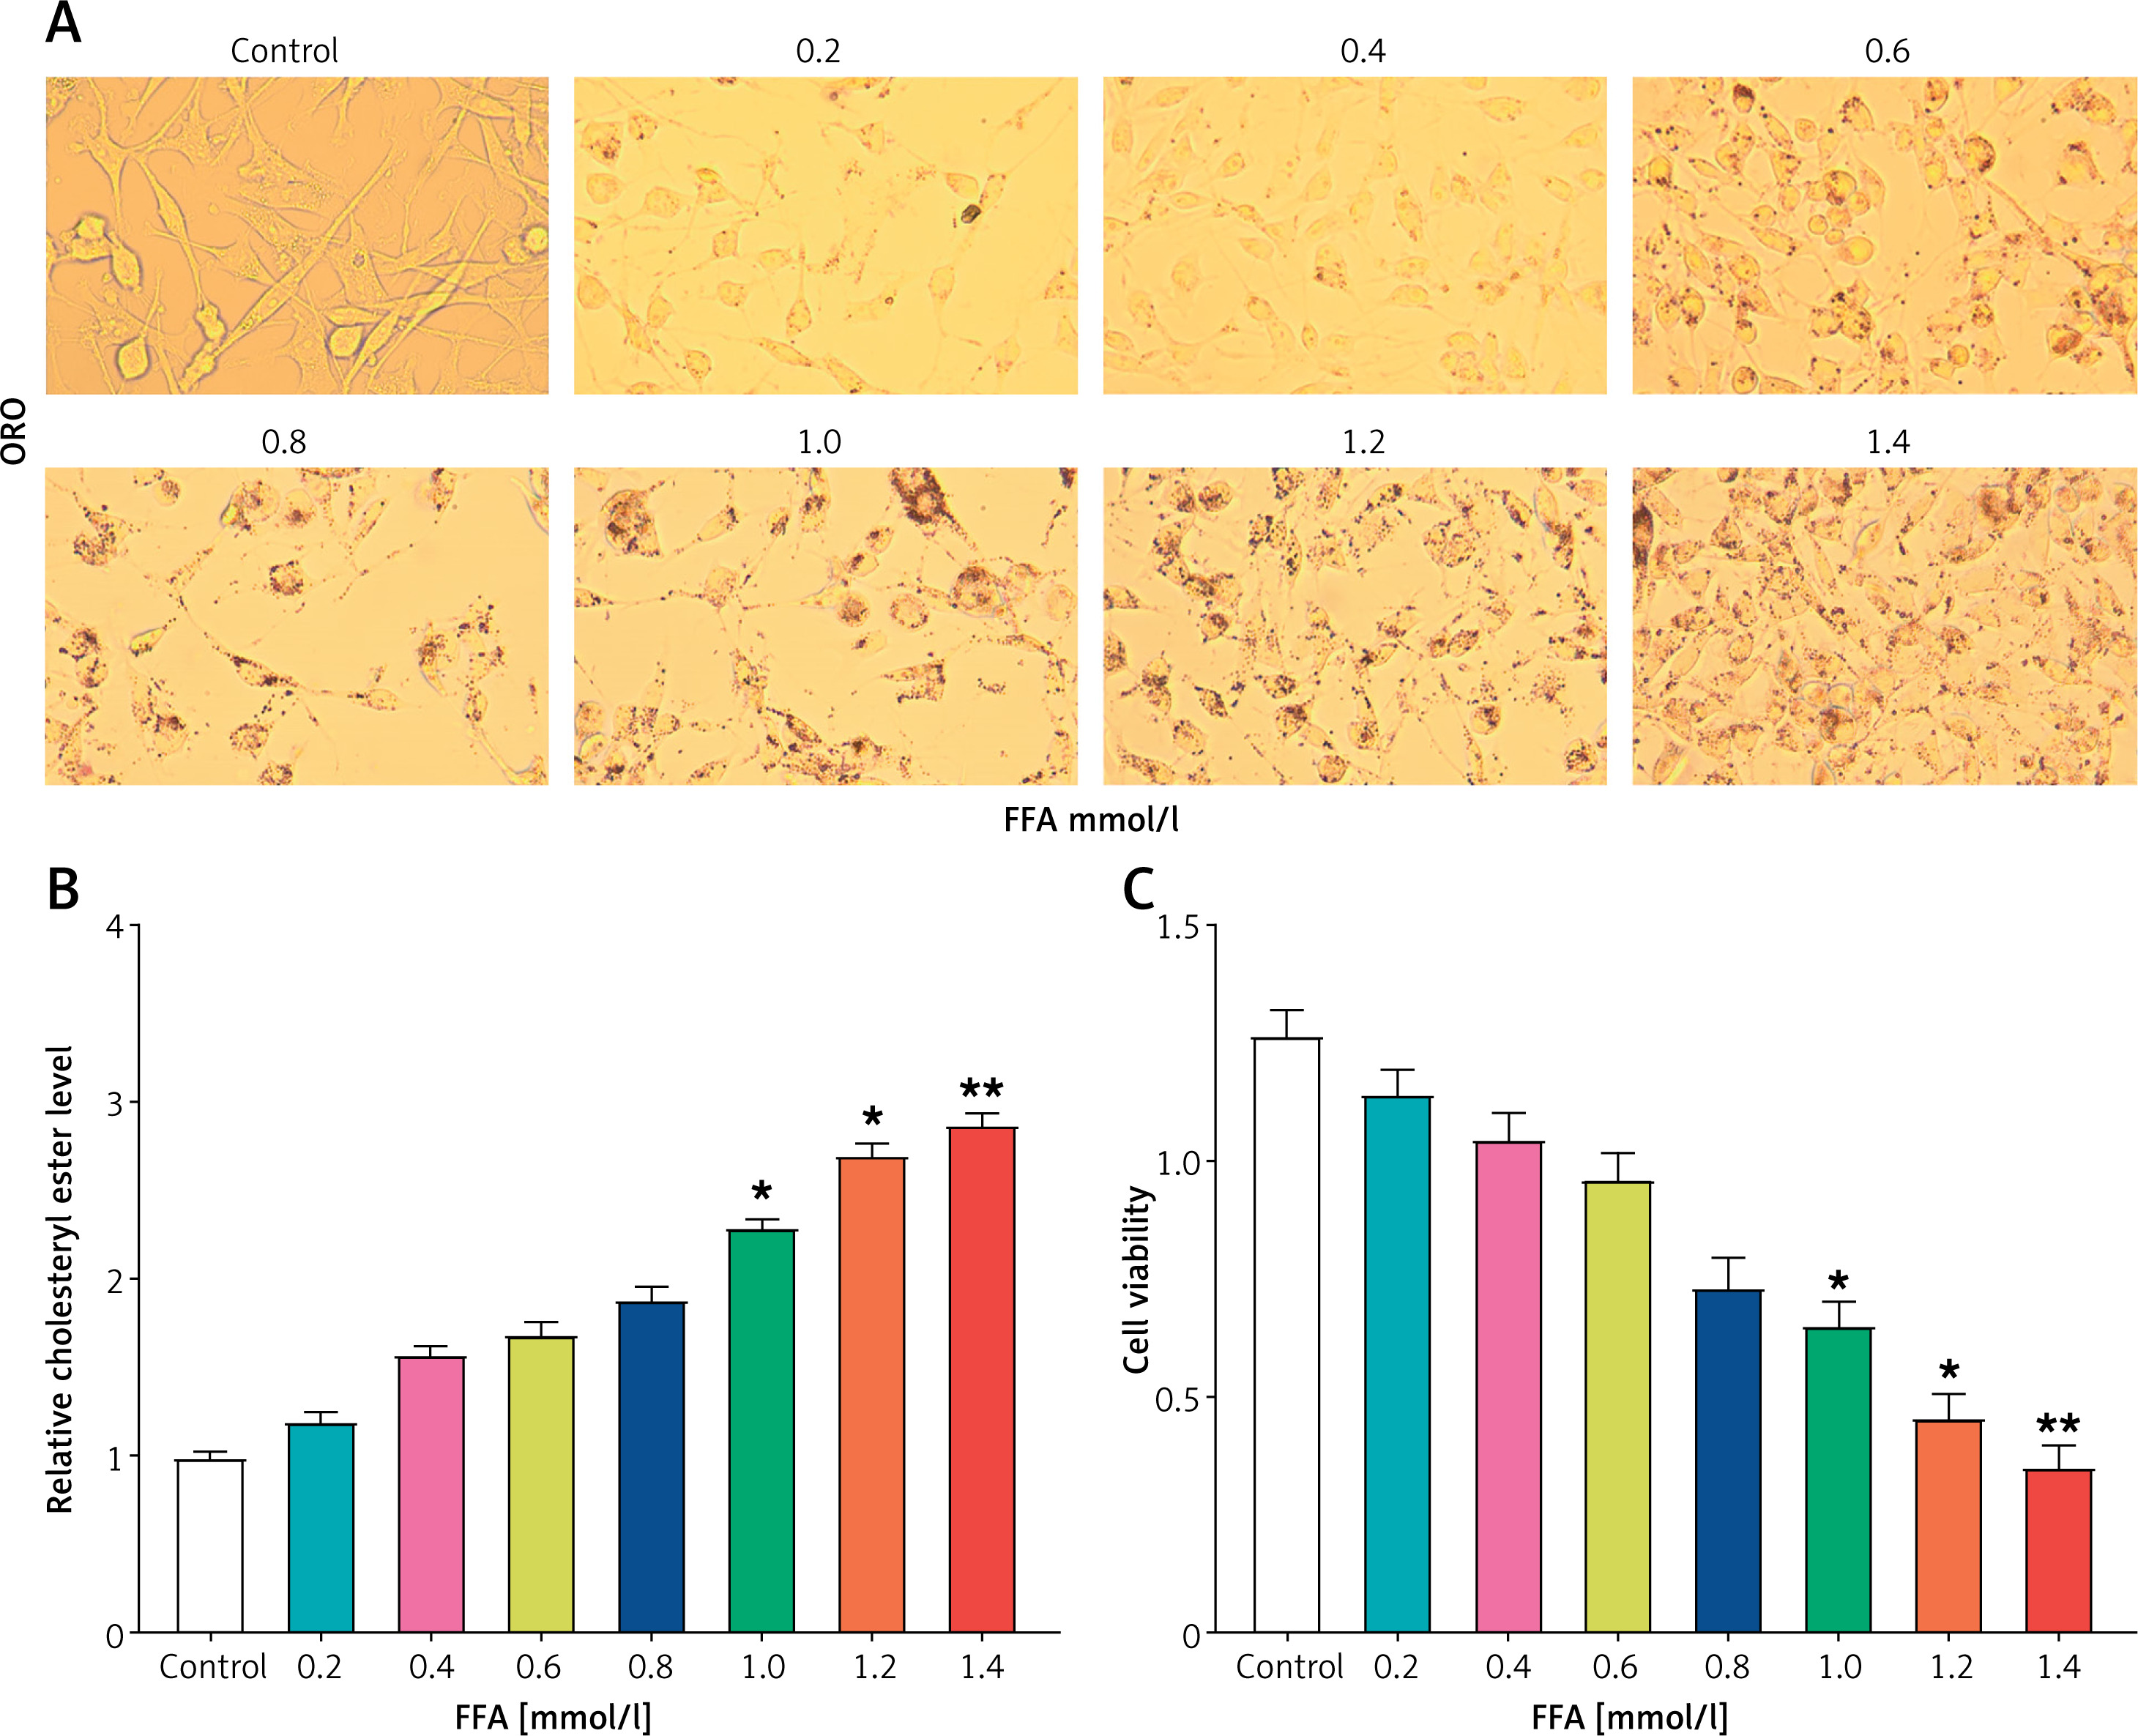
To determine the optimal conditions for inducing lipid load in HepG2 cells using FFA, L02 cells without FFA treatment served as the control group, and HepG2 cells received therapy with varied doses of FFA (0.2, 0.4, 0.6, 0.8, 1.0, 1.2, 1.4 mmol/l). ORO staining findings indicated that with the increase of FFA concentration, obvious lipid droplets could be seen in the cells, especially at higher concentrations (Figure 2 A). Then, contrasted with the control cells, the cholesterol ester level in HepG2 cells increased significantly when treated with FFA at levels of 1.0, 1.2, and 1.4 mmol/l (Figure 2 B). In addition, at these FFA concentrations, cell viability was considerably suppressed in a dose-dependent manner, especially in the range 1.0–1.4 mmol/l (Figure 2 C). Based on this, 1.0 mmol/l FFA was chosen to treat HepG2 cells to establish a lipid load model in subsequent experiments.
Figure 2
Establishment of hyperlipidemia model in HepG2 cells. A – Oil Red O (ORO) staining was performed to assess the accumulation of lipid droplets in HepG2 cells treated with varying concentrations of free fatty acids (FFA). The doses of FFA used were 0.2, 0.4, 0.6, 0.8, 1.0, 1.2, and 1.4 mmol/l, and the cells were treated for 24 h. B – Quantification of relative cholesterol ester levels in HepG2 cells treated with different concentrations of FFA. C – Cell viability analysis using the CCK-8 assay in HepG2 cells treated with increasing concentrations of FFA
ORO – oil red O, FFA – free fatty acids, CCK-8 – cell counting Kit-8. *P < 0.05. **P < 0.01.
Low expression of COX7C in the hyperlipidemia model
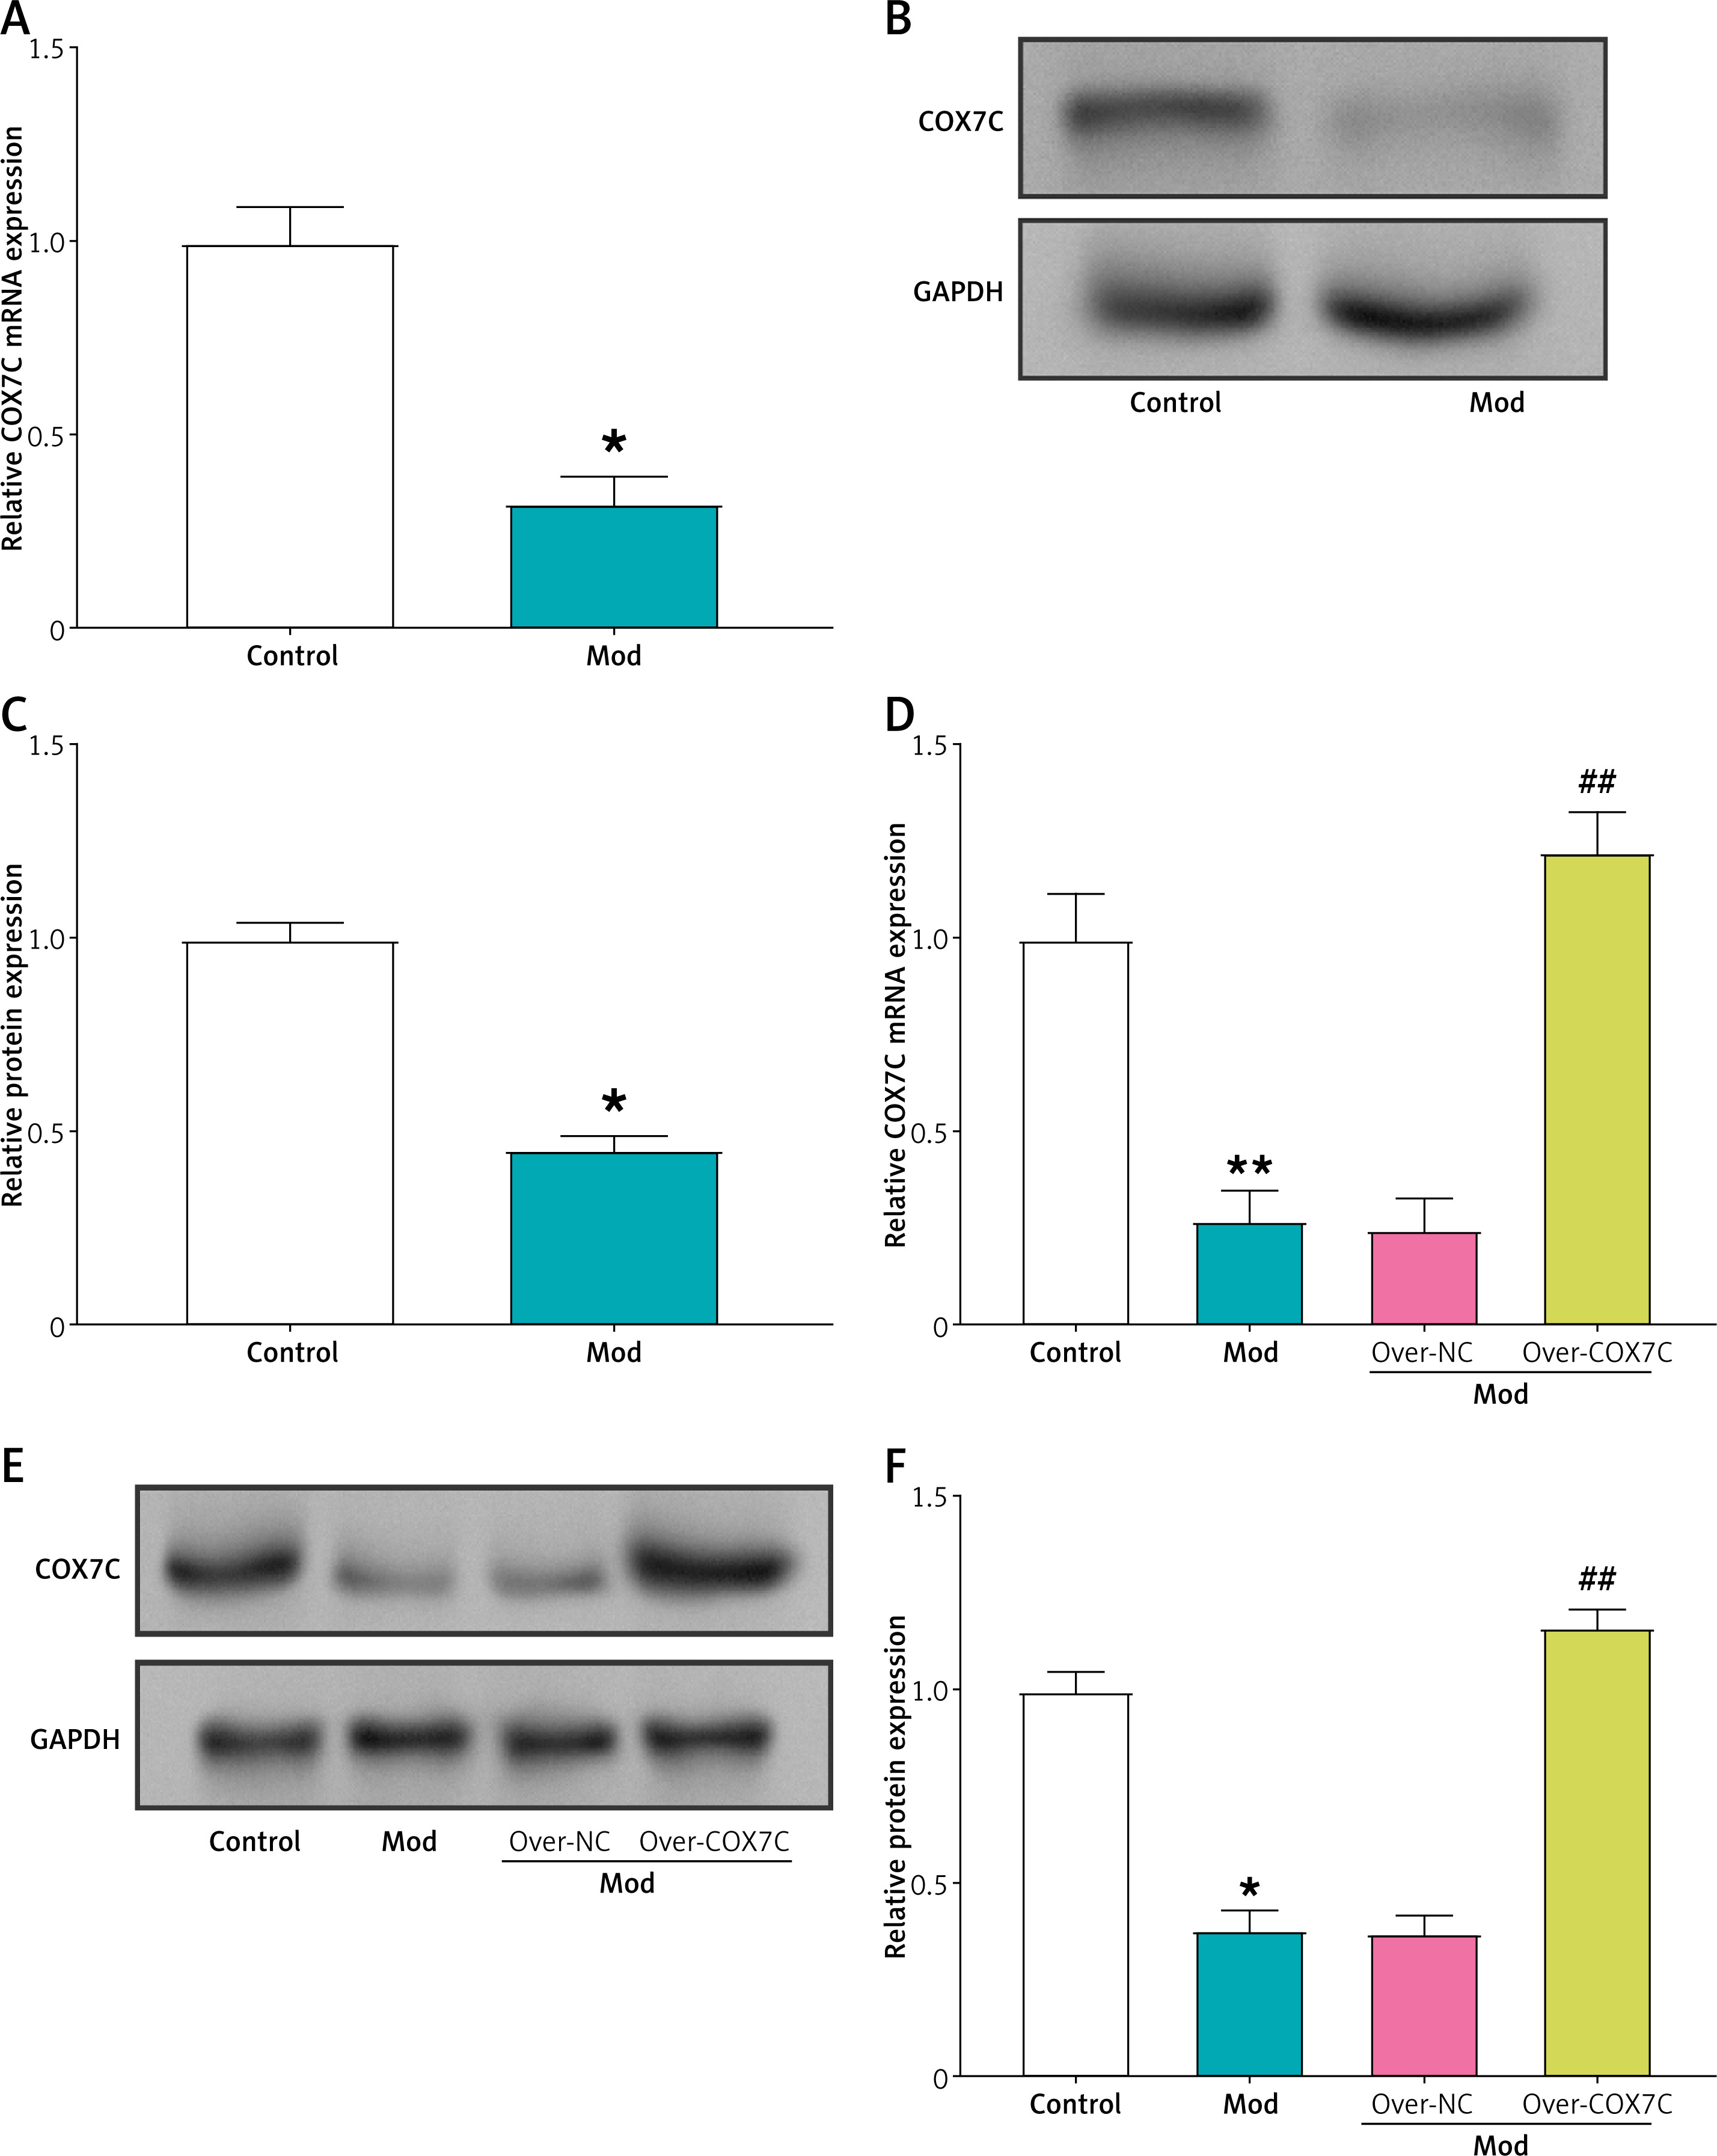
qRT-PCR assays were used to determine the relative mRNA expression of COX7C in the control group and the hyperlipidemia model group. The model group’s COX7C mRNA expression was noticeably lower than that of the control group (Figure 3 A). This was confirmed by the results of protein level detection, and significant downregulation of COX7C expression was observed in the model group (Figures 3 B, C). Then, the cells in the model group were infected with the COX7C overexpression plasmid, and the outcomes of WB and qRT-PCR experiments demonstrated that COX7C was successfully overexpressed (Figures 3 D–F).
Figure 3
COX7C is underexpressed in the hyperlipidemia model. A – Quantitative real-time PCR (qRT-PCR) was performed to assess the mRNA expression level of COX7C in the hyperlipidemia model (Mod). The results indicated significant downregulation of COX7C expression in the model compared to the control. *P < 0.05. B, and C) Western blot (WB) analysis was conducted to examine the protein expression of COX7C in Mod. The protein levels were visualized, and Figure C presents the grayscale quantification of the COX7C bands, showing a marked decrease in protein expression in the hyperlipidemia model. *P < 0.05. D – The transfection efficiency of overexpressed COX7C (over-COX7C) was evaluated using qRT-PCR. The data confirmed successful overexpression of COX7C in Mod cells, indicating effective transfection and elevated COX7C mRNA levels compared to the control group. **P < 0.01 vs. control. ##P< 0.01 vs. over-NC. E, F – WB analysis was used to assess the protein expression of COX7C after transfection with over-COX7C in Mod. The protein expression was quantified, F presents the grayscale quantification of the WB bands, confirming the successful overexpression of COX7C at the protein level. *P < 0.05 vs. control. ##P < 0.01 vs. over-NC
qRT-PCR – quantitative real-time polymerase chain reaction, WB – Western blot.
Overexpression of COX7C alleviates lipid accumulation and improves cell viability in the hyperlipidemia model
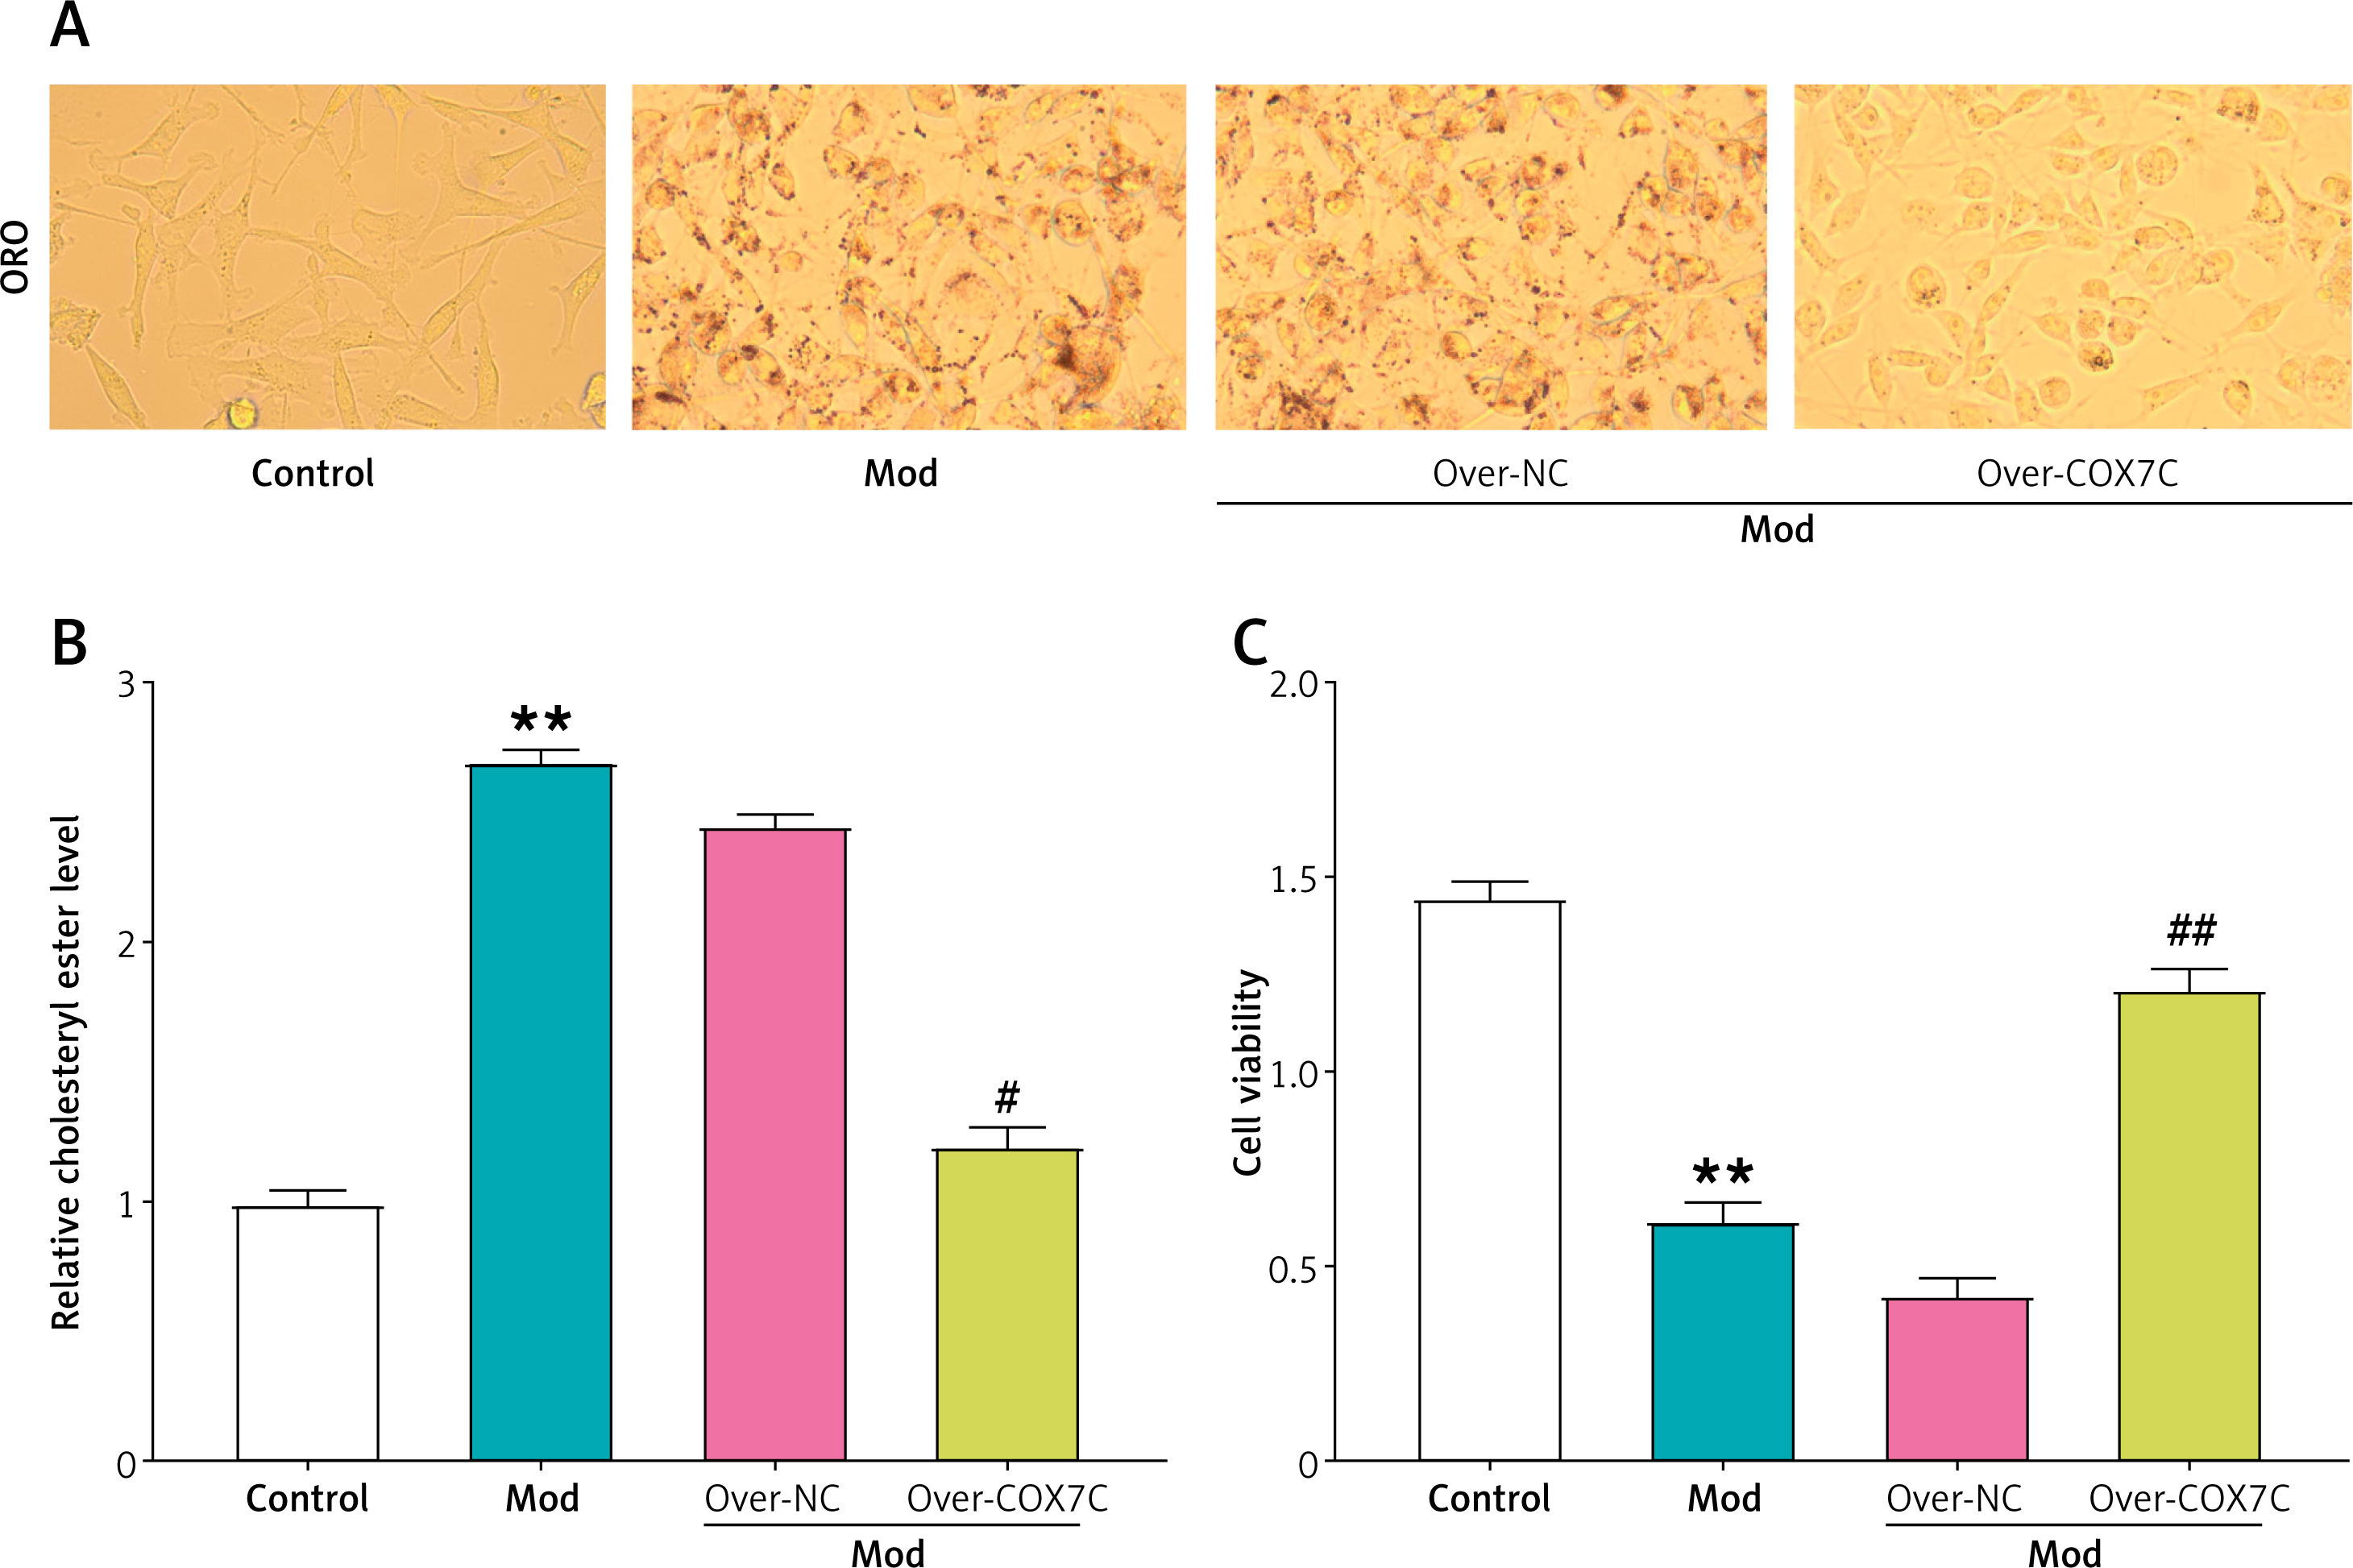
ORO staining results revealed that red lipid droplets progressively increased in number, and cell volume expanded in the model group. However, the addition of overexpressed COX7C reversed these changes, leading to a reduction in lipid droplet content (Figure 4 A). Consistent with these findings, cholesterol assay findings showed that the relative cholesterol ester levels were notably elevated within the model group, while overexpression of COX7C reversed this increase, resulting in a marked decrease in cholesterol ester levels (Figure 4 B). Similarly, CCK-8 assays revealed a notable decline in cell viability in the model group, which was partially alleviated by the overexpression of COX7C (Figure 4 C).
Figure 4
COX7C inhibits lipid accumulation in hyperlipidemia model cells. A – Oil Red O (ORO) staining of HepG2 cells under different conditions. Compared to the control group, FFA-induced model (Mod) cells exhibited increased lipid droplet accumulation. Overexpression of COX7C (over-COX7C) significantly reduced lipid accumulation compared to the Mod and negative control (over-NC) groups. B – Quantification of relative cholesterol ester levels in different treatment groups. The results revealed a marked decrease in cholesterol ester content in the over-COX7C transfected cells, suggesting a reduction in lipid accumulation. C – Cell viability of Mod cells after over-COX7C transfection was assessed using the CCK-8 assay.
ORO – oil red O, CCK-8 – Cell Counting Kit-8. **P < 0.01 vs. control. #P < 0.05 vs. over-NC. ##P < 0.01 vs. over-NC.
COX7C overexpression reduces mitochondrial damage in hyperlipidemia model
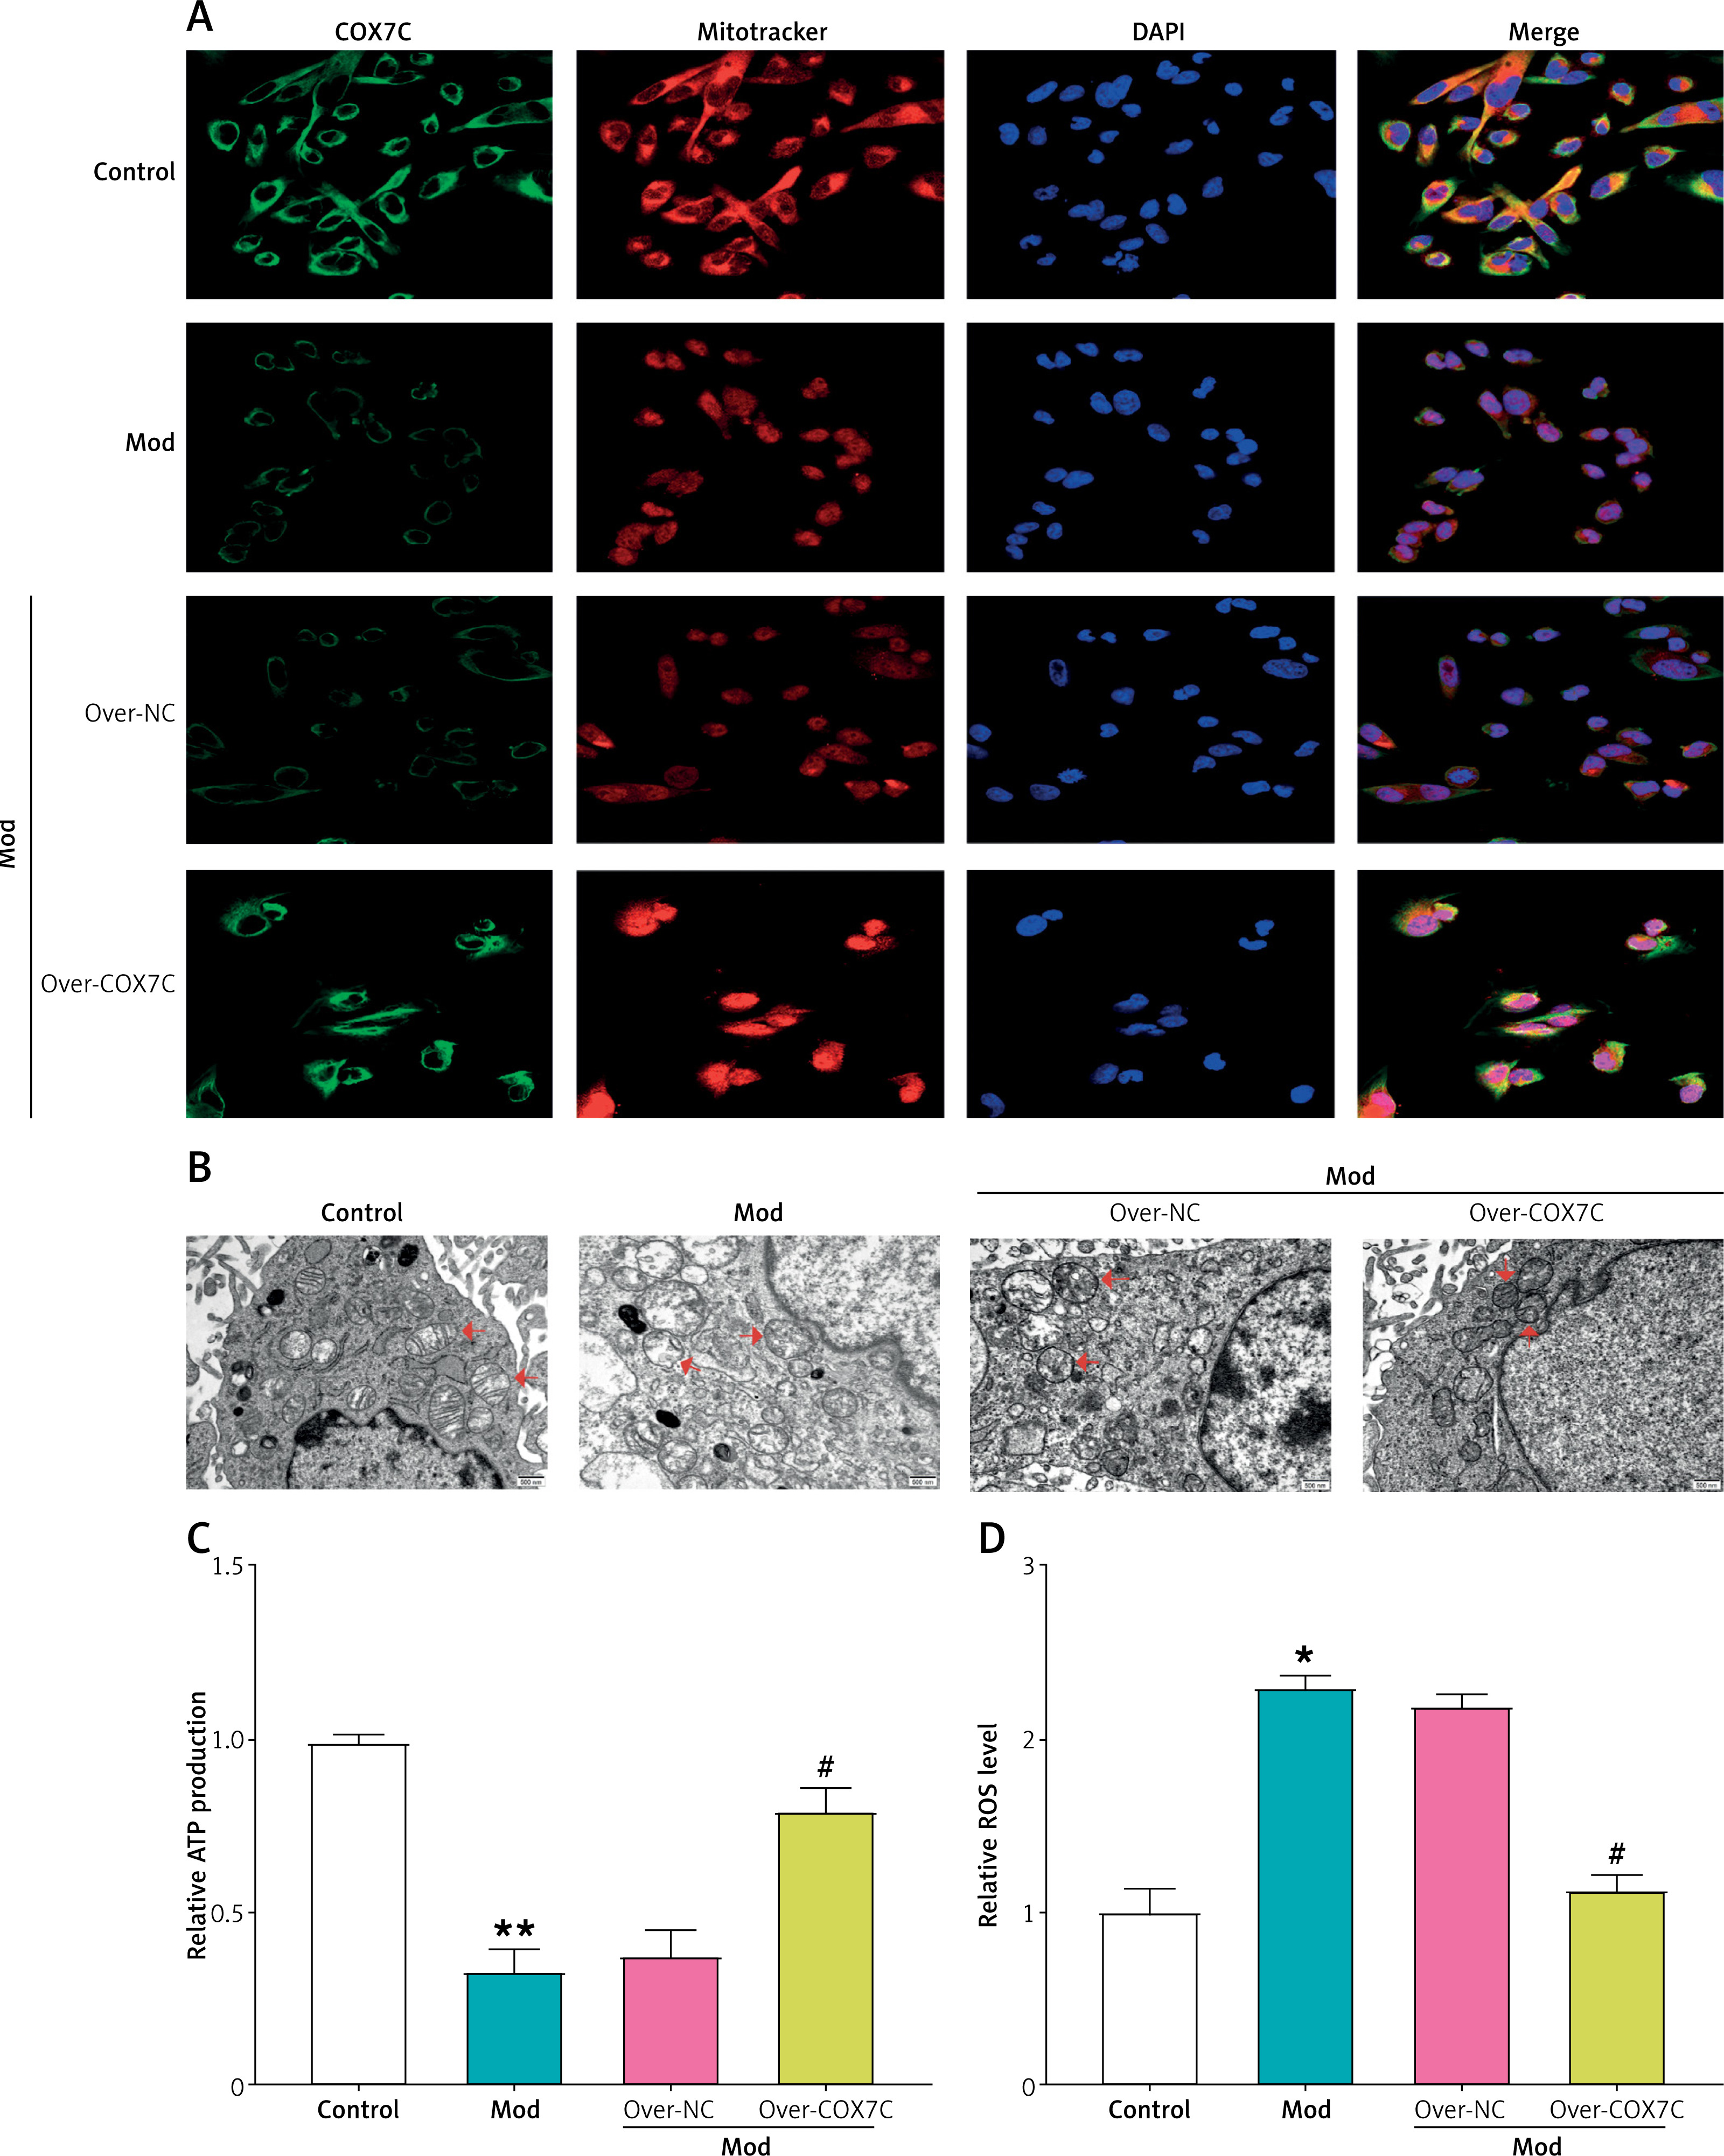
Excessive lipid deposition in the vascular wall and vascular occlusion can lead to hypoxia, and the primary oxygen-consuming organelles are mitochondria [18]. COX7C is known to play a key role by protecting mitochondrial function [19]. Therefore, we speculate that COX7C may achieve the effect of treating hyperlipidemia by preserving mitochondrial activity and lowering the amount of ROS it produces. Immunofluorescence analysis showed that in the model group, COX7C expression and mitochondrial integrity were significantly reduced, and there were fewer COX7C-positive mitochondria. However, compared with the over-NC group, overexpression of COX7C (over-COX7C) restored COX7C expression and mitochondrial distribution, as shown in the merged image (Figure 5 A). According to the results of transmission electron microscopy, the control group’s mitochondria seemed normal, while the mitochondria in the model group showed swollen morphology and disrupted cristae (indicated by red arrows). Overexpression of COX7C significantly improved the morphology of mitochondria, and the mitochondria looked more complete, comparable to the control group (Figure 5 B). Furthermore, a notable decline in ATP production in the model group was detected, but overexpression of COX7C alleviated this decrease (Figure 5 C). In contrast, overexpression of COX7C effectively suppressed the increase in ROS levels in the model (Figure 5 D).
Figure 5
COX7C reduces FFA-induced mitochondrial damage. A – Immunofluorescence staining of COX7C (green), mitochondria (MitoTracker, red), and nuclei (DAPI, blue) in different treatment groups. The Mod group exhibited decreased COX7C expression and mitochondrial integrity compared to the control. COX7C overexpression (over-COX7C) restored mitochondrial integrity and increased COX7C expression. B – Transmission electron microscopy (TEM) was used to assess mitochondrial morphology in Mod cells after over-COX7C transfection. The mitochondrial structure was observed at high resolution, revealing notable changes in mitochondrial appearance and integrity in response to overexpression of COX7C. C – ATP production was measured in Mod cells following over-COX7C transfection using an ATP detection kit. D – ROS levels were quantified using an ROS detection kit in Mod cells after overexpression of COX7C
ATP – adenosine triphosphate, ROS – reactive oxygen species. *P < 0.05 vs. control. **P < 0.01 vs. control. #P < 0.05 vs. over-NC.
COX7C overexpression inhibits apoptosis in hyperlipidemia model
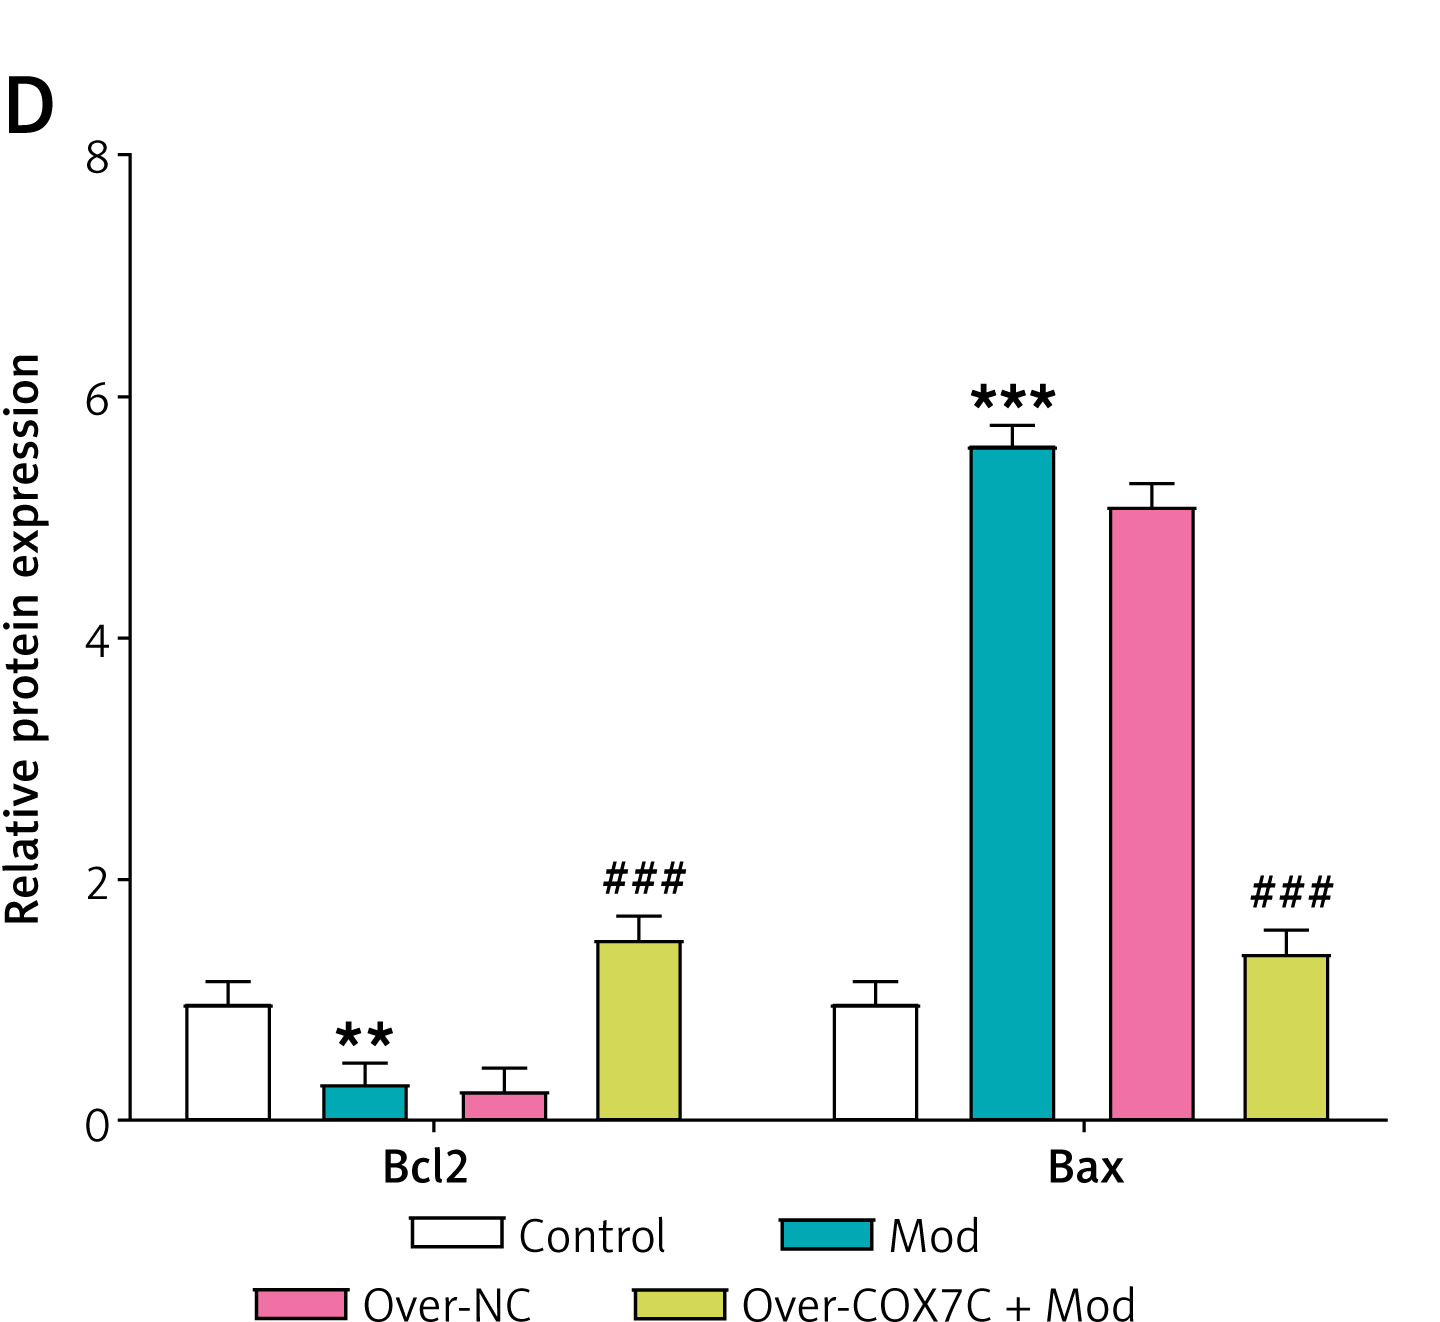
Previous studies have shown that mitochondrial dysfunction contributes to cell apoptosis, and mitochondrial damage increases cell apoptosis under certain conditions [20]. Therefore, we detected the changes of cell apoptosis in the hyperlipidemia model. Flow cytometry analysis indicated that the model group’s apoptosis had significantly increased, which was reversed by the overexpression of COX7C (Figures 6 A, B). WB analysis showed that, in the model group, the expression of Bcl-2 was significantly reduced, while the manifestation of Bax was markedly increased. However, overexpression of COX7C reversed these changes, restoring Bcl-2 expression as well as lowering Bax levels (Figures 6 C, D).
Figure 6
COX7C inhibits FFA-induced apoptosis by reducing mitochondrial damage. A, B – Flow cytometry analysis was performed to assess the extent of apoptosis in Mod cells following over-COX7C transfection. Panel B presents the histogram depicting the apoptosis rate. C, D – Western blot (WB) analysis was conducted to examine the expression levels of key apoptosis-related proteins, including Bcl-2 and Bax, in Mod cells after transfection with over-COX7C. Panel D presents a grayscale quantification of the protein bands, indicating relative expression levels
WB, Western blot. **P < 0.01 vs. control. ***P < 0.001 vs. control. ##P < 0.01 vs. over-NC. ###P < 0.001 vs. over-NC.
COX7C alleviates mitochondrial damage and inhibits apoptosis in the hyperlipidemia model by activating HIF-1α
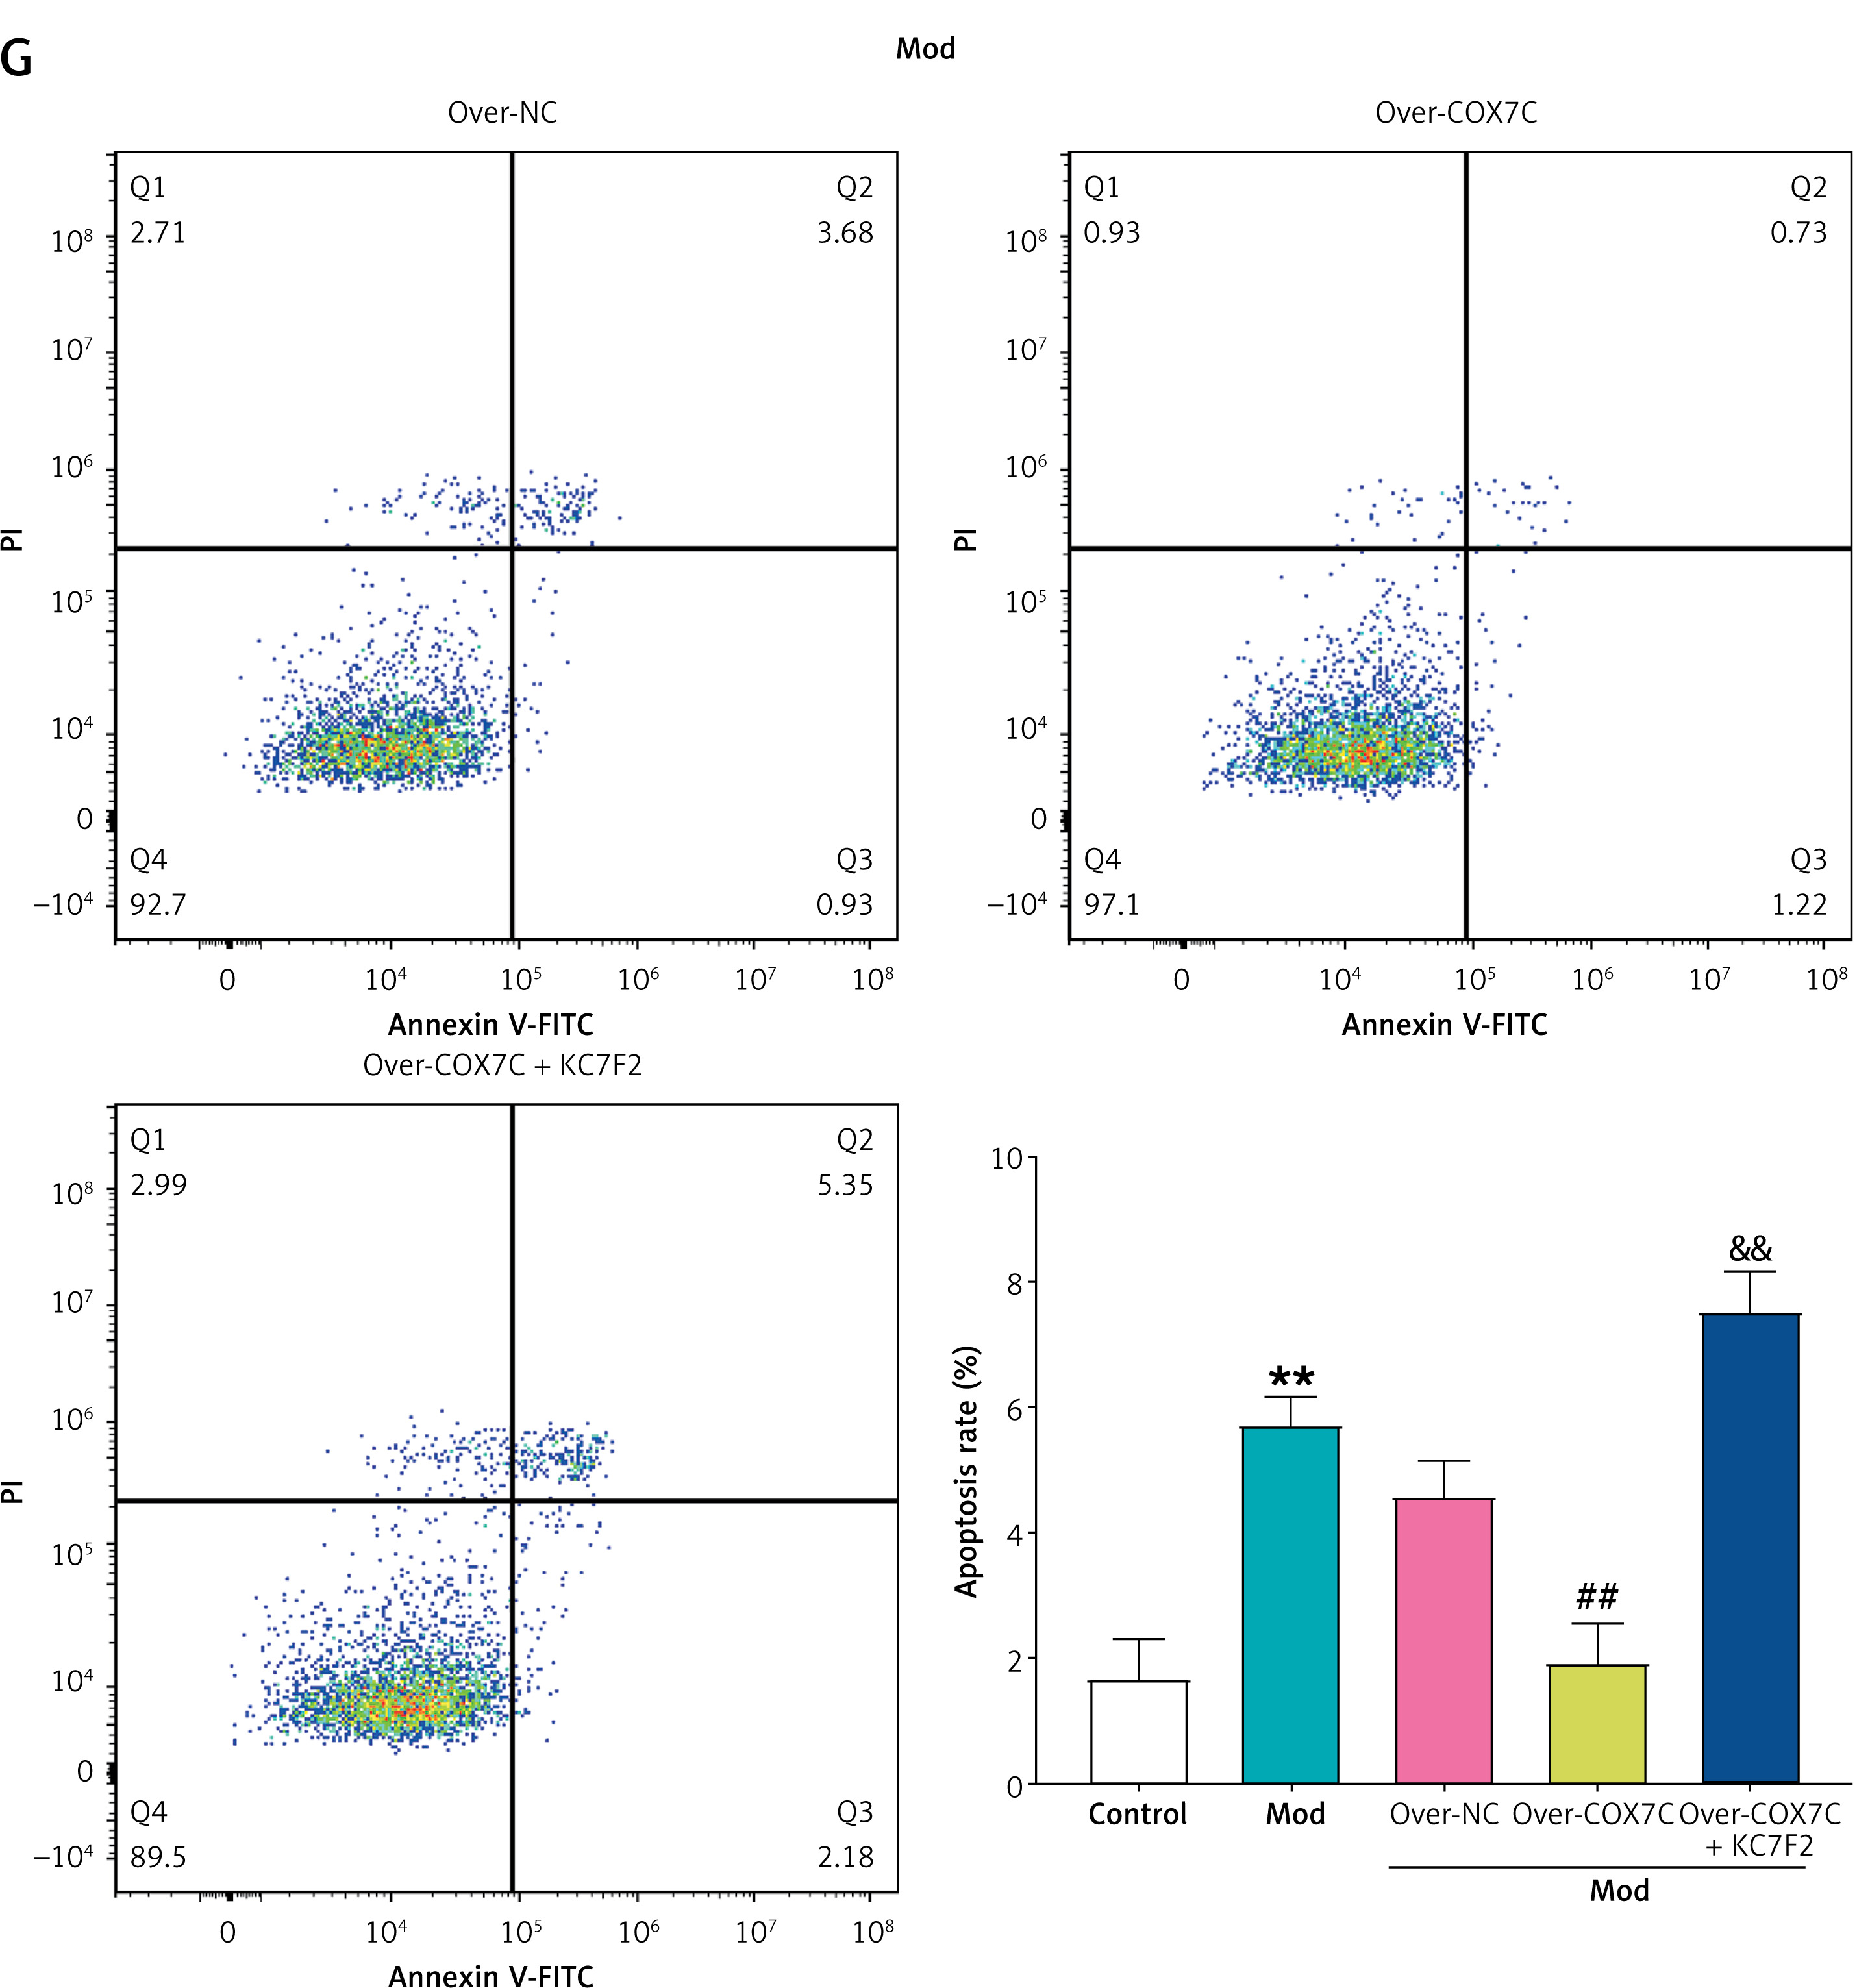
We hypothesized that COX7C improves hyperlipidemia by acting on the HIF-1 signaling pathway, since the hypoxia theory states that arterial hypoxia causes plaque development and HIF-1α is sensitive to intracellular oxygen concentration [21]. WB analysis and qRT-PCR indicated that the model group’s HIF-1α expression was noticeably higher. Notably, overexpression of COX7C further increased HIF-1α levels in the model (Figures 7 A–C). To investigate the impact of HIF-1α inhibition, KC7F2, a specific HIF-1α inhibitor, was applied. Transmission electron microscopy showed that mitochondria were significantly swollen in the model group, but overexpression of COX7C restored mitochondrial morphology to levels similar to the control group. KC7F2 treatment partially inhibited this recovery, resulting in moderately swollen mitochondria compared to the Mod group (Figure 7 D). Additionally, ATP production was assessed using an ATP assay kit. Overexpression of COX7C reversed the drop in ATP levels brought on by the model condition, whereas KC7F2 treatment attenuated this reversal, reducing ATP levels to those comparable to the model group (Figure 7 E). In contrast, the model group’s ROS levels were significantly higher than those of the control group. COX7C overexpression reduced ROS levels, while combined treatment with KC7F2 significantly increased ROS levels in the COX7C + KC7F2 group (Figure 7 F). Analysis via flow cytometry demonstrated a marked rise in apoptosis in the Mod group, which was reversed by COX7C overexpression, bringing apoptosis levels back to control values. However, KC7F2 treatment led to a significant rise in apoptosis, surpassing even the levels observed in the Mod group (Figure 7 G). These findings imply that COX7C influences mitochondrial function and apoptosis through the HIF-1α pathway in the context of hyperlipidemia.
Figure 7
COX7C inhibits FFA-induced apoptosis by reducing FFA-induced mitochondrial damage through the activation of HIF-1α. A – qRT-PCR was employed to measure the mRNA expression levels of HIF-1α in Mod cells following over-COX7C transfection, revealing the changes in HIF-1α expression after modulation. B, C – WB analysis was conducted to assess the protein levels of HIF-1α in Mod cells after over-COX7C transfection. Panel C displays the grayscale quantification of the protein bands, indicating the relative expression levels of HIF-1α in the over-COX7C-treated group. D – Transmission electron microscopy (TEM) was used to examine the morphology of mitochondria in Mod cells after over-COX7C transfection and combined treatment with the HIF-1α inhibitor, KC7F2. E – ATP production in Mod cells after over-COX7C transfection and co-treatment with KC7F2 was assessed using an ATP detection kit, indicating the impact of HIF-1α activation on cellular energy levels. F – The reactive oxygen species (ROS) content in Mod cells was measured using an ROS detection kit following over-COX7C transfection and KC7F2 treatment, revealing the effects on oxidative stress. G – Flow cytometry was used to quantify the level of apoptosis in Mod cells after over-COX7C transfection and KC7F2 treatment, providing a comprehensive analysis of the cell death response under these experimental conditions. G – Flow cytometry was used to quantify the level of apoptosis in Mod cells after over-COX7C transfection and KC7F2 treatment, providing a comprehensive analysis of the cell death response under these experimental conditions
FFA – free fatty acids, qRT-PCR – quantitative real-time polymerase chain reaction, WB – Western blot, TEM – transmission electron microscopy, ATP – adenosine triphosphate, ROS – reactive oxygen species. *P < 0.05 vs. control. **P < 0.01 vs. control. #P < 0.05 vs. over-NC. ##P < 0.01 vs. over-NC. &P < 0.05 vs. over-COX7C. &&P < 0.01 vs. over-COX7C.
COX7C affects cellular lipid accumulation and cell viability in a hyperlipidemia model by activating HIF-1α
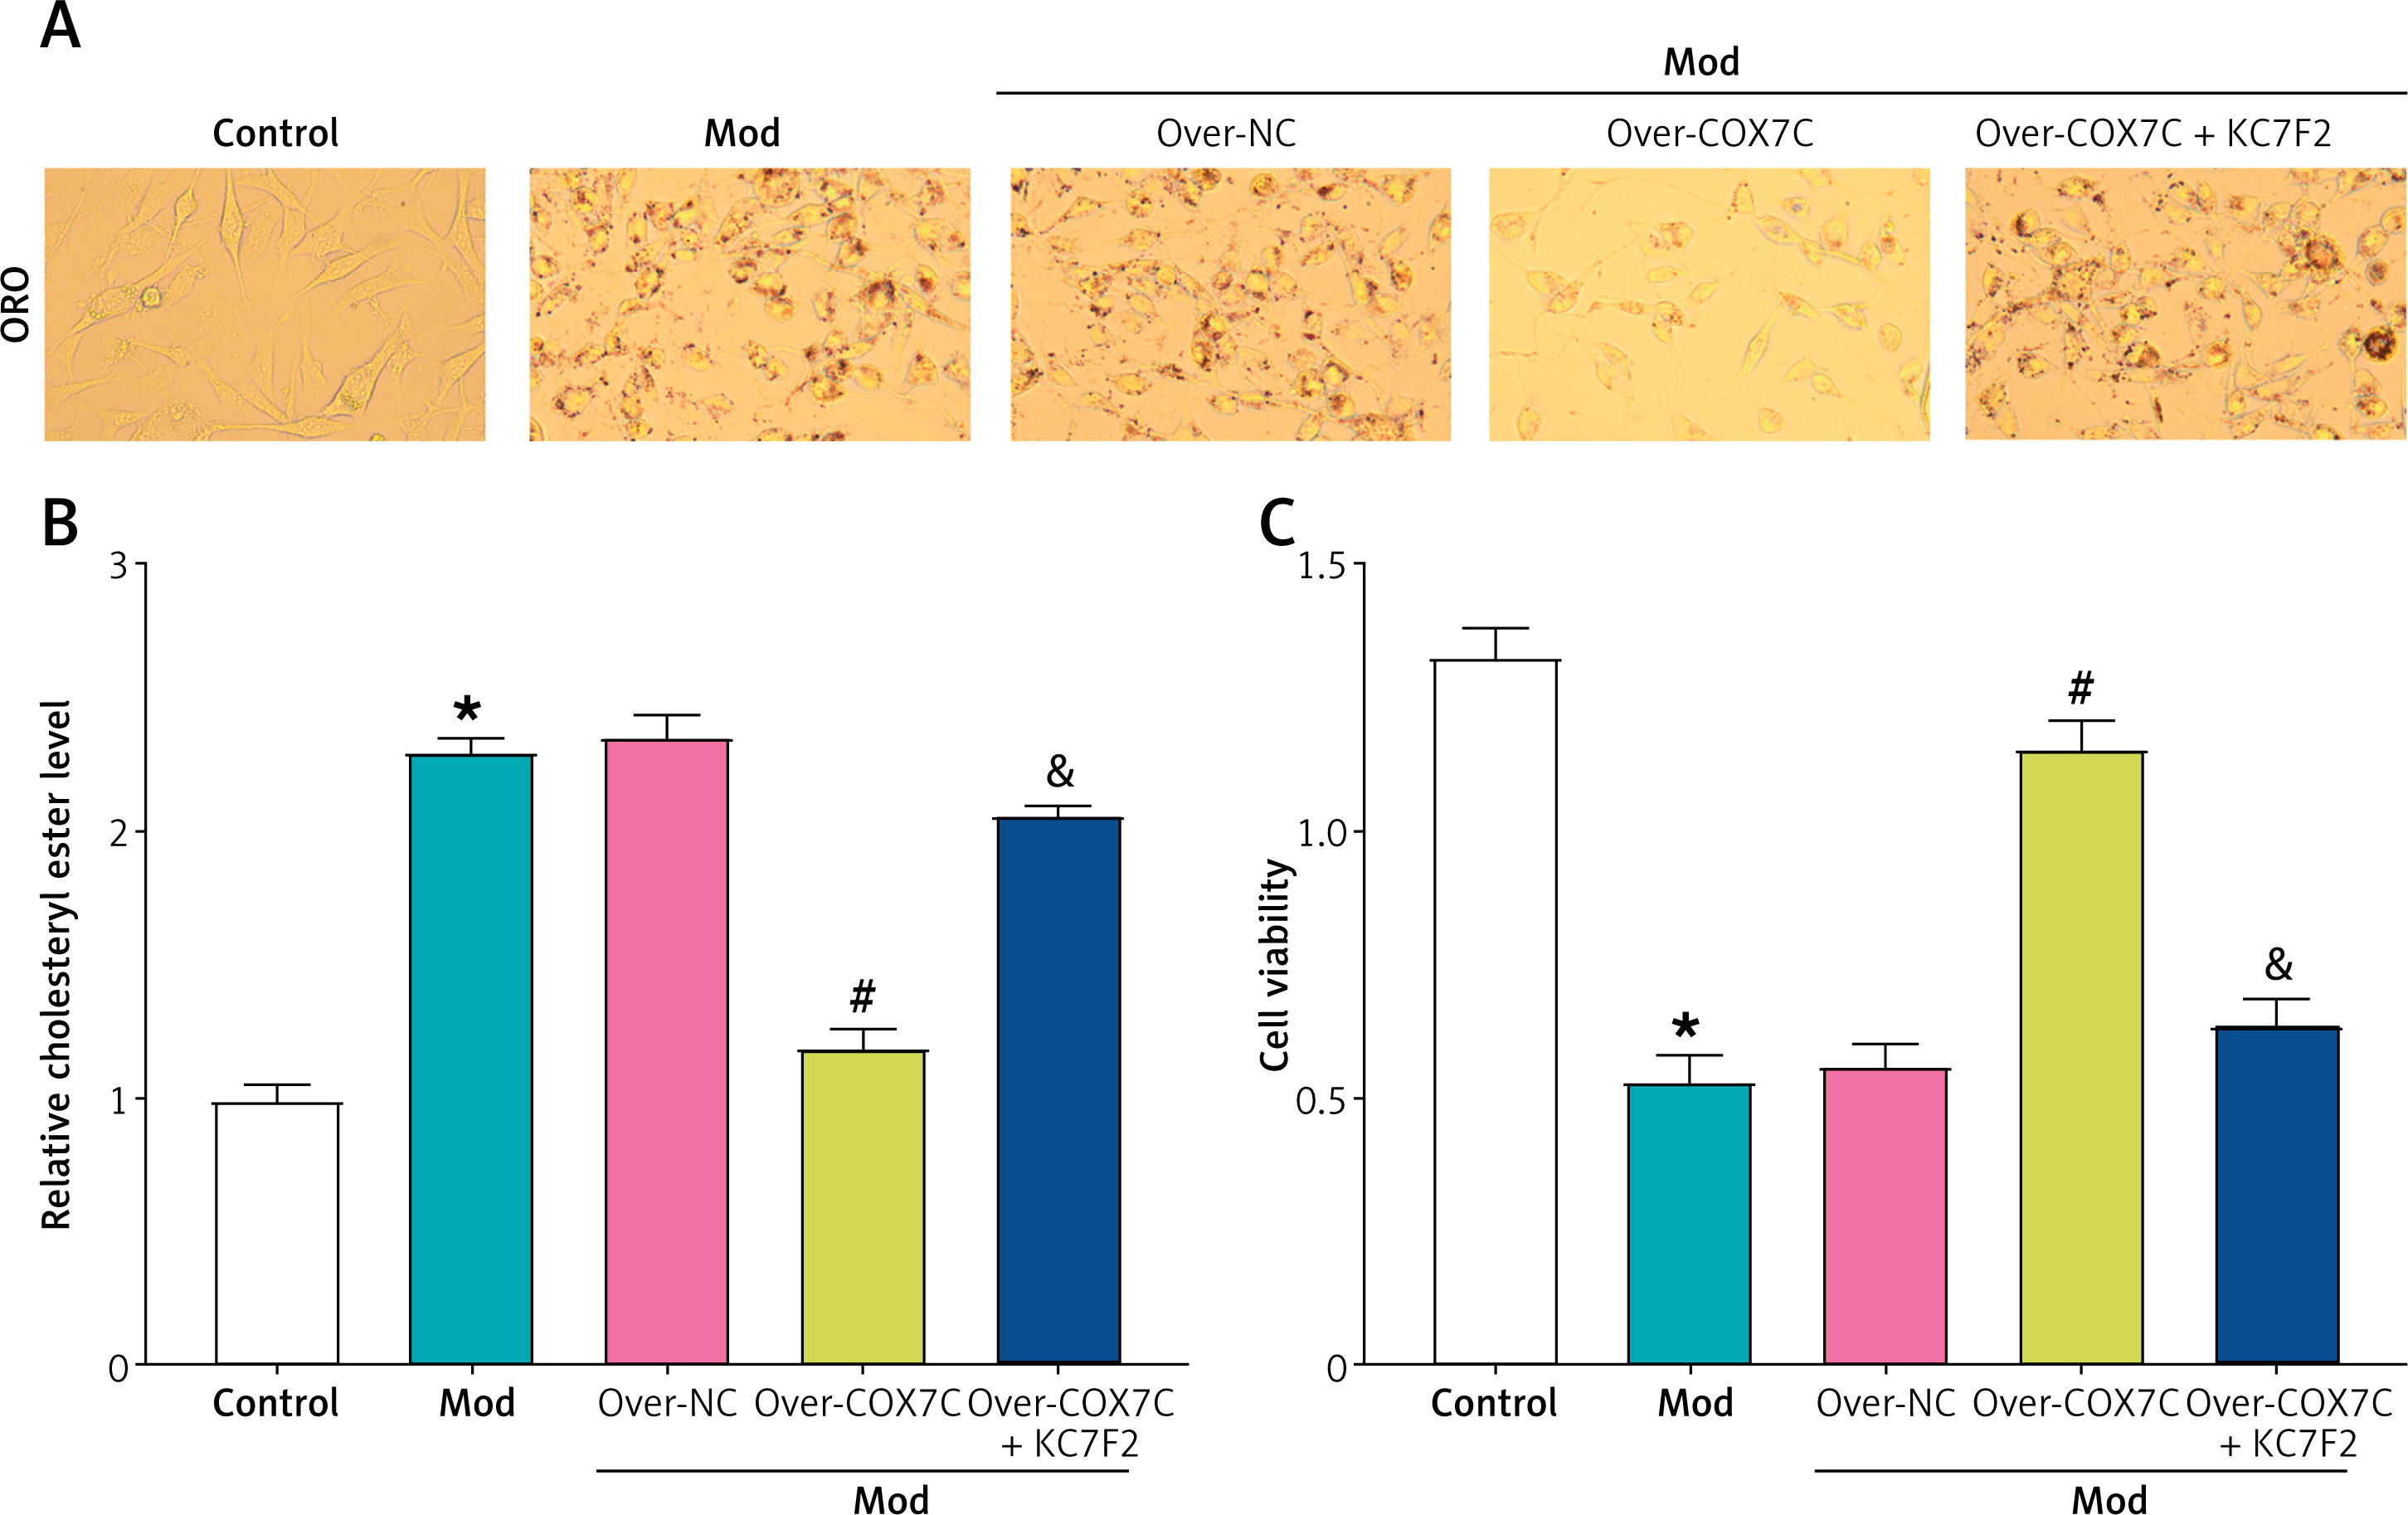
ORO staining results demonstrated that overexpression of COX7C significantly alleviated the increase in red lipid droplet content induced by the model condition. However, treatment with the HIF-1α inhibitor KC7F2 reversed this effect, restoring the lipid droplet content to levels comparable to the model group (Figure 8 A). Similarly, cholesterol ester levels, as measured by a cholesterol assay kit, showed that overexpression of COX7C mitigated the increase in relative cholesterol ester levels induced by the model. However, KC7F2 reduced the effect of COX7C overexpression, leading to cholesterol ester levels that approached those of the Mod group, although not fully restoring them (Figure 8 B). In contrast, CCK-8 assay results indicated that overexpression of COX7C helped preserve cell viability, which was significantly decreased in the model group. KC7F2 reversed this protective effect, restoring cell viability to levels comparable to the model group (Figure 8 C).
Figure 8
COX7C inhibits lipid accumulation in cells by activating HIF-1α. A – ORO staining was performed to detect the accumulation of red lipid droplets in Mod after transfection with over-COX7C and subsequent treatment with over-COX7C + KC7F2. The images were captured to visualize the lipid droplet content, and the intensity of red staining indicates the extent of lipid accumulation. B – The relative cholesterol ester level in Mod was measured using a cholesterol detection kit after over-COX7C transfection and over-COX7C + KC7F2 treatment. This assay quantified the amount of cholesterol ester within the cells, reflecting the lipid metabolic state under different treatments. C – Cell viability was assessed using the CCK-8 assay in Mod cells following over-COX7C transfection and over-COX7C + KC7F2 treatment.
ORO – Oil Red O, CCK-8 – Cell Counting Kit-8. *P < 0.05 vs. control. #P < 0.05 vs. over-NC. &P < 0.05 vs. over-COX7C.
Discussion
Free fatty acids (FFA), a 2 : 1 combination of palmitic acid and oleic acid, are commonly used in research to study metabolic and cellular processes [22]. This mixture mimics the effects of elevated fatty acids in conditions such as obesity, insulin resistance, and cardiovascular diseases, offering insights into related pathophysiological mechanisms [23]. In the human body, lipid metabolism is significantly influenced by the liver [24]. Since atherosclerosis may be successfully postponed by improving lipid metabolism, we employed human HepG2 cells [25]. We discovered in our research that FFA could greatly disrupt lipid metabolism. Specifically, CCK-8 tests and ORO staining revealed that increasing FFA concentrations (1.0–1.4 mmol/l) led to increased lipid accumulation and decreased cell viability, and 1.0 mmol/L was determined to be the ideal concentration for the lipid load model.
Through bioinformatic analysis of the GSE13985 dataset, seven overlapping genes were identified, MRPL22, RPL9, RPS5, RPLP0, COX7C, SNRPD2, and RPS9, all of which were notably downregulated across the GSE13985 dataset’s case group. COX7C is a subunit of COX, an essential enzyme in mitochondrial oxidative phosphorylation [26]. Research has indicated that the expression of COX7C is linked to lipid metabolism and energy production. In hyperlipidemic conditions, altered COX7C levels may contribute to mitochondrial dysfunction, oxidative stress, and atherosclerosis development. In the research conducted by Wang et al., COX7C was identified as a potential marker for atherosclerosis development in FH patients [27]. Differentially expressed genes, including COX7C, were more abundant in oxidative phosphorylation and ribosomal pathways, suggesting their involvement in atherosclerosis and their potential as therapeutic targets. In our research, COX7C expression was significantly downregulated in a hyperlipidemia model. Overexpression of COX7C successfully reversed lipid accumulation, reducing lipid droplet content and cholesterol ester levels. Additionally, overexpressing COX7C partially alleviated the reduced cell viability in the model, suggesting its protective role in lipid metabolism.
Mitochondrial damage is essential to various cellular dysfunctions, especially in energy metabolism and oxidative stress regulation [28]. As the main site of ATP production through oxidative phosphorylation, mitochondrial dysfunction leads to decreased ATP levels, impairing energy-dependent cellular processes and overall cell viability [29]. Additionally, the primary generator of ROS is mitochondria, and excessive ROS production leads to oxidative stress, which damages proteins, lipids, and DNA [30]. This oxidative damage disrupts mitochondrial integrity, further impairs ATP production, and initiates the intrinsic apoptotic pathway through the release of pro-apoptotic factors [31]. The accumulation of oxidative stress and apoptotic signals ultimately leads to the progression of various diseases, including cardiovascular disease and atherosclerosis [32]. Prior research has shown the detrimental impacts of mitochondrial dysfunction on metabolic and vascular diseases. Yu et al. reported that mitochondrial DNA damage impairs ATP production, increases ROS production, and promotes oxidative stress, inflammation, and metabolic dysfunction, all of which lead to disease progression [33]. Similarly, Qu et al. emphasized that pathological conditions such as hyperglycemia and hypertension induce mitochondrial dysfunction in endothelial cells, leading to ROS accumulation, cellular energy stress, and apoptosis, thereby accelerating the development of atherosclerosis [34]. These findings highlight the critical link between mitochondrial homeostasis and disease pathology.
In our study, COX7C overexpression was found to alleviate FFA-induced mitochondrial damage by preserving mitochondrial structure and function. Specifically, COX7C restoration reduced ROS generation and rescued ATP levels, thereby maintaining cellular energy metabolism. Furthermore, mitochondrial dysfunction is intimately linked to apoptosis, as excessive oxidative stress promotes Bax activation while inhibiting Bcl-2, causing cytochrome c release and permeabilization of the outer membrane of the mitochondria [35]. Notably, our results indicate that COX7C overexpression inhibits apoptosis by upregulating Bcl-2 and downregulating Bax, thereby preventing mitochondria-mediated cell death in a hyperlipidemia model. These results imply that COX7C has a protective effect against lipid-induced mitochondrial dysfunction and apoptosis, demonstrating its potential as a target for therapy for hyperlipidemia-related diseases such as atherosclerosis.
According to the hypoxia theory, arterial hypoxia plays an essential role in the development of plaque, with HIF-1α serving as a key sensor of intracellular oxygen levels [36]. Normal oxygen causes HIF-1α to break down quickly; nevertheless, it stabilizes and moves to the nucleus in hypoxic conditions, and activates target genes participating in angiogenesis, metabolism, and cell survival [37]. These adaptive responses help cells withstand hypoxic stress, ensuring tissue function under oxygen-deprived conditions [38]. Recent studies have highlighted HIF-1α’s critical involvement in cardiovascular diseases, particularly in linking hyperlipidemia, inflammation, and vascular dysfunction. Akhtar et al. reported that endothelial HIF-1α promotes atherosclerosis via upregulating miR-19a, enhancing monocyte adhesion and CXCL1 expression [39]. HIF-1α deletion led to reduced atherosclerotic lesions and macrophage accumulation, indicating its therapeutic potential. Similarly, Hutter et al. found that oxLDL activates HIF-1α in macrophages, promoting proangiogenic effects via VEGF induction [40]. HIF-1α inhibition reversed these effects, highlighting its role in connecting inflammation, angiogenesis, and hyperlipidemia in atherosclerosis. Moreover, Li et al. demonstrated that upregulation of HIF-1α enhances the cardioprotective effects of ischemic postconditioning in hyperlipidemic rats, reducing infarct size and injury markers [41]. Collectively, these studies emphasize HIF-1α’s crucial involvement in atherosclerosis and ischemia/reperfusion injury. Similarly, in our study, COX7C activated HIF-1α to mitigate FFA-induced mitochondrial damage, reduce apoptosis, and inhibit lipid accumulation in hyperlipidemia. Overexpression of COX7C restored mitochondrial morphology, ATP levels, and reduced ROS accumulation, while HIF-1α inhibition reversed these effects. Additionally, COX7C alleviated lipid droplet and cholesterol ester accumulation, preserving cell viability.
In conclusion, we determined in our investigation that COX7C is a key downregulated gene in familial hypercholesterolemia (FH) by bioinformatics analysis and demonstrated its functional significance in a hyperlipidemia-induced cell model. In FFA-induced HepG2 cells, overexpression of COX7C effectively attenuated lipid accumulation, preserved mitochondrial integrity, and improved cell viability. Mechanistically, overexpression of COX7C reduced ROS production, restored ATP levels, and inhibited apoptosis by upregulating Bcl-2 and downregulating Bax. Further, our findings indicate that COX7C exerts its protective effects in part by activating the HIF-1α signaling pathway. Together, these results offer fresh perspectives on the mitochondrial protective and anti-apoptotic roles of COX7C in hyperlipidemia, demonstrating its potential as a target for therapy for hyperlipidemia-related diseases, including atherosclerosis.
While our study provides valuable insights into the role of COX7C in hyperlipidemia and atherosclerosis, there are several limitations to consider. First, our study primarily used an in vitro cell model, which may not fully replicate the complex physiological and pathological conditions observed in vivo. Future studies should include in vivo animal models to validate our findings and further explore the therapeutic potential of COX7C. Second, the specific molecular mechanisms by which COX7C interacts with other mitochondrial proteins and signaling pathways in the context of hyperlipidemia remain to be elucidated. Further mechanistic studies are needed to fully understand the role of COX7C in lipid metabolism and mitochondrial function. Third, our study focused on the HIF-1α pathway, but other potential pathways and interactions that COX7C may modulate in hyperlipidemia have not been explored. Future research should investigate these additional pathways to provide a more comprehensive understanding of COX7C’s role in hyperlipidemia and atherosclerosis.
Building on the insights gained from our study, we plan to take several future steps to further explore the role of COX7C in hyperlipidemia and atherosclerosis. First, we intend to conduct in vivo studies using animal models of hyperlipidemia to validate the protective effects of COX7C observed in our cell-based model. These studies will help determine whether the therapeutic potential of COX7C can be translated from in vitro to in vivo settings. Second, we aim to conduct detailed mechanistic studies to elucidate the interactions between COX7C and other mitochondrial proteins, as well as its involvement in additional signaling pathways beyond HIF-1α. Understanding these interactions will provide a more complete picture of COX7C’s role in lipid metabolism and mitochondrial function. Third, we will explore the potential clinical implications of our findings by investigating the expression and activity of COX7C in clinical samples from patients with hyperlipidemia and atherosclerosis. This will help determine whether COX7C could serve as a biomarker or therapeutic target in these conditions.