

Introduction
Urological cancers, primarily comprising bladder, kidney, and prostate cancer, represent a significant and growing global health challenge [1]. Bladder cancer is the tenth most common cancer worldwide, while kidney and prostate cancer rank fourteenth and second, respectively, in global incidence. Despite advances in treatment, the prognosis for advanced-stage urological cancers remains poor, underscoring the urgent need to identify novel modifiable risk factors for prevention and early detection [2].
Immunoglobulin G (IgG) N-glycosylation is a critical post-translational modification that profoundly influences antibody structure and function, thereby modulating the immune response [3]. The composition of the IgG glycome is dynamic and can be altered by aging, environmental exposures, and various pathological states, including inflammatory diseases and cancer. Aberrant IgG glycosylation patterns, such as changes in galactosylation, sialylation, and fucosylation, have been shown to switch IgG function from anti-inflammatory to pro-inflammatory, a hallmark of cancer progression [3, 4]. Observational studies have linked specific glycan profiles with various malignancies, including gastric and esophageal cancers, suggesting their potential as biomarkers [5, 6]. While these associations are compelling, it remains unknown whether they are causal. This uncertainty arises because observational studies are inherently susceptible to confounding and reverse causation, making it difficult to establish a definitive etiological link between IgG N-glycosylation and cancer development. For instance, it is unclear whether altered glycosylation is a cause of urological cancers or merely a consequence of the disease process or its associated inflammation [7].
To address these limitations, we employed Mendelian randomization (MR), a framework that uses genetic variants as instrumental variables (IVs) to estimate the causal effect of an exposure on an outcome [8]. Since genetic variants are randomly allocated at conception, MR is less susceptible to confounding from environmental or lifestyle factors and less susceptible to reverse causation. This design strengthens causal inference in a manner analogous to a randomized controlled trial [9]. This approach has been used to investigate potential causal associations in various cancers, including the effects of smoking on bladder cancer and macrophage migration inhibitory factor (MIF) concentrations on prostate cancer [10, 11].
Therefore, this study leveraged a two-sample MR design to systematically investigate the potential causal relationships between 78 exposures, including 77 specific IgG N-glycan traits and total IgG levels, and the risk of bladder, kidney, and prostate cancers. By integrating large-scale genetic data, we aimed to explore the potential involvement of IgG glycosylation in the development of urological cancers, and to identify candidate biomarkers for further investigation.
Material and methods
Study design
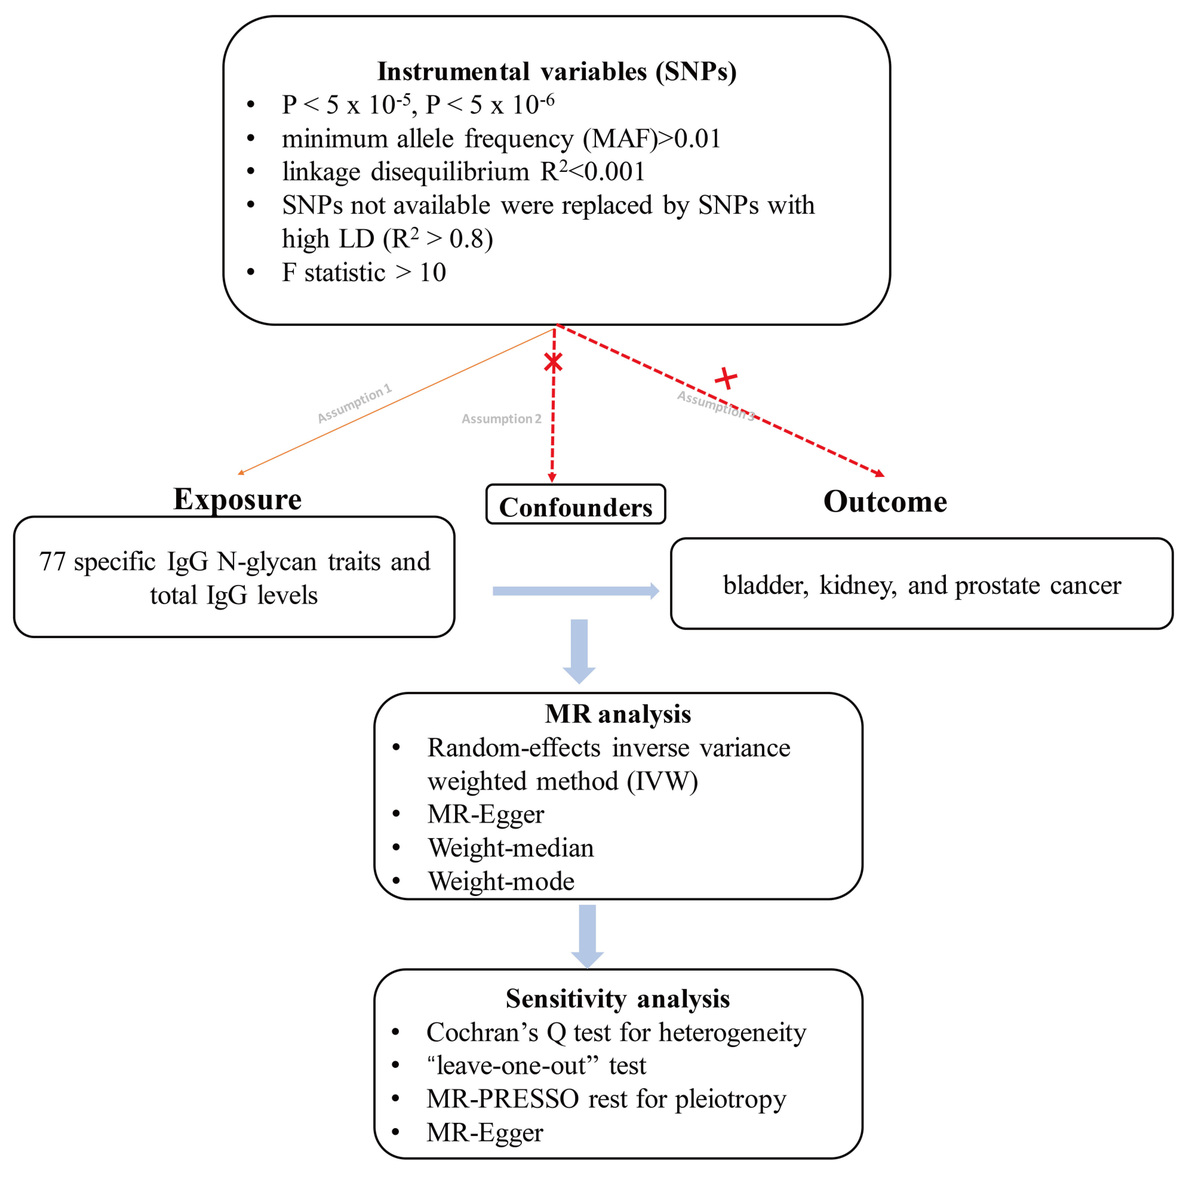
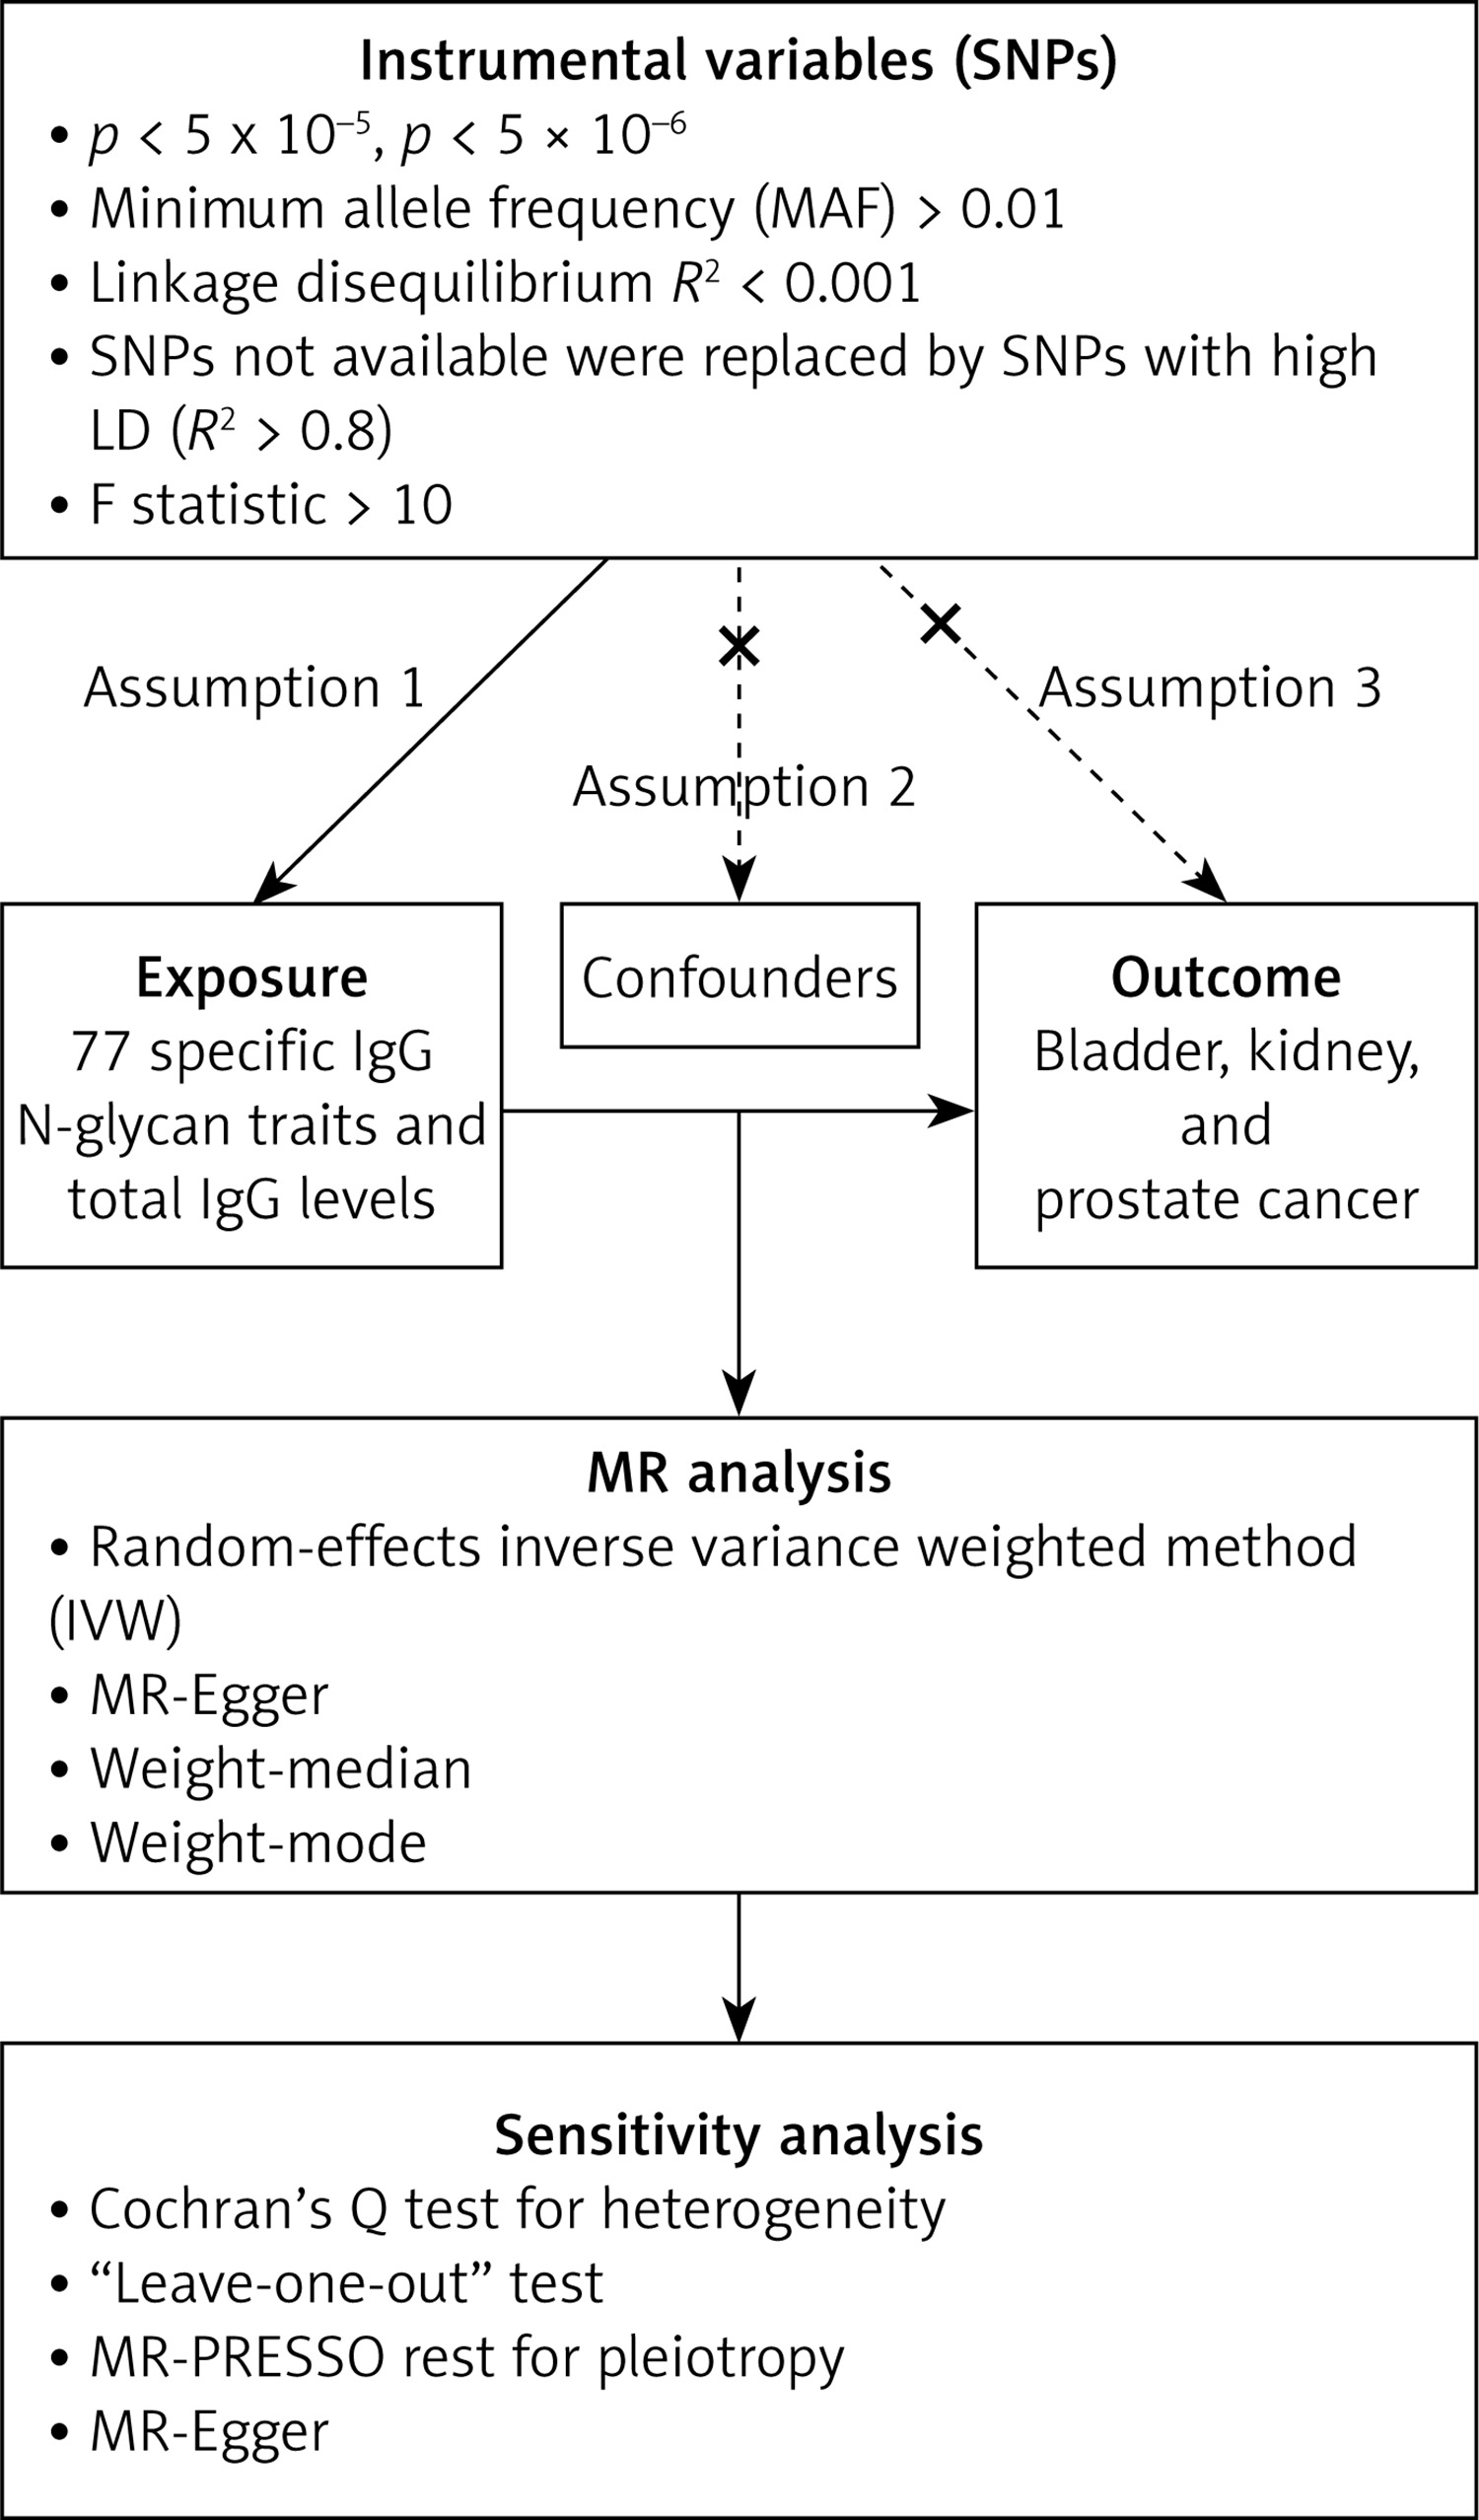
We employed a two-sample MR design to assess the potential causal associations of IgG N-glycosylation levels with the risk of bladder, kidney, and prostate cancers. This approach uses summary-level data from non-overlapping genome-wide association studies (GWAS) for the exposure (IgG N-glycans) and the outcomes (urological cancers). The validity of our MR analysis relies on three core assumptions [12]: (i) the genetic variants used as instrumental variables (IVs) are robustly associated with the exposure; (ii) the IVs are not associated with any confounders of the exposure-outcome relationship; and (iii) the IVs affect the outcome only through the exposure. A flowchart of the study design is presented in Figure 1.
Data sources
Summary-level GWAS data for the exposure were obtained from two main sources. Data for 77 specific IgG N-glycan peak (IGP) traits were obtained from a study published in Science Advances [4], which included 8,090 individuals of European ancestry. For total IgG levels, data were sourced from a separate GWAS of 1,000 individuals in the EBI GWAS Catalog (ebi-a-GCST006357). GWAS summary statistics for the outcomes were obtained from the FinnGen consortium (Release 12, FinnGen: an expedition into genomics and medicine | FinnGen), which includes individuals of Finnish ancestry. Specifically, we used data for bladder cancer (GWAS ID: C3_BLADDER_EXALLC; 4,852 cases and 378,749 controls), prostate cancer (GWAS ID: C3_PROSTATE_EXALLC; 20,368 cases and 156,671 controls), and kidney cancer (excluding renal pelvis cancer; GWAS ID: C3_KIDNEY_NOTRENALPELVIS_EXALLC; 3,926 cases and 378,749 controls).
Instrumental variable selection
To satisfy the first MR assumption, we selected single-nucleotide polymorphisms (SNPs) as IVs using stringent criteria [13]. First, SNPs associated with each IgG N-glycan trait at a significance level of p < 5 × 10⁻⁶ were selected. For total IgG levels, due to an insufficient number of SNPs at this threshold, the standard was relaxed to p < 5 × 10⁻⁵ [14, 15]. Second, to ensure the independence of IVs, we performed linkage disequilibrium (LD) clumping using the 1000 Genomes Project European reference panel [16], with a strict R2 threshold of < 0.001 and a clumping window of 10,000 kb. Third, SNPs with a minor allele frequency (MAF) of less than 0.01 were excluded. When an IV was not available in the outcome GWAS, a proxy SNP with high LD (R2 > 0.8) was used as a substitute. Finally, the strength of each IV was evaluated using the F-statistic, calculated as F = R2 × (N – 2)/(1 – R2), where R2 is the proportion of variance in the exposure explained by the SNP and N is the sample size of the exposure GWAS. IVs with an F-statistic < 10 were excluded to minimize weak instrument bias [17]. Detailed characteristics of the selected IVs, including their F-statistics and any proxy SNP substitutions, are presented in Supplementary Table SI. The Steiger test for directionality (comparison of variance explained) was used to assess causal direction and reduce the possibility of reverse causation between IgG N-glycosylation levels and urological cancers.
MR analysis
The primary MR analysis was conducted using the random-effects inverse-variance weighted (IVW) method [18], supplemented by the weighted median and MR-Egger methods as complementary analyses. To assess the robustness of our findings, we performed several sensitivity analyses. Heterogeneity among the IVs was assessed using Cochran’s Q statistic [19]. The MR-Egger intercept test was used to detect directional pleiotropy [19]. Additionally, the MR-Pleiotropy RESidual Sum and Outlier (MR-PRESSO) test [19, 20] and a leave-one-out analysis were performed to identify the influence of potential outlying SNPs [21]. MR-RAPS was performed to maximize the profiled likelihood of the Wald ratio (or ratio estimate) while accounting for weak instrument bias, pleiotropy, and extreme outliers. All statistical analyses were conducted using the “TwoSampleMR” package in R (version 4.0.5).
A multi-step analysis was implemented to ensure the reliability of the results. First, an initial analysis was performed for all exposure-outcome pairs (Supplementary Tables SIII–SV). Subsequently, we identified and removed outlying SNPs (Supplementary Table SVI) before conducting the final analyses. After removing these outliers, a second round of MR and sensitivity analyses was conducted, with the full results for all traits presented in Supplementary Tables SVII–SIX. To account for multiple comparisons, we calculated the false discovery rate (FDR) separately for each of the three cancer outcomes across all 78 exposures. We defined nominal significance as a p-value < 0.05 and statistical significance as an FDR-adjusted p-value < 0.05 within each cancer type.
Results
Instrumental variable selection and characteristics
After a rigorous selection process, a set of valid instrumental variables (IVs) was identified for each of the 78 exposures. The number of SNPs for each IGP trait ranged from 3 to 21. As detailed in Supplementary Table SI, the F-statistics for all selected IVs ranged from 20.8 to 1165.4, all substantially greater than the conventional threshold of 10, indicating that the selected instruments were strong and the risk of weak instrument bias was minimal. The full list of SNPs used as IVs in this study is provided in Supplementary Table SII.
MR analysis and outlier correction
We conducted a multi-step MR analysis to ensure the robustness of our findings. An initial round of analyses was performed on all selected IVs to assess potential associations (Supplementary Tables SIII–SV). Subsequently, MR-PRESSO and leave-one-out analyses were employed to detect potential pleiotropic outliers. Several outlying SNPs were identified across different exposure-outcome pairs (Supplementary Table SVI). These SNPs were then removed from subsequent analyses to mitigate the risk of pleiotropic bias.
Causal associations after outlier correction
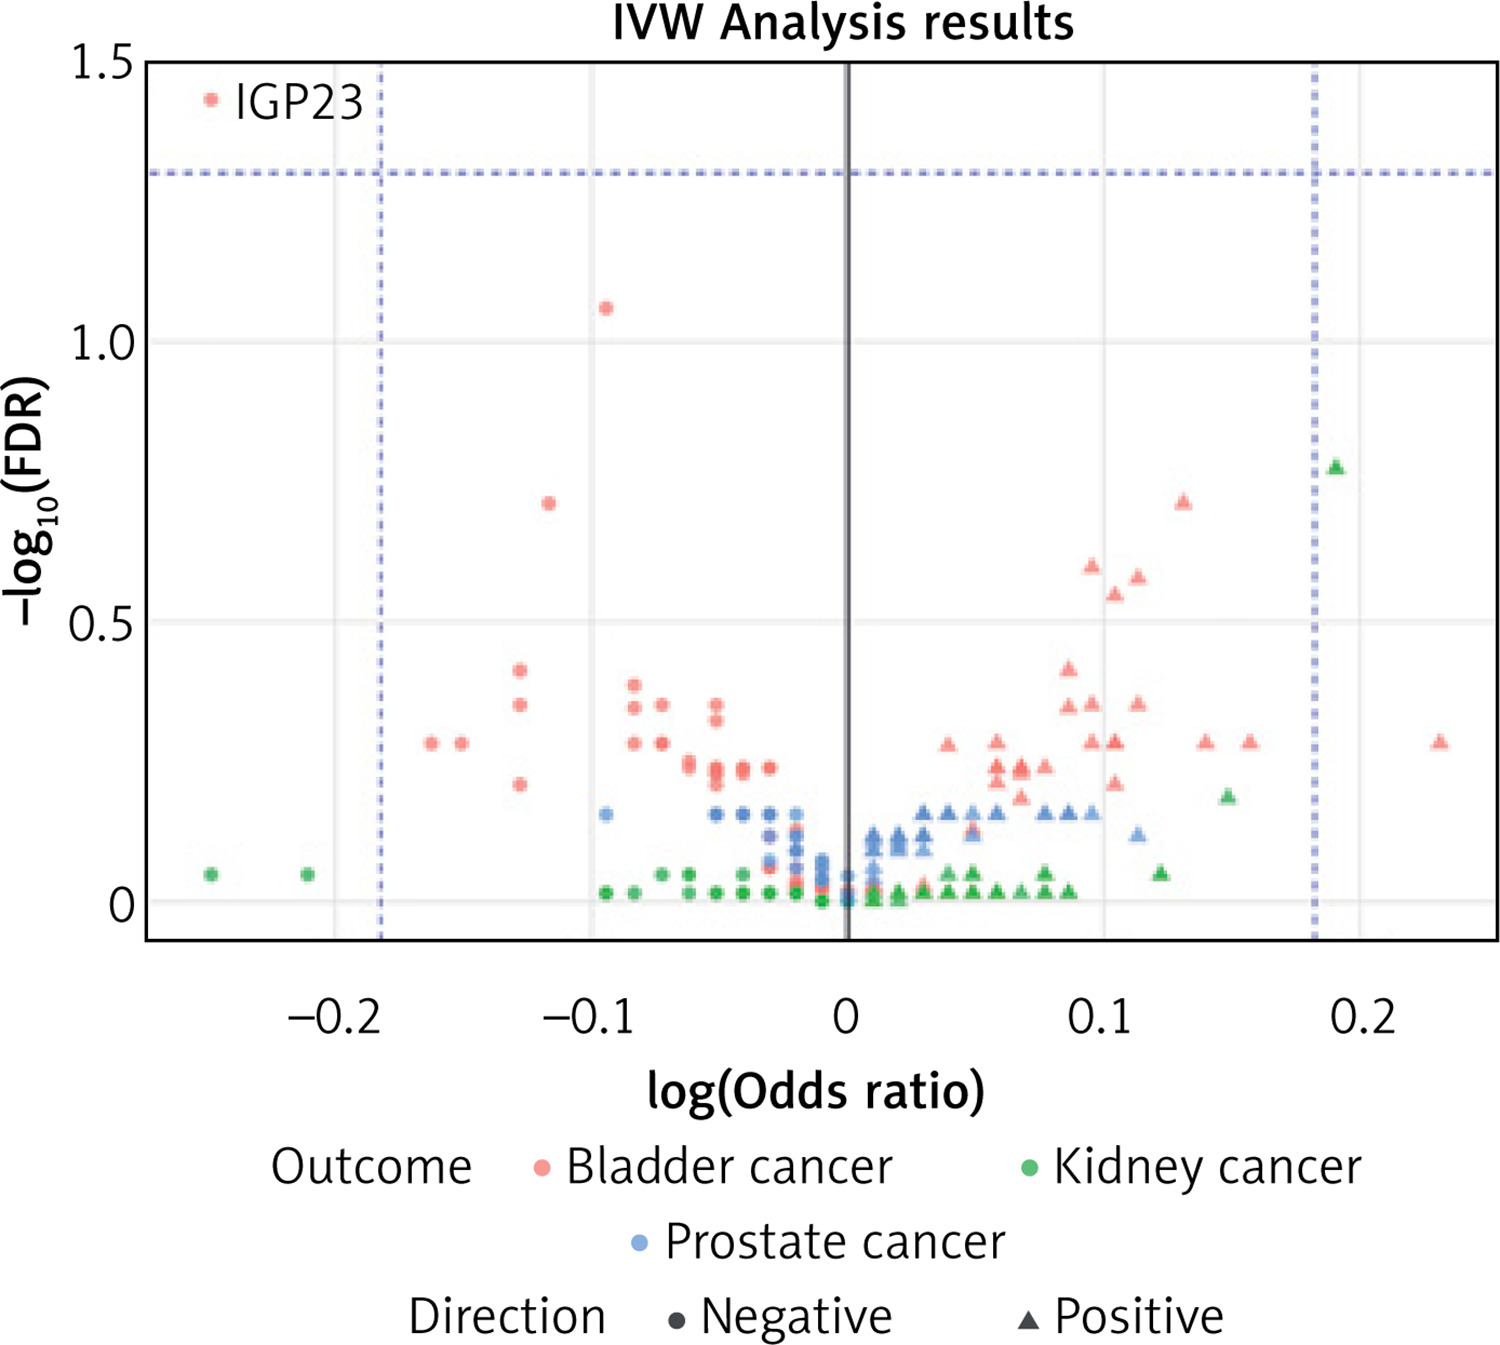
After the removal of outlying SNPs, the final IVW analysis identified 14 potential causal associations (p < 0.05) between specific IgG N-glycan traits and the risk of urological cancers. A comprehensive summary of these top findings, including results from all sensitivity analyses, is presented in Table I. These primary associations are also illustrated in the forest plot in Figure 2 and Table II, while the overall landscape of all associations is visualized in the volcano plot (Figure 3). After applying the FDR correction, two distinct types of significant associations were noted. Primarily, using the IVW method, genetically predicted higher levels of IGP23 were significantly associated with a decreased risk of bladder cancer (OR = 0.78, 95% CI: 0.67–0.90, p = 4.7e-04, FDR = 0.037). Notably, while they did not pass FDR correction in the primary IVW analysis, the associations for IGP52 and IGP73 with kidney cancer risk did remain statistically significant after FDR correction when using the weighted median method (FDR = 0.0499 for both), suggesting these as strong candidates for further investigation. The other 13 associations, while nominally significant in the IVW analysis, did not withstand FDR correction. These associations suggested that for bladder cancer, higher levels of several IGPs were potential risk factors (IGP35, IGP58, IGP62, IGP63, and IGP72), while others were potential protective factors (IGP2, IGP11, and IGP42). For kidney cancer, higher levels of IGP7, IGP52, and IGP73 were identified as potential risk factors. For prostate cancer, higher levels of IGP10 and IGP33 were identified as potential risk factors (Supplementary Figure S1–S3).
Table I
Summary of main findings: nominally significant causal associations between IgG N-glycan traits and urological cancers (IVW p < 0.05)
Figure 2
Forest plot of potential causal associations. The plot displays the odds ratios (ORs) and 95% confidence intervals from the primary inverse-variance weighted (IVW) analysis for the 14 nominally significant associations between IgG N-glycan traits and the risk of bladder, kidney, and prostate cancer
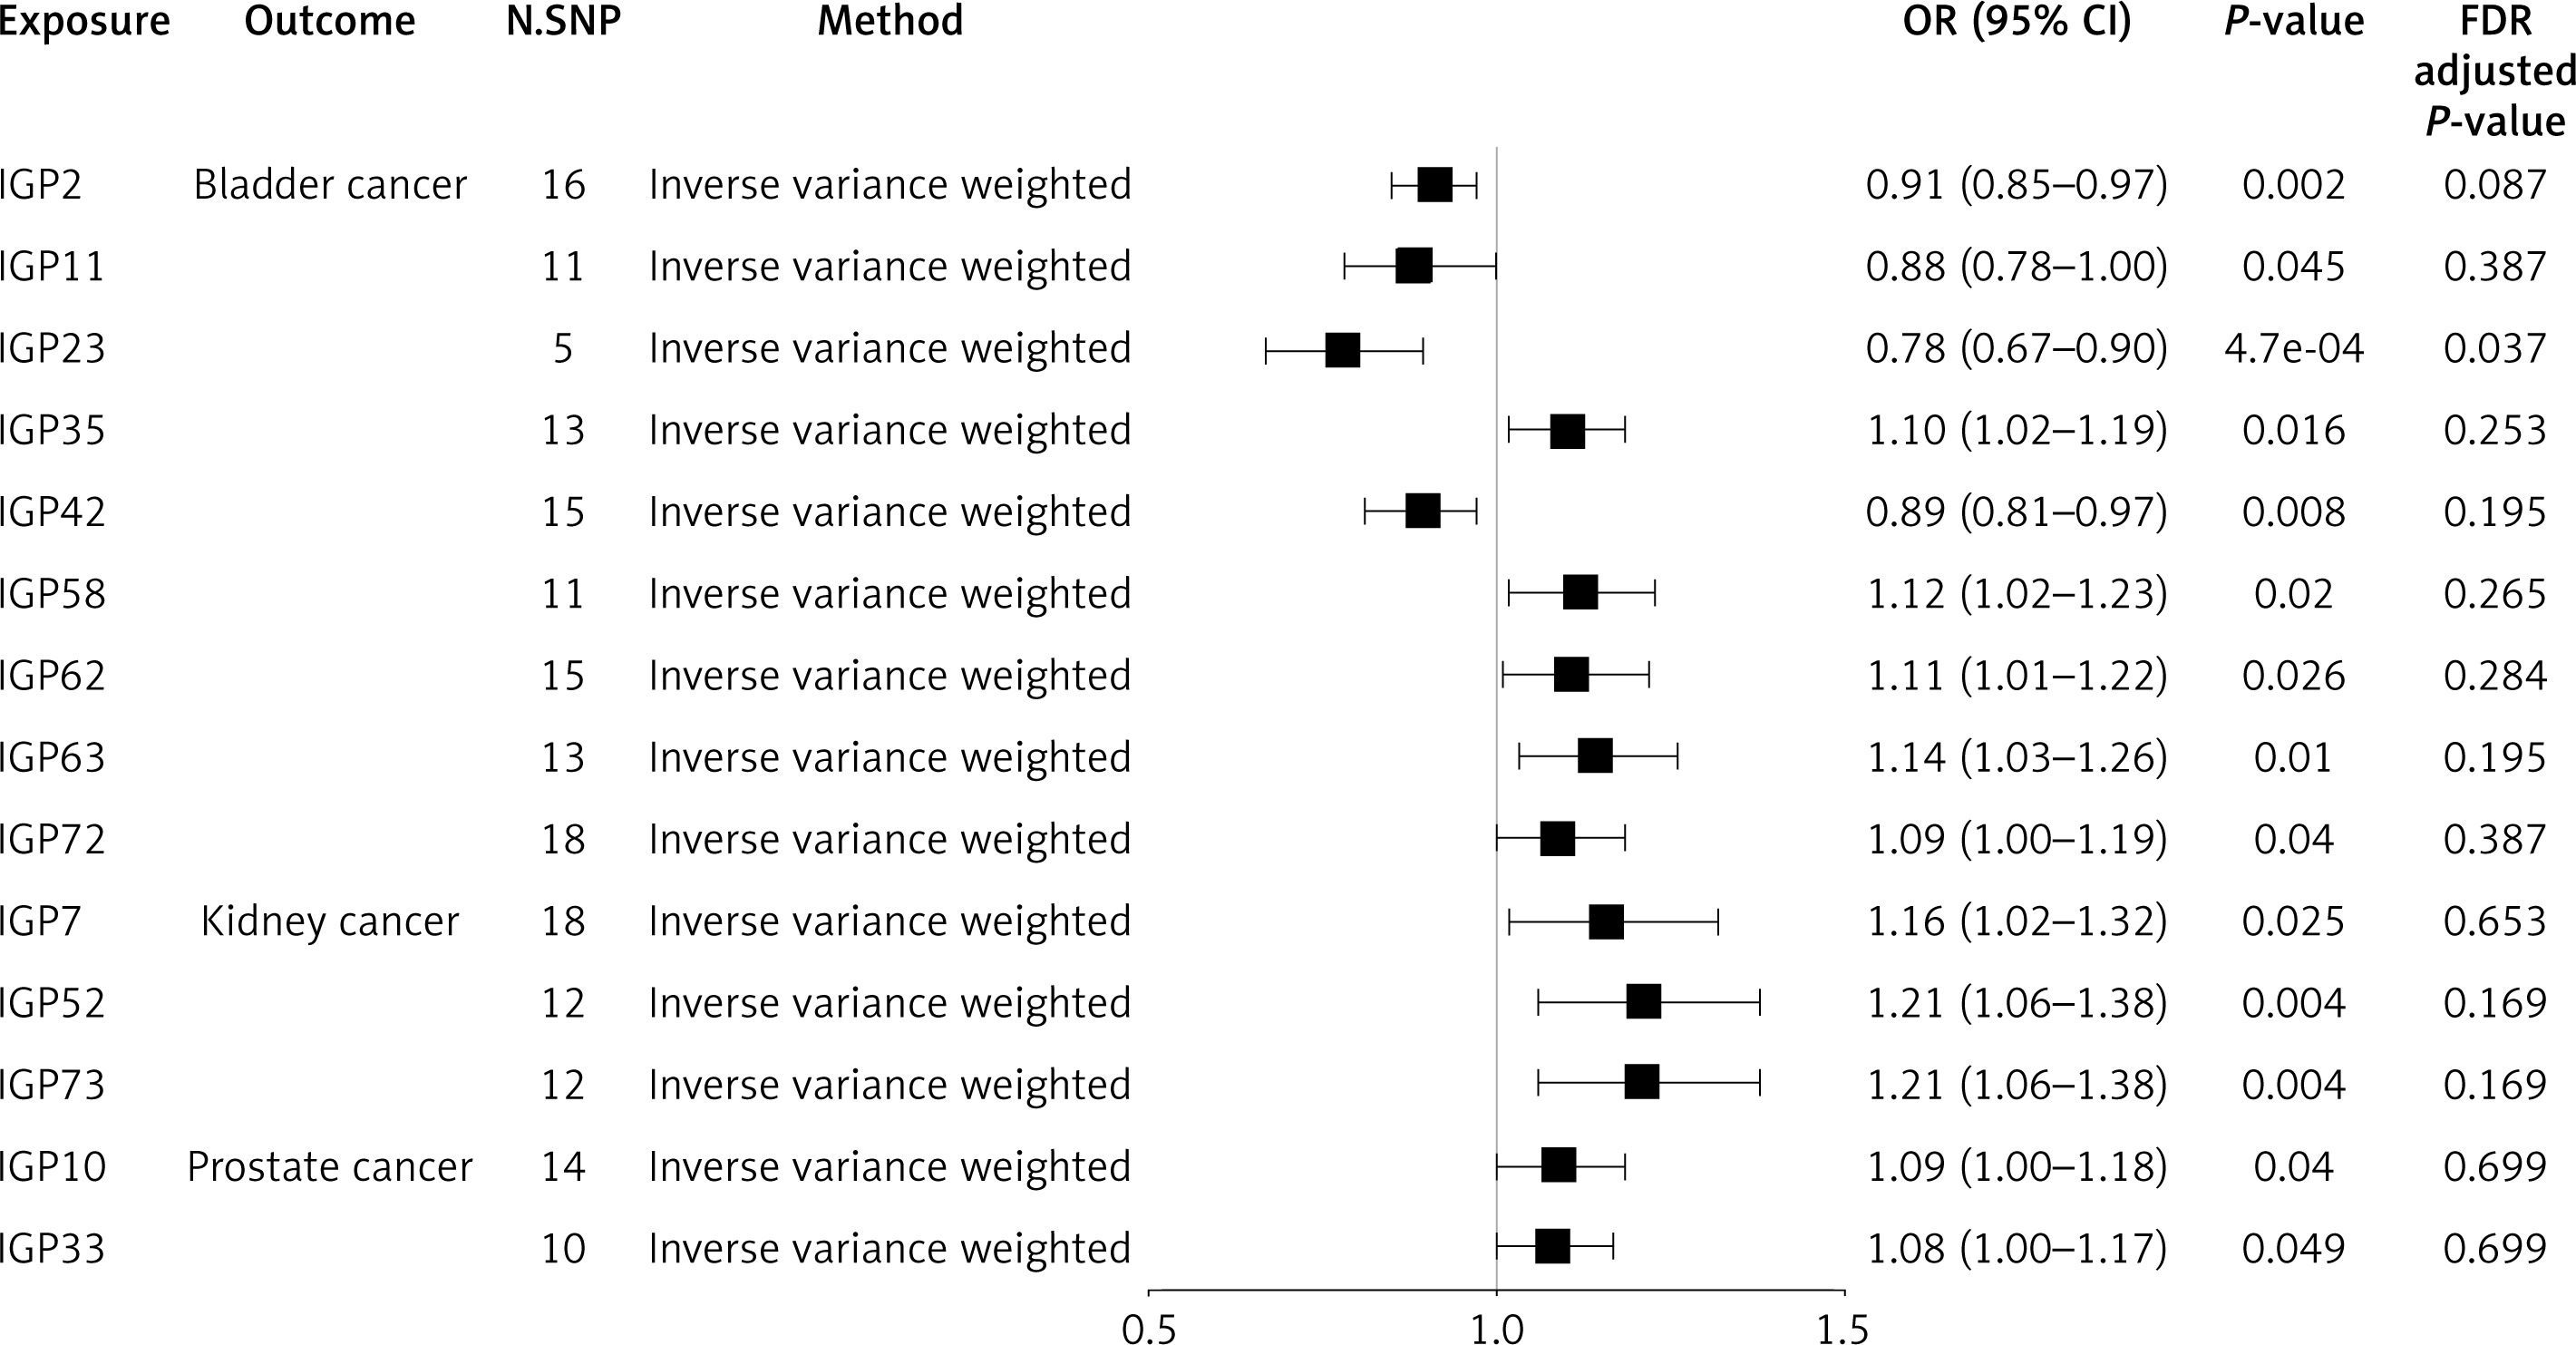
Table II
MR estimates of IgG N-glycan traits and urological cancers across different MR methods after outlier correction
Figure 3
Volcano plot for inverse variance weighted analyses. The plot displays the effect sizes (log[OR]) versus statistical significance (-log10[FDR]) for all 78 exposures across the three urological cancers. The significant association (IGP23 with bladder cancer) is highlighted, showing its strong effect size and statistical significance
Sensitivity analyses and multiple testing correction
The robustness of these 14 nominal associations was further examined. Sensitivity analyses did not detect significant directional pleiotropy, as indicated by the MR-Egger intercept test (Table III), and the MR-PRESSO analysis found no significant outliers remaining after correction, confirming the stability of these estimates (Table IV). Full results of the final sensitivity analyses are presented in Supplementary Tables SVII–SIX. The Steiger analysis supported the correct causal directionality for all associations (Supplementary Table SX). Additionally, the MR-RAPS analysis, which is robust to weak instruments and pleiotropy, yielded similar results (Supplementary Table SXI). The post-hoc power analysis is presented in Supplementary Table SXII.
Table III
Sensitivity analysis results for significant associations, including the MR-Egger intercept test
Table IV
MR-PRESSO analysis results for the identified significant causal associations
Discussion
In this comprehensive two-sample MR study, we explored the potential causal relationships between specific IgG N-glycan traits and the risk of bladder, kidney, and prostate cancers. By leveraging large-scale GWAS data, our findings move beyond previously reported observational associations to investigate these links from a genetic standpoint. Our analysis identified several key associations that remained significant after strict correction for multiple testing. The primary analysis provided evidence of a statistically significant protective association between the IgG N-glycan trait IGP23 and the risk of bladder cancer. Furthermore, weighted median analysis identified two additional significant associations: higher levels of IGP52 and IGP73 were associated with an increased risk of kidney cancer. While the majority of the initial nominal associations did not survive false discovery rate correction, these findings provide supportive evidence for future research into their potential as biomarkers and therapeutic targets (Supplementary Table SXIII).
A key finding of our study is the genetic evidence suggesting a potential protective role of IGP23 against bladder cancer. IGP23 represents the G2FNS2 glycan structure, which is a digalactosylated, fucosylated, and bisialylated glycan. The presence of two sialic acid residues is particularly noteworthy. Sialylation of IgG is widely recognized as a critical modification that enhances its anti-inflammatory properties, primarily by increasing the affinity for inhibitory FcγRIIb receptors and modulating interactions with other immune components [22]. The protective association we observed suggests that a genetically predisposed increase in these highly sialylated structures could contribute to a less inflammatory microenvironment within the bladder. This is particularly intriguing, as chronic inflammation is a well-established driver of bladder carcinogenesis [23]. By promoting an anti-inflammatory state, higher levels of IGP23 might hinder tumor initiation and progression. This finding stands in contrast to the observed risks associated with increased fucosylation in other IGPs within our bladder cancer analysis, highlighting the complex and often opposing roles that different glycan modifications can play in cancer biology. The protective signal from IGP23 underscores the importance of sialylation and suggests that specific, complex glycan structures, rather than broad glycosylation patterns, may be key determinants of cancer risk.
Our findings on bladder cancer point to a complex interplay between agalactosylation and fucosylation. Contrary to the typical pro-inflammatory role of agalactosylated (G0) glycans, we found that lower levels of G0 glycans (represented by IGP2 and IGP42) were associated with a higher bladder cancer risk, a finding that is particularly intriguing given the link between elevated G0 levels and other diseases [7, 24]. This suggests a context-dependent protective role for IgG agalactosylation in the bladder microenvironment. Conversely, we observed that increased fucosylation (IGP35, IGP58, IGP62, IGP63, IGP72) was associated with a higher risk. This may be partly explained by evidence that core fucosylation can modulate antibody-dependent cell-mediated cytotoxicity (ADCC), an important anti-tumor immune mechanism [4]. For kidney cancer, our study identified IGP52 and IGP73 as significant risk factors. Both traits, related to digalactosylated structures, may reflect a pro-inflammatory state of IgG linked to processes such as renal macroangiopathy [25]. This is especially noteworthy as IgG N-glycan profiles exhibit significant gender dimorphism [26], which may provide a mechanistic link to the known gender disparity in kidney cancer incidence [27].
In the context of prostate cancer, higher levels of IGP10 and IGP33 were associated with an increased risk. This aligns with previous evidence that altered glycosylation is a feature of prostate cancer progression [28] and can contribute to an immunosuppressive tumor microenvironment. Notably, the identification of IGP33 as a potential pan-cancer risk factor [6] and the broader evidence for glycomics in risk stratification [9] underscore the significance of these findings.
Recent evidence indicates that IgG N-glycosylation plays a significant role in the pathogenesis, diagnosis, and molecular profiling of urological cancers, including bladder, prostate, and upper urinary tract urothelial carcinomas. Altered IgG glycosylation patterns have been reported to correlate with tumor progression, inflammatory markers, and other molecular features relevant to urologic oncology. Aberrant N-glycosylation of serum immunoglobulins has been proposed as a potential biomarker for urothelial carcinoma (UC). A study of 237 UC patients identified five UC-associated IgG N-glycans, including the accumulation of asialo-bisecting GlcNAc glycans. The derived diagnostic N-glycan score (dNGScore) achieved 92.8% sensitivity and 97.2% specificity (AUC = 0.969), surpassing urine cytology and hematuria for UC detection. Notably, this signature also distinguished UC from prostate cancer and healthy controls, demonstrating its specificity for urological malignancy [29, 30]. In prostate cancer, mass spectrometry analyses revealed that the loss of terminal hexose residues on IgG N-linked glycans was strongly associated with tumor progression. This change indicates reduced sialylation or galactosylation and correlates with disease stage and malignancy severity. Altered IgG glycan patterns differentiated malignant from benign prostatic conditions and healthy states, suggesting their utility as noninvasive serum markers [31, 32]. A 2023 study constructed a glycosylation-based risk score for bladder cancer using multi-omics cohorts. This “glycosylation risk score” correlated with tumor microenvironment remodeling, increased immune cell infiltration, and elevated activity in immune response pathways, including interferon, antigen processing, and T-cell activation. Patients with high glycosylation risk scores demonstrated poorer prognoses and stronger immunotherapy responsiveness, linking glycosylation to molecular subtypes and immune modulation [33]. High-throughput and canonical correlation analyses have reported associations between IgG N-glycosylation patterns and other systemic markers, including inflammatory cytokines and tumor-related proteins. Specifically, profiles rich in bisecting GlcNAc or reduced galactosylation reflect chronic inflammation common to tumor microenvironments, supporting their integrative role alongside CRP, IL-6, and tumor-associated antigens [33, 34]. Hence, profiling IgG N-glycosylation could offer both diagnostic and prognostic insight and complements other markers in precision oncology for urological malignancies.
The strengths of our study include its two-sample MR design, which minimizes confounding and reverse causation, the use of large-scale GWAS data, and the comprehensive assessment of 77 distinct glycan traits. In addition, there was no overlap between the exposure and outcomes datasets. The robustness of our nominal findings was supported by multiple sensitivity analyses that showed no evidence of significant directional pleiotropy. However, several limitations must be acknowledged. First, and most importantly, none of the identified associations survived a strict FDR correction for multiple testing, which limits the strength of causal inference that can be drawn from this study. From a biological interpretation perspective, this stringent correction may reduce the ability to detect modest associations and may overlook weaker signals that could warrant further investigation. Therefore, these nominal IVW results should be interpreted as exploratory rather than definitive causal evidence, and may serve to generate hypotheses for future functional studies. Second, while our sensitivity analyses did not detect known forms of pleiotropy, we cannot entirely rule out the potential influence of unknown, balanced horizontal pleiotropy, where genetic variants might affect the outcome through pathways independent of the exposure. Third, our GWAS outcome data were sourced from the FinnGen consortium, which, although of European descent, has a unique genetic background. This potential population heterogeneity between the exposure and outcome cohorts might have subtly influenced the causal estimates. Fourth, the GWAS data were predominantly from individuals of European ancestry, which may limit the generalizability of our findings to other populations. Fifth, adjusting the IV selection threshold in MR from the conventional genome-wide significance level of p < 5 × 10⁻⁸ to more lenient thresholds such as p < 5 × 10⁻⁶ or p < 5 × 10⁻⁵ is generally not ideal but can be justified under specific practical constraints, particularly when exposure GWASs lack sufficient significantly associated variants to produce adequately powered MR estimates [14, 15]. Although it increases the risk of weak instrumental bias, the F-values in the present study were all > 10, suggesting that the selected IVs remained sufficiently strong. Nevertheless, the need to adjust the thresholds also highlights the need for additional, more refined datasets encompassing more SNPs. Finally, we were unable to stratify our analyses by cancer stage or subtype, which may obscure more nuanced relationships. Additionally, future studies employing multivariable MR could help to disentangle the specific effects of IgG N-glycans from the broader influence of systemic inflammation.
In conclusion, this MR study provides a comprehensive exploration of the potential associations of 77 IgG N-glycan traits with the development of urological cancers. Although most associations did not withstand correction for multiple testing, our analysis highlights several distinct, cancer-specific glycan profiles that are nominally associated with disease risk. Notably, IGP23 was the only association to remain significant in our primary analysis after a strict false discovery rate correction, suggesting an inverse association with bladder cancer risk. Furthermore, consistent associations were observed for IGP52 and IGP73 as potential risk factors for kidney cancer. These exploratory findings suggest that altered fucosylation, galactosylation, and sialylation may reflect underlying biological processes relevant to urological malignancies. The specific IGPs identified here, particularly IGP23, IGP52, and IGP73, should be viewed as promising candidates for future mechanistic investigation to elucidate their underlying biological roles.

