

Introduction
Neurodegenerative diseases (NDDs) represent a grave threat to global health, characterized by the progressive loss and degeneration of neurons across diverse nervous system regions, which ultimately culminate in neurological dysfunction [1]. Classically, neurodegenerative diseases (NDDs) refer to disorders such as Alzheimer’s disease (AD), Parkinson’s disease (PD), and amyotrophic lateral sclerosis (ALS) [1]. Although multiple sclerosis (MS) is primarily classified as an autoimmune demyelinating disorder, it entails substantial secondary neurodegeneration, characterized by progressive axonal loss and widespread brain atrophy, which are major determinants of permanent disability [2, 3]. Given our study’s focus on genetically predicted brain structural alterations, we included MS alongside classic NDDs to investigate potential shared causal pathways driving structural brain damage across these major neurological conditions. Clinically, NDDs are associated with extensive neurological damage, often presenting with motor dysfunction and cognitive decline [4, 5]. With the aging global population, the incidence of NDDs has been rising rapidly. Aging, as an inevitable biological process, exerts profound influences on the pathogenesis of NDDs [6]. Substantial evidence indicates that aging induces a series of structural and functional brain alterations, including cerebral atrophy, reduced neuronal connectivity, and neurotransmitter imbalance. These changes render neurons more vulnerable to damage and significantly increase the risk of NDDs [7]. Indeed, aging has emerged as a critical risk factor for NDDs. The age-related increase in disease risk imposes significant burdens on individuals, families, and society at large, making NDDs a major global health challenge [8].
Despite significant advancements in NDD research, the precise pathogenesis of these disorders remains incompletely understood. As the central organ of the nervous system, the brain plays a pivotal role in NDD development. Neuroimaging investigations have revealed distinct patterns of regional brain atrophy in affected individuals, including hippocampal volume reduction in AD linked to cognitive impairment, degeneration of the substantia nigra pars compacta in PD contributing to motor dysfunction, and corpus callosum white matter integrity decline in MS [9–11]. However, traditional observational studies are limited in their ability to elucidate causal relationships between NDDs and cerebral structural alterations, failing to determine whether these morphological changes represent initiating factors in disease pathogenesis or secondary manifestations following neuronal degeneration. Recent breakthroughs in inter-organ crosstalk research have opened new dimensions for investigating NDD mechanisms. Emerging Mendelian randomization evidence suggests potential causal relationships between structural characteristics of specific brain regions, their gene expression profiles, and sarcopenia, supporting the brain–muscle axis hypothesis and offering insights into systemic biological processes relevant to neurodegenerative disorders [12]. However, the causal chronology underlying this bidirectional regulatory mechanism remains a central scientific controversy: whether structural remodeling in the central nervous system drives peripheral organ pathology, or whether molecular signaling from peripheral organs accelerates cerebral degenerative changes. Elucidating these mechanisms is challenging, as clinical intervention trials are often unfeasible or ethically constrained, while conventional cohort studies are limited by confounding factors (e.g., multisystem comorbidities, polypharmacy effects) and reverse causality bias.
Mendelian randomization (MR) is a widely used methodological framework that helps address limitations of observational studies in causal inference. Grounded in genetic epidemiological principles, MR employs heritable genetic variants as instrumental variables to estimate causal effects. This approach reduces confounding and reverse causation that commonly affect conventional observational studies, thereby providing a statistical framework for investigating potential causal relationships across biological systems [13]. In neuroscience, MR has been applied to investigate relationships between serum biomarkers, environmental factors, brain structure, and brain disorders [14, 15]. For example, MR studies have reported evidence supporting causal relationships between educational attainment, brain structural reserve, and AD [16, 17]. However, the potential of MR to investigate causal relationships between intrinsic brain organ characteristics and NDDs remains underexplored. This study employed MR analysis to assess potential causal associations among brain structure, region-specific gene expression patterns, and four major categories of NDDs. The research aimed to investigate genetically inferred relationships between the brain and NDDs in the context of aging, thereby contributing to a better understanding of disease mechanisms and the genetic architecture underlying NDDs. This work provides evidence-based insights into potential biological pathways relevant to NDDs in aging populations.
Material and methods
Study design
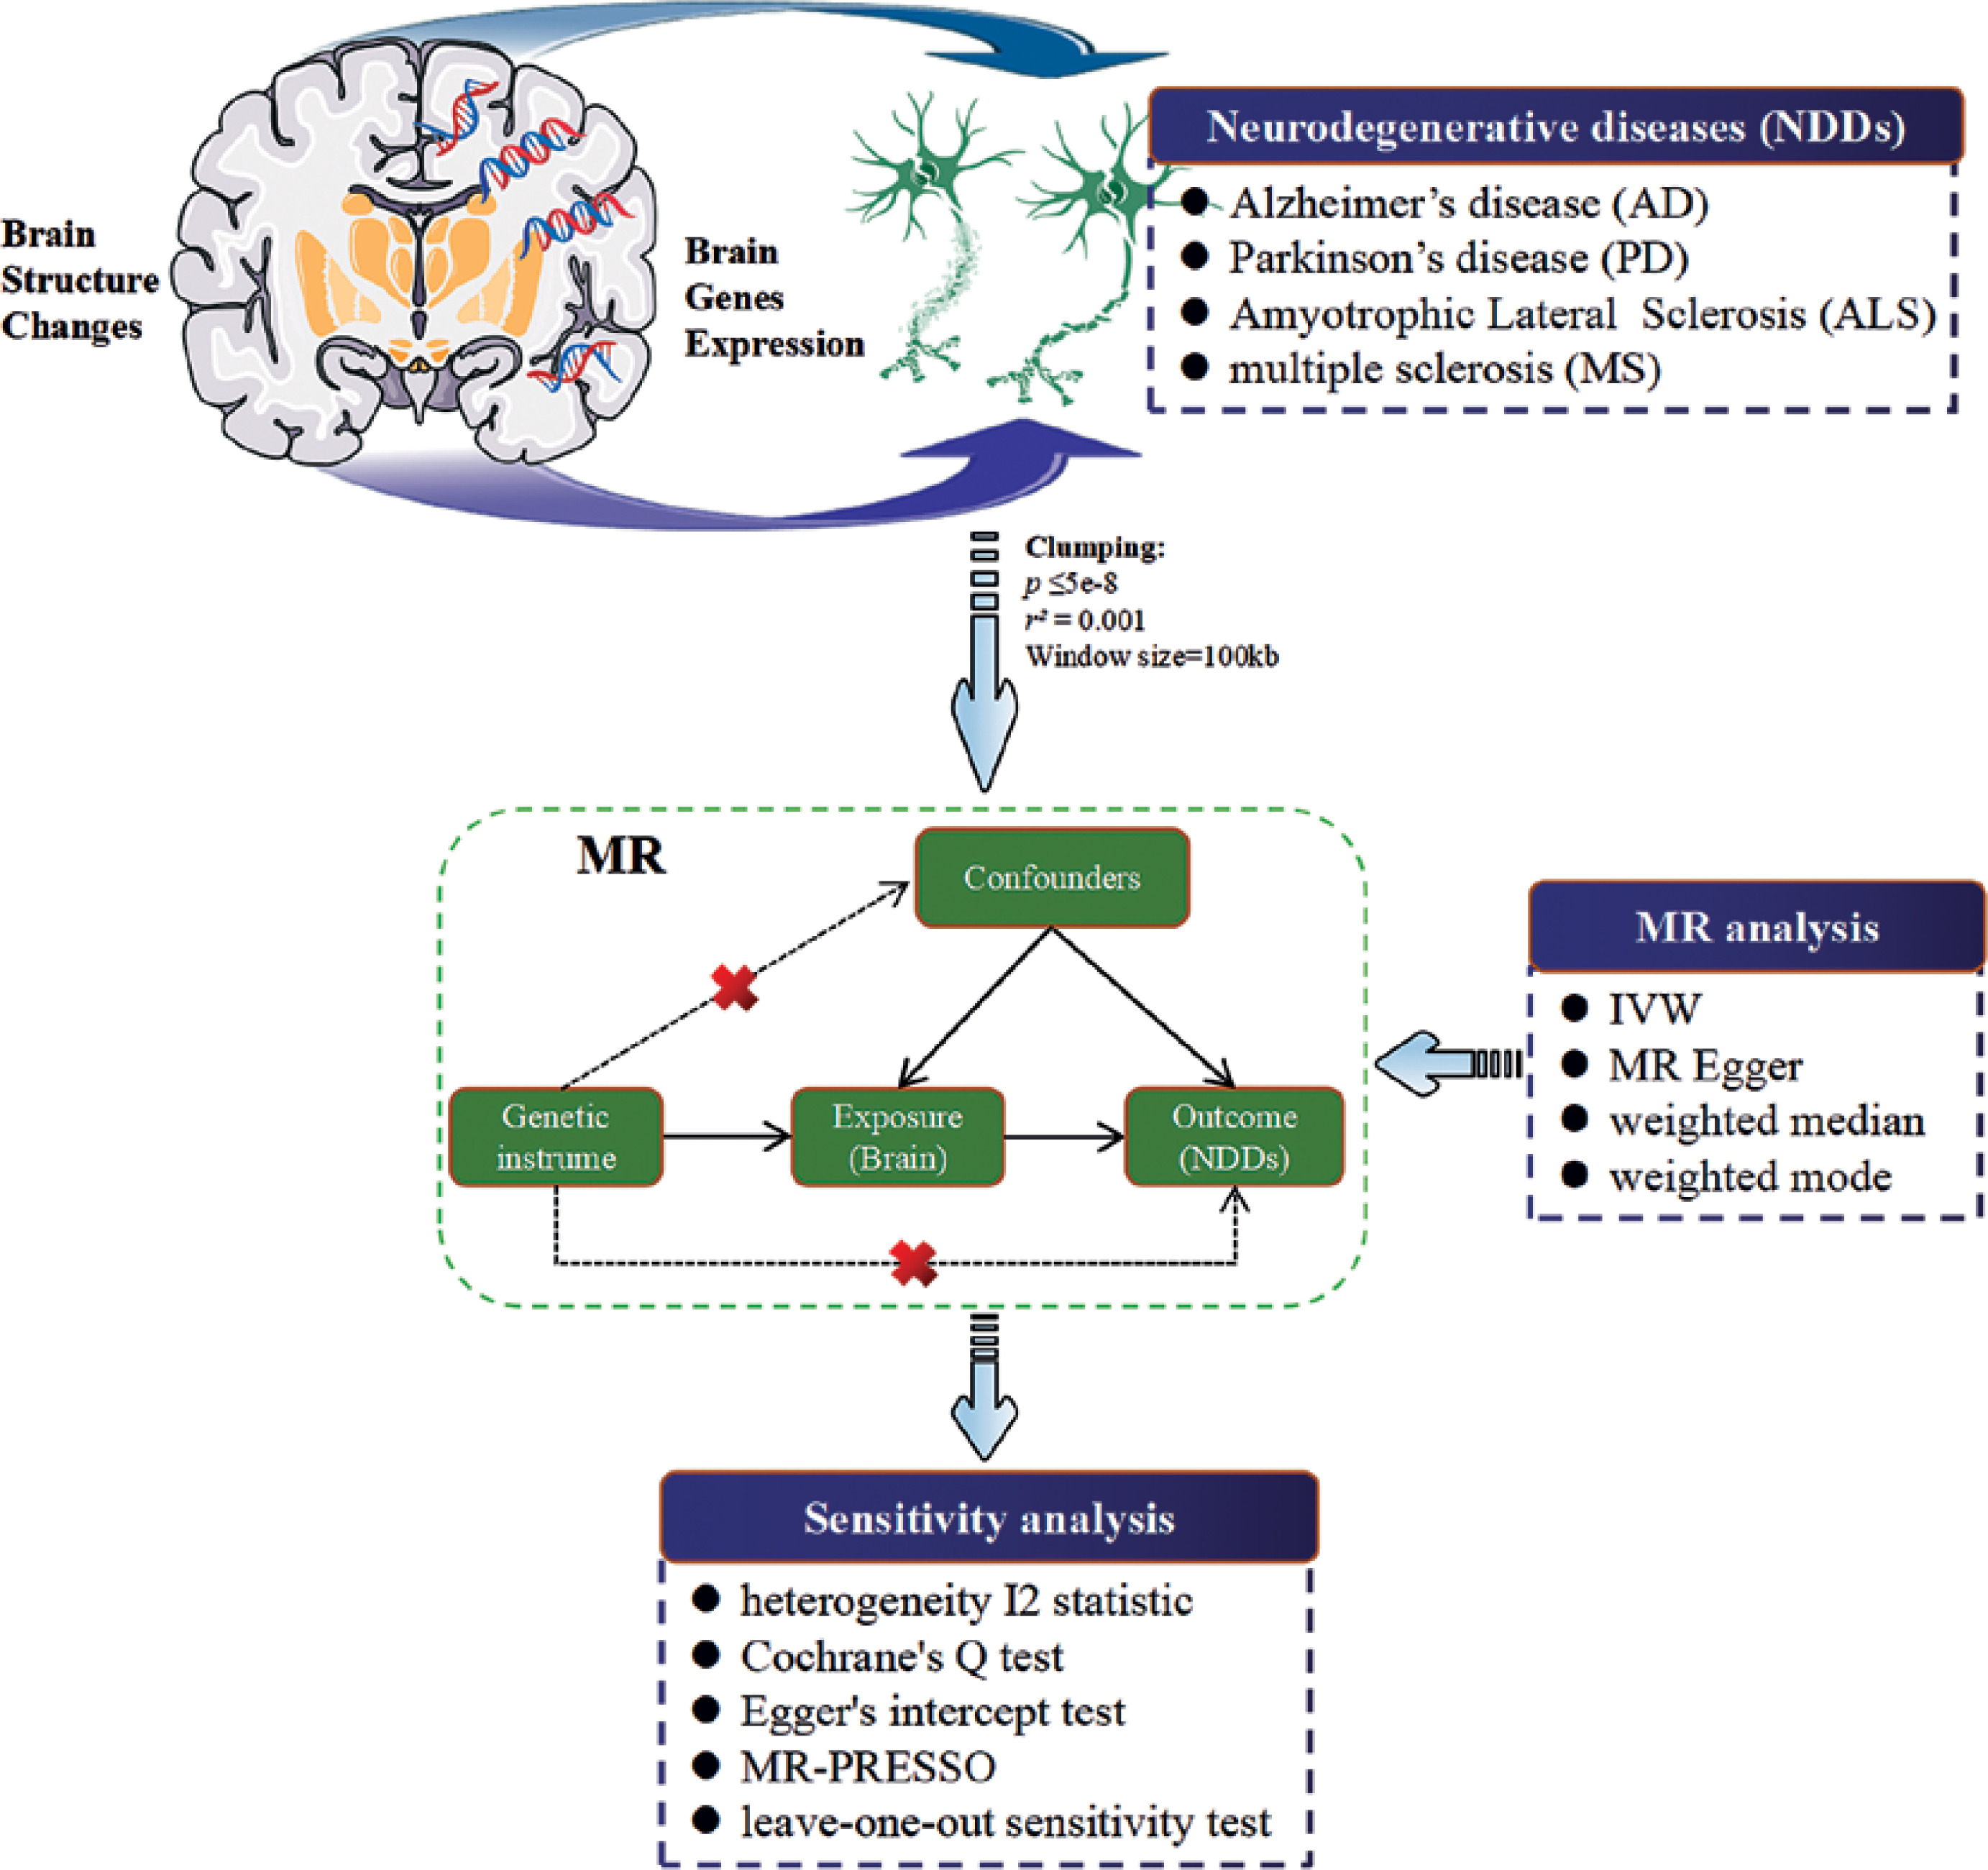
Figure 1 illustrates the comprehensive framework of our study design. Using MR methodology, this research investigated potential causal relationships between brain structure, gene expression profiles in 13 specific brain regions, and four neurodegenerative diseases: AD, PD, ALS, and MS. The analytical pipeline comprised two key phases: (1) rigorous selection of genetic instrumental variables (IVs) strongly associated with neuroanatomical features and region-specific gene expression patterns, followed by (2) implementation of MR analyses to assess potential causal effects of brain-related characteristics on neurodegenerative outcomes. This approach aims to generate evidence-based insights into biological pathways potentially involved in disease pathogenesis.
Source of GWAS summary dataset
The exposure dataset in this study encompasses region-specific brain structural characteristics and gene expression profiles. Neuroimaging genetic data were derived from genome-wide association study (GWAS) summary statistics by Patel et al. (2024, PMID: 38580839), who developed 512 unsupervised deep-learning imaging phenotypes (UDIPs) (comprising 256 T1-weighted and 256 T2-weighted features) through unsupervised deep learning of brain MRI scans, establishing the most comprehensive neuroimaging-genetic resource to date. Compared to conventional imaging-derived phenotypes (IDPs), UDIPs demonstrate superior capability in capturing cross-regional covariation patterns through unsupervised learning, with significantly higher average heritability (0.25 vs. 0.176 for IDPs), particularly advantageous for detecting polygenic weak effects in complex disorders such as Alzheimer’s disease. Crucially, UDIPs enable automated identification of multi-regional pathological covariation in neurodegenerative diseases (e.g., coordinated hippocampal volume loss and frontal cortical thinning in AD) via whole-brain encoding. Through the Pathology Decoding Interface (PerDI), UDIP-associated brain networks (e.g., thalamo-basal ganglia-frontal circuitry) can be mapped, enabling characterization of genetic and spatial patterns underpinning distributed degenerative pathologies. We provide quantified spatial mappings between UDIPs and anatomical regions in Supplementary Table SI, facilitating systematic exploration of MR results to identify disease-progression-associated UDIPs and their corresponding neuroanatomical substrates in NDDs. Higher K-S statistic values for a specific UDIP suggest more representation of the region by the UDIP. Each modality has a separate sheet for cortical and subcortical regions (the T1 modality includes 128 cortical UDIPs + 128 subcortical UDIPs, and the T2 modality includes 128 cortical UDIPs + 128 subcortical UDIPs).
eQTL summary statistics for the 13 brain regions were obtained from the GTEx Consortium database (accessible at https://gtexportal.org/home/datasets). These neuroanatomical structures, systematically labeled B1-B13 according to standardized nomenclature, comprise the amygdala (B1), anterior cingulate cortex BA24 (B2), caudate basal ganglia (B3), cerebellar hemisphere (B4), cerebellum (B5), cortex (B6), frontal cortex BA9 (B7), hippocampus (B8), hypothalamus (B9), nucleus accumbens basal ganglia (B10), putamen basal ganglia (B11), spinal cord cervical c-1 (B12) and substantia nigra (B13). It is noteworthy that the exposure dataset was primarily derived from European ancestry populations.
Summary statistics for NDDs were sourced from the Integrative Epidemiology Unit (IEU) Open GWAS database at the University of Bristol. All genetic datasets were derived from European-ancestry populations, with case-control configurations as follows: AD (21,982 cases vs. 41,944 controls) [18], PD (33,674 cases vs. 449,056 controls) [19], ALS (12,577 cases vs. 23,475 controls) [20], MS (47,429 cases vs. 68,374 controls) [21]. Case ascertainment and diagnosis were performed in accordance with the study-specific clinical criteria and protocols detailed in the respective original publications and summarized in Table I [18–21]. Genetic associations were adjusted for genomic principal components to account for population stratification.
Table I
Information fundamental for the inclusion of outcome data in GWAS
| Pheno-type | Numbers of SNP | Cases | Controls | Sample size | Population | PMID | |
|---|---|---|---|---|---|---|---|
| AD | 10,528,610 | 21,982 | 41,944 | 63,926 | European | 30820047 | https://gwas.mrcieu.ac.uk/datasets/ieu-b-2/ |
| PD | 17,891,936 | 33,674 | 449,056 | 482,730 | European | 31701892 | https://gwas.mrcieu.ac.uk/datasets/ieu-b-7/ |
| ALS | 7,740,345 | 12,577 | 23,475 | 36,052 | European | 27455348 | https://gwas.mrcieu.ac.uk/datasets/ieu-a-1085/ |
| MS | 6,304,359 | 47,429 | 68,374 | 115,803 | European | 31604244 | https://gwas.mrcieu.ac.uk/datasets/ieu-b-18/ |
SNP selection and MR analysis
We employed multiple methods, including inverse variance weighted (IVW), MR Egger, weighted median, and weighted mode approaches, to investigate potential causal relationships between brain structure, 13 brain region-specific features, and NDDs (AD, PD, ALS and MS). To ensure the validity of MR analysis, adherence to three key criteria is critical: (1) single-nucleotide polymorphisms (SNPs) should exclusively influence exposure traits (e.g., brain structure and 13 brain region-specific features); (2) SNPs should not be correlated with confounding factors affecting exposure traits; and (3) SNPs should affect outcome traits solely through their impact on exposure traits. Supplementary Table SII contains the comprehensive SNP details (rsID, beta, SE, etc.) that are used in this analysis. To ensure the selection of strongly associated and reliable SNPs, this study established stringent screening thresholds and criteria. The p-value was set at ≤ 5 × 10⁻⁸, along with an r2 < 0.001 criterion. Additionally, a linkage disequilibrium (LD) clustering algorithm was employed to eliminate SNPs exhibiting potential LD issues. These measures were implemented to mitigate complex LD effects and enhance the accuracy of the research findings. Furthermore, to enhance the precision of MR analyses, the genetic window for SNPs was standardized to 100 kb. Concurrently, the F-statistic was calculated to evaluate the strength of selected SNPs in explaining phenotypic variance between brain structure, 13 regional brain features, and NDDs or their associated traits. Following rigorous SNP screening, formal MR analyses were conducted to investigate causal relationships between brain architecture, 13 neuroanatomical features, and NDDs. The choice of MR analytical models depended on the number of available valid SNPs: the Wald ratio method was employed for analyses with a single SNP, fixed-effects IVW models for 2-3 SNPs, and random-effects IVW models for scenarios involving > 3 SNPs to account for potential heterogeneity. Results were quantified using odds ratios (OR) with 95% confidence intervals (95% CI) and p-values. Since the exposure phenotypes (UDIPs) are latent features derived from deep learning without intrinsic physical units, all effect sizes were standardized. Consequently, the reported odds ratios (ORs) represent the relative risk of the outcome per standard deviation (SD) increase in the exposure phenotype. To account for multiple comparisons and minimize false discovery rates (FDR) inherent in high-throughput analyses, we implemented the Benjamini–Hochberg (BH) procedure. Multiple-testing correction was performed independently for each outcome (AD, PD, ALS, MS) and exposure category (UDIPs and gene expression traits). We defined robust causal associations as those with an FDR-adjusted p-value < 0.05. Associations with a nominal p-value < 0.05 but FDR ≥ 0.05 were reported as suggestive or nominally significant evidence. For the SMR analysis, a similar FDR correction strategy was implemented to identify significant gene-trait associations.
SMR analysis of region-specific gene expression and NDDs
This study employed the summary-data-based Mendelian randomization (SMR) approach to analyze expression quantitative trait loci (eQTLs) data obtained from the Genotype-Tissue Expression (GTEx) Consortium database (https://gtexportal.org/home/datasets), using these genetic variants as proxy indicators for gene expression across distinct brain regions. Through rigorous quality control criteria, retaining cis-acting eQTLs with minor allele frequency (MAF) > 1% and genome-wide significance (p < 5 × 10⁻⁸), we systematically identified genes demonstrating significant expression profiles in 13 cerebral regions and evaluated their potential causal effects on neurodegenerative diseases. To differentiate between causality (pleiotropy) and linkage (linkage disequilibrium) between the gene expression and disease traits, we applied the HEIDI (HEterogeneity in Dependent Instruments) test. A HEIDI p-value > 0.05 was considered indicative of a shared causal variant, whereas a p-value < 0.05 suggested that the association might be driven by linkage disequilibrium between distinct variants. Only associations passing this threshold were prioritized for causal interpretation.
Sensitivity analysis
To systematically evaluate the reliability and consistency of MR analysis results, this study employed multiple statistical methods for sensitivity analyses, including the heterogeneity I2 statistic, Cochran’s Q test, Egger’s intercept test, MR-PRESSO, and leave-one-out sensitivity test. Specifically, the heterogeneity I2 statistic and Cochran’s Q test were applied to assess result variability, where a p-value < 0.05 in Cochran’s Q test indicated significant between-cohort heterogeneity. Egger’s intercept test was utilized to detect potential horizontal pleiotropy in MR analyses. All statistical analyses were performed using R software (version 4.2.1) with relevant statistical packages.
Ethical statement
The study utilized publicly available GWAS summary statistics databases. Ethical considerations for these datasets were previously addressed by the original contributing institutions, with all participants having provided informed consent. Thus, no additional ethical approval was required for the current analysis.
Results
Potential causal effects of brain structure on NDDs
All Mendelian randomization analysis results that survived multiple testing correction (FDR p-value < 0.05) are summarized in Supplementary Table SIII. While we employed a heuristic rule (Random-Effects model for >3 SNPs) to account for potential between-SNP heterogeneity, we performed a post-hoc assessment using Cochran’s Q test. We found that 94.6% of the significant multi-SNP associations exhibited no evidence of heterogeneity (P Q > 0.05, see Supplementary Table SIII). This indicates that for the majority of analyses, the random-effects model provided more conservative estimates (i.e. wider confidence intervals than fixed-effects models), suggesting that the estimates were not driven by substantial between-SNP heterogeneity.
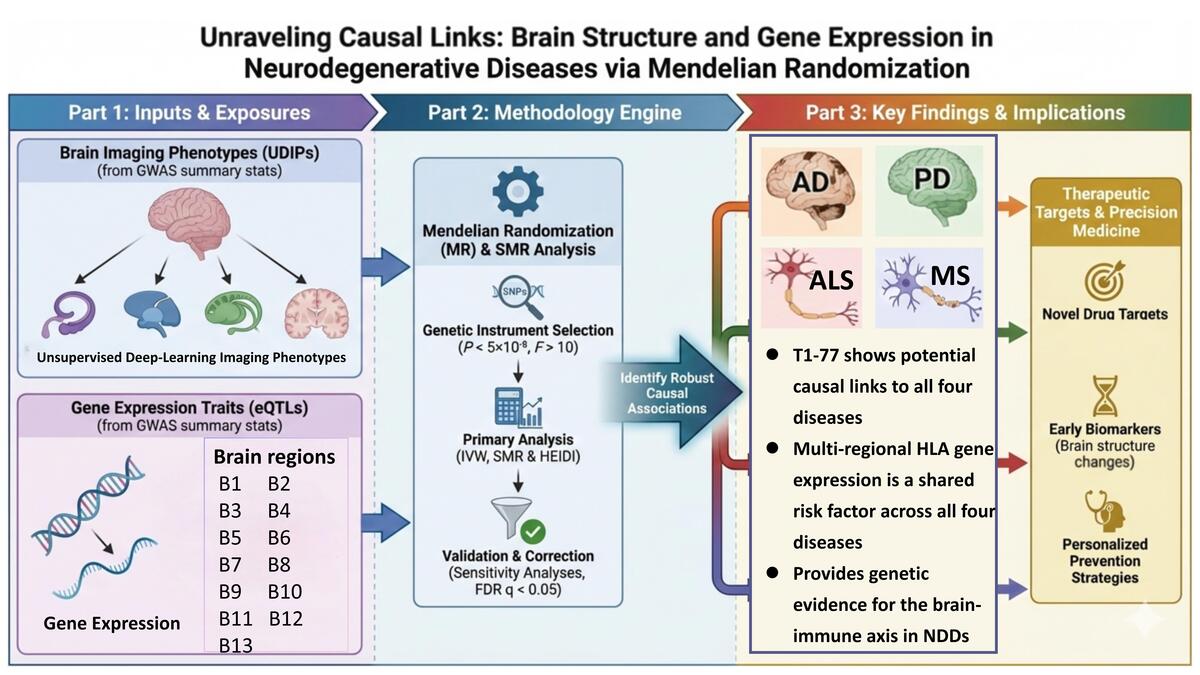
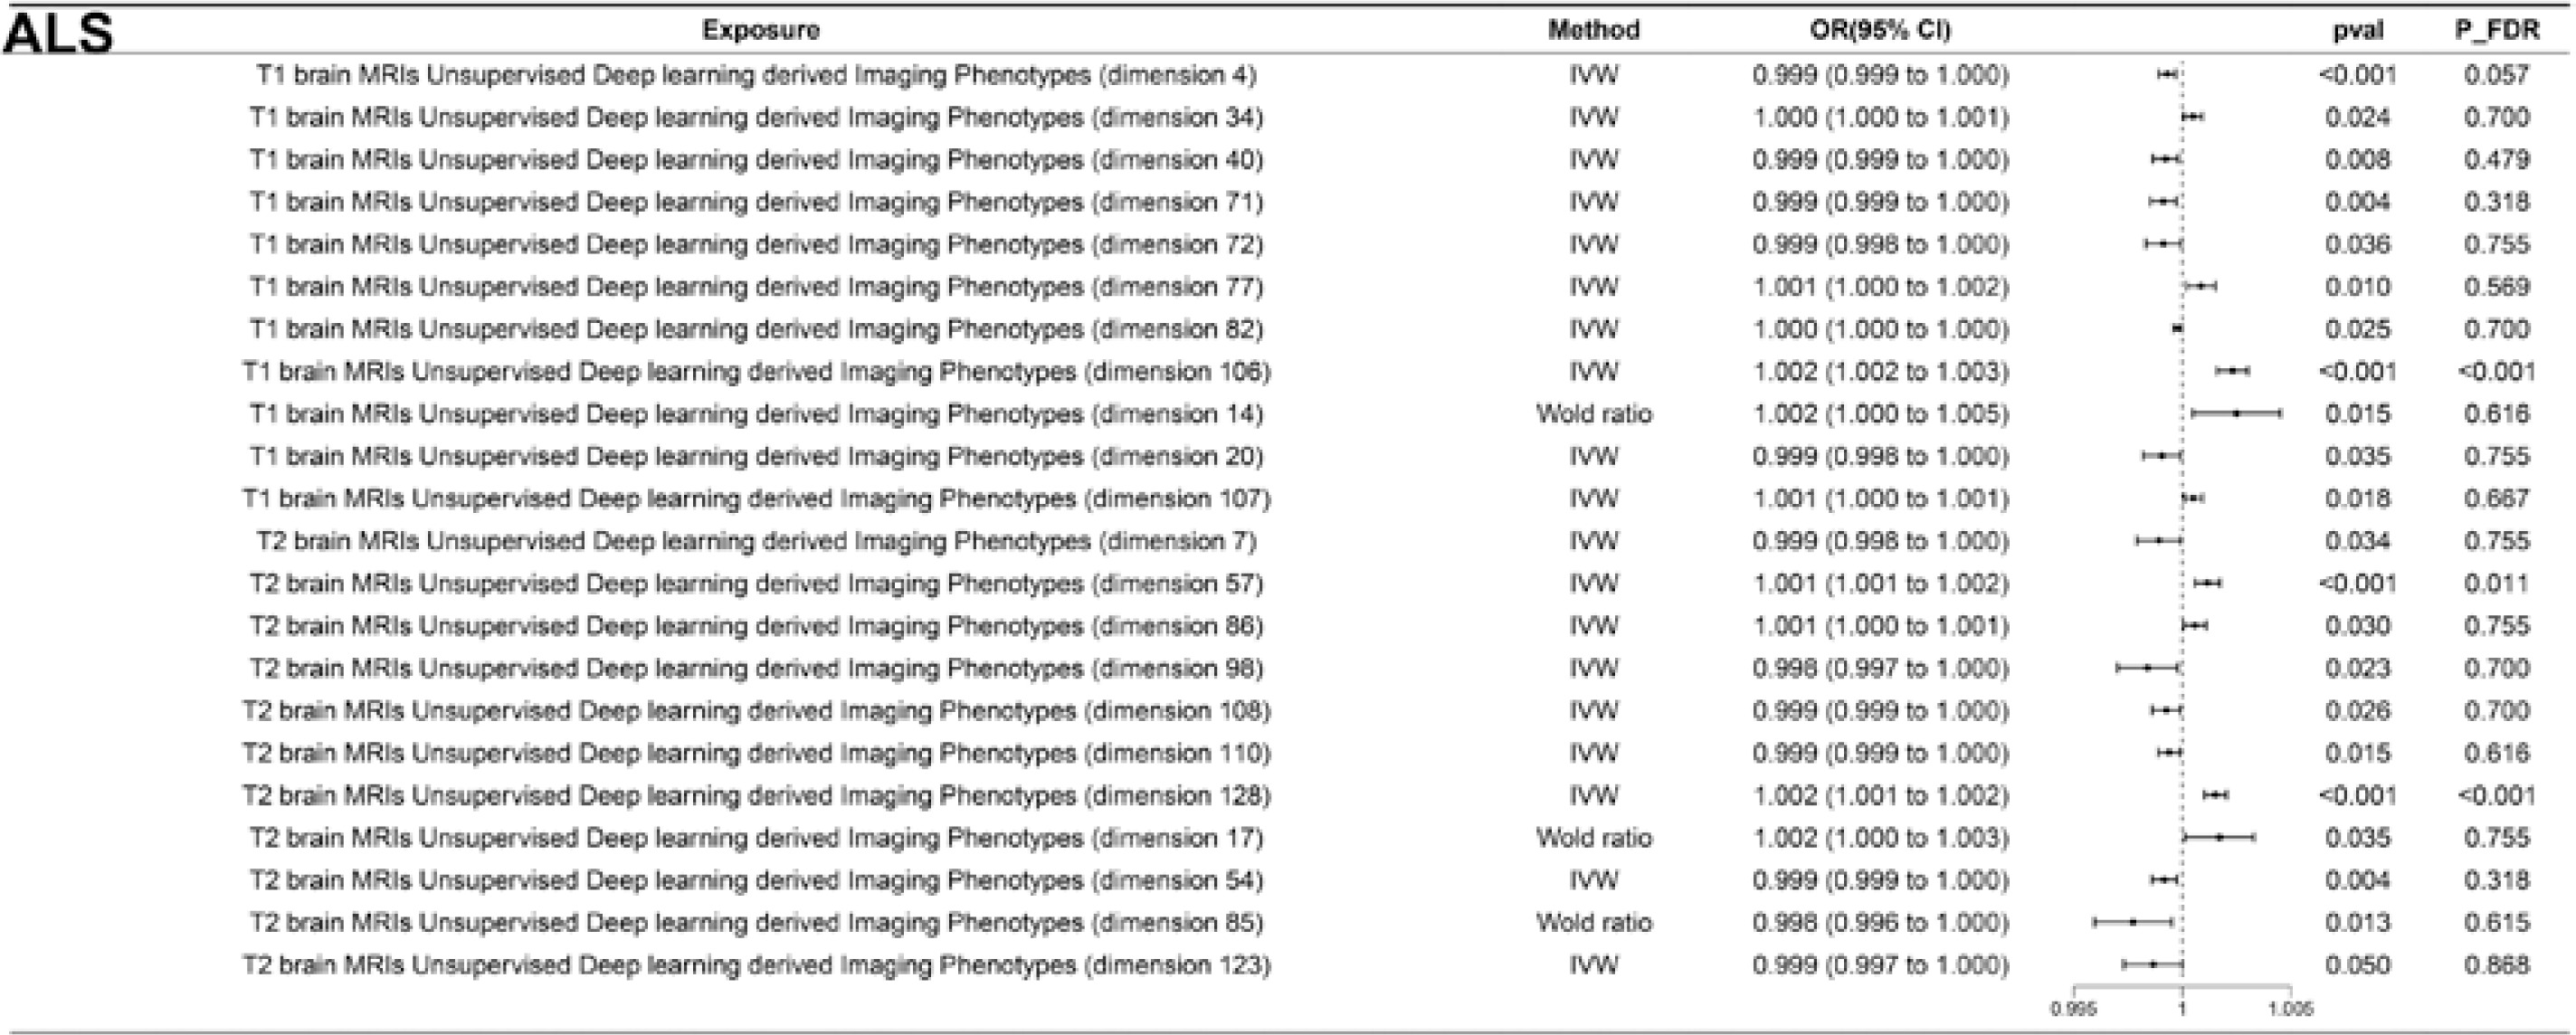
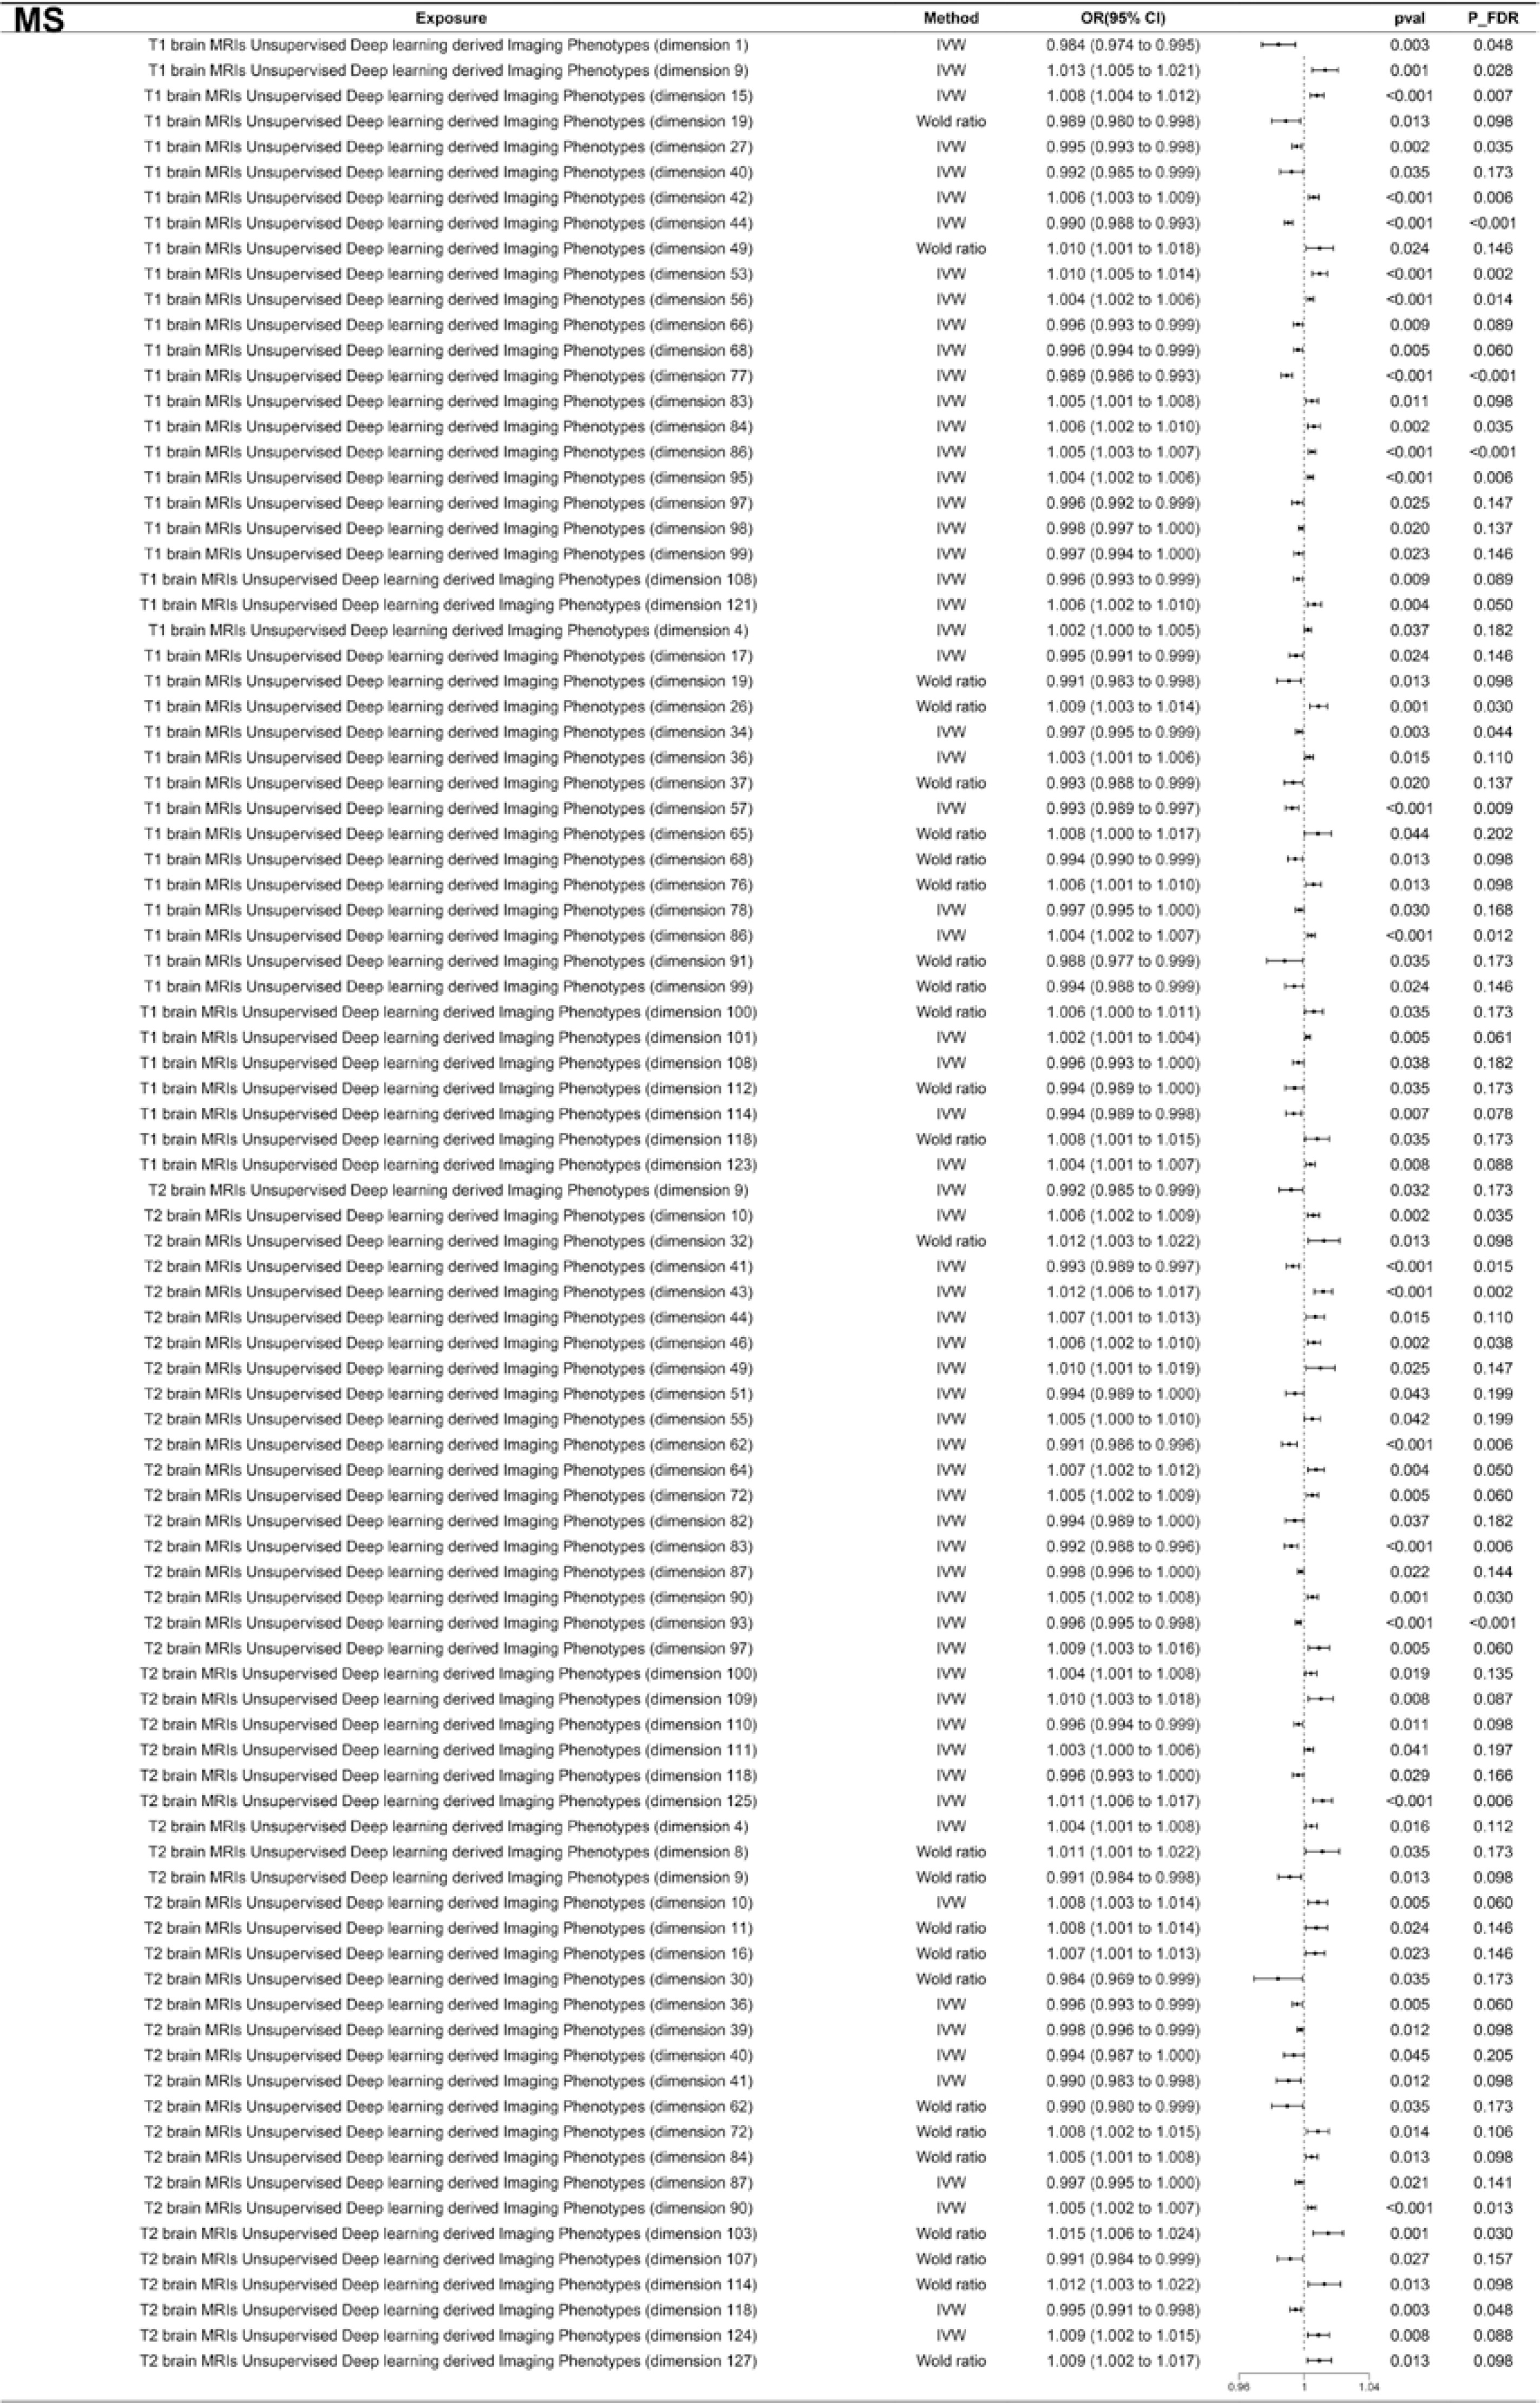
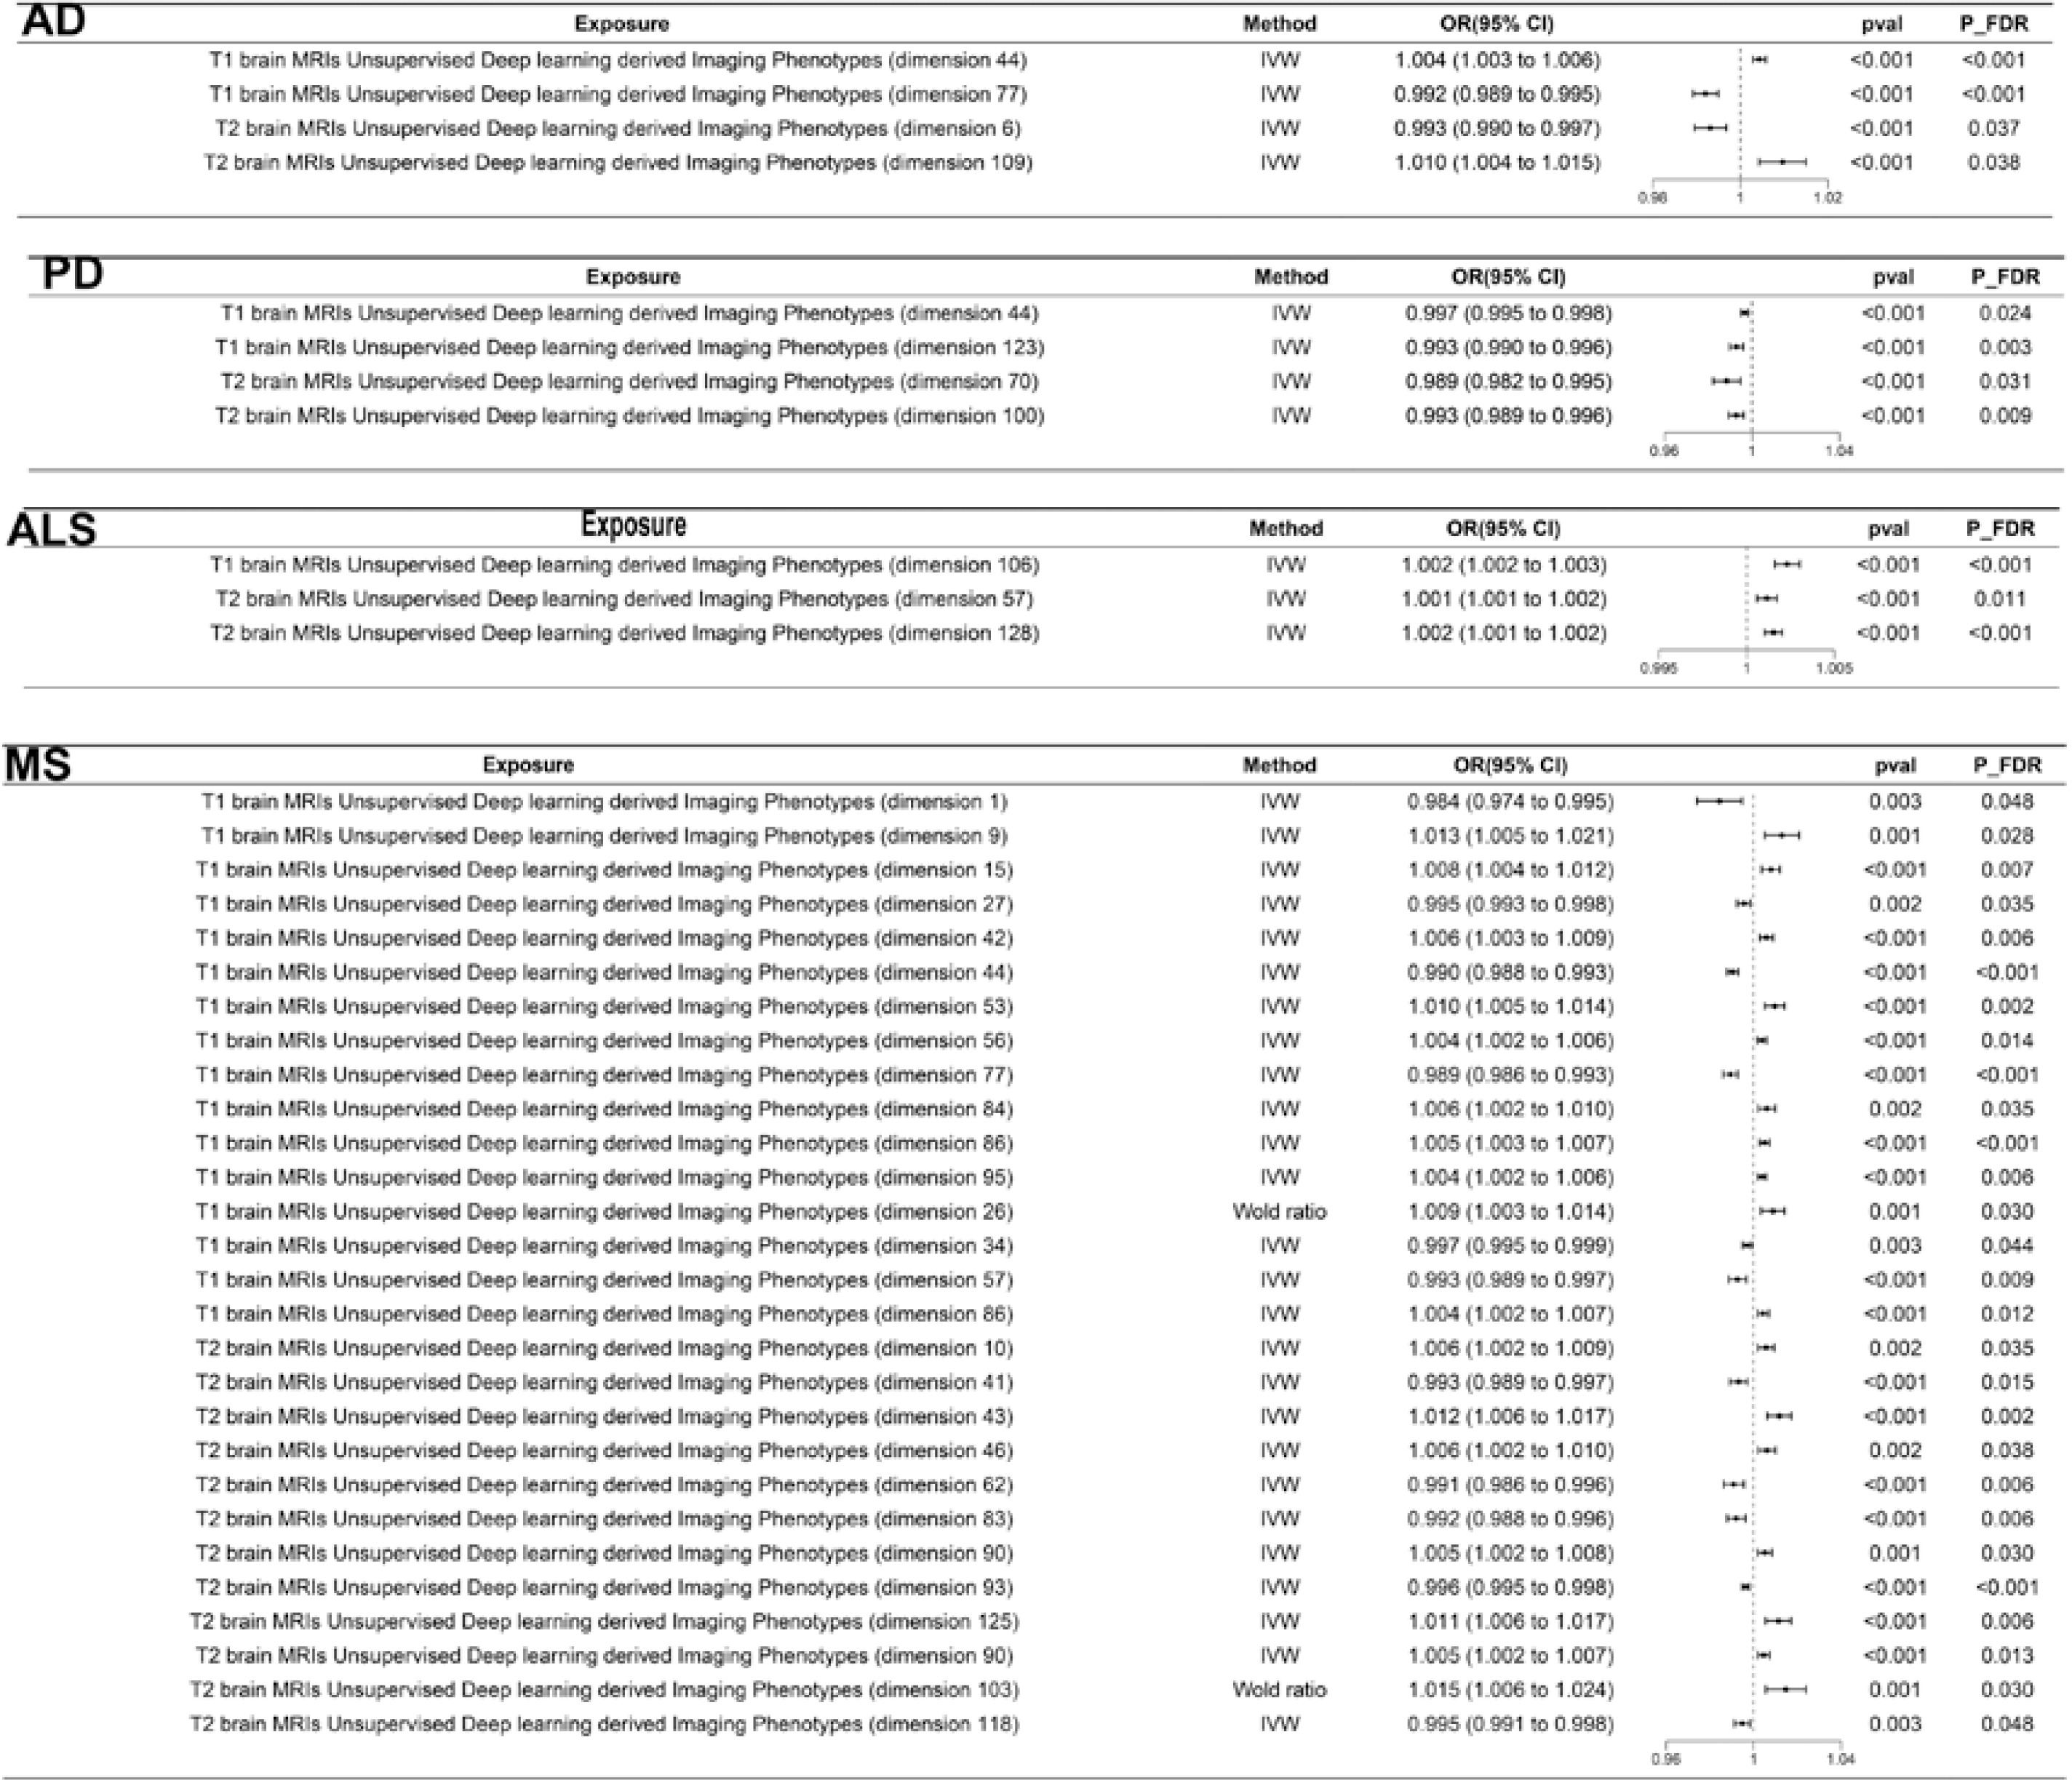
MR analysis was employed to investigate potential causal relationships between brain structural changes across diverse brain regions and NDD-related traits. The results revealed significant evidence of potential causal effects of multiple UDIPs on AD, PD, ALS, and MS. Notably, T1-77 was identified as the sole UDIP showing evidence of causal effects on all four NDDs (Supplementary Figure S1). According to Patel et al. (2024), T1-77 demonstrated high congruence with signal distributions in the occipital fusiform gyrus and globus pallidus, suggesting that structural alterations in these regions may play pivotal roles in the pathogenesis of all four NDDs [22]. In the analysis of AD, 34 UDIPs showed evidence of potential causal effects. For example, T2-58 demonstrated a positive association with AD risk, with an odds ratio (OR) of 1.012 (95% CI: 1.002–1.02) (Figure 2). In PD, 56 UDIPs showed evidence of potential causal effects, including T2-66, which was positively correlated with PD risk (OR = 1.018, 95% CI: 1.004–1.033) (Figure 3). Additionally, 22 and 92 UDIPs were identified as potential causal factors for ALS and MS, respectively (Figures 4 and 5). Notably, after FDR correction, several UDIPs remained statistically significant in relation to NDDs. Specifically, 4 UDIPs remained significantly associated with AD and PD risk, 3 with ALS, and 28 with MS (Figure 6). Brain regions corresponding to these FDR-corrected UDIPs are detailed in Supplementary Table SIV. Collectively, these results underscore the critical role of structural brain alterations as potential risk factors for NDDs.
Figure 2
Forest plot showing MR-derived associations between 34 unsupervised deep-learning imaging phenotypes (UDIPs) and Alzheimer’s disease (AD)
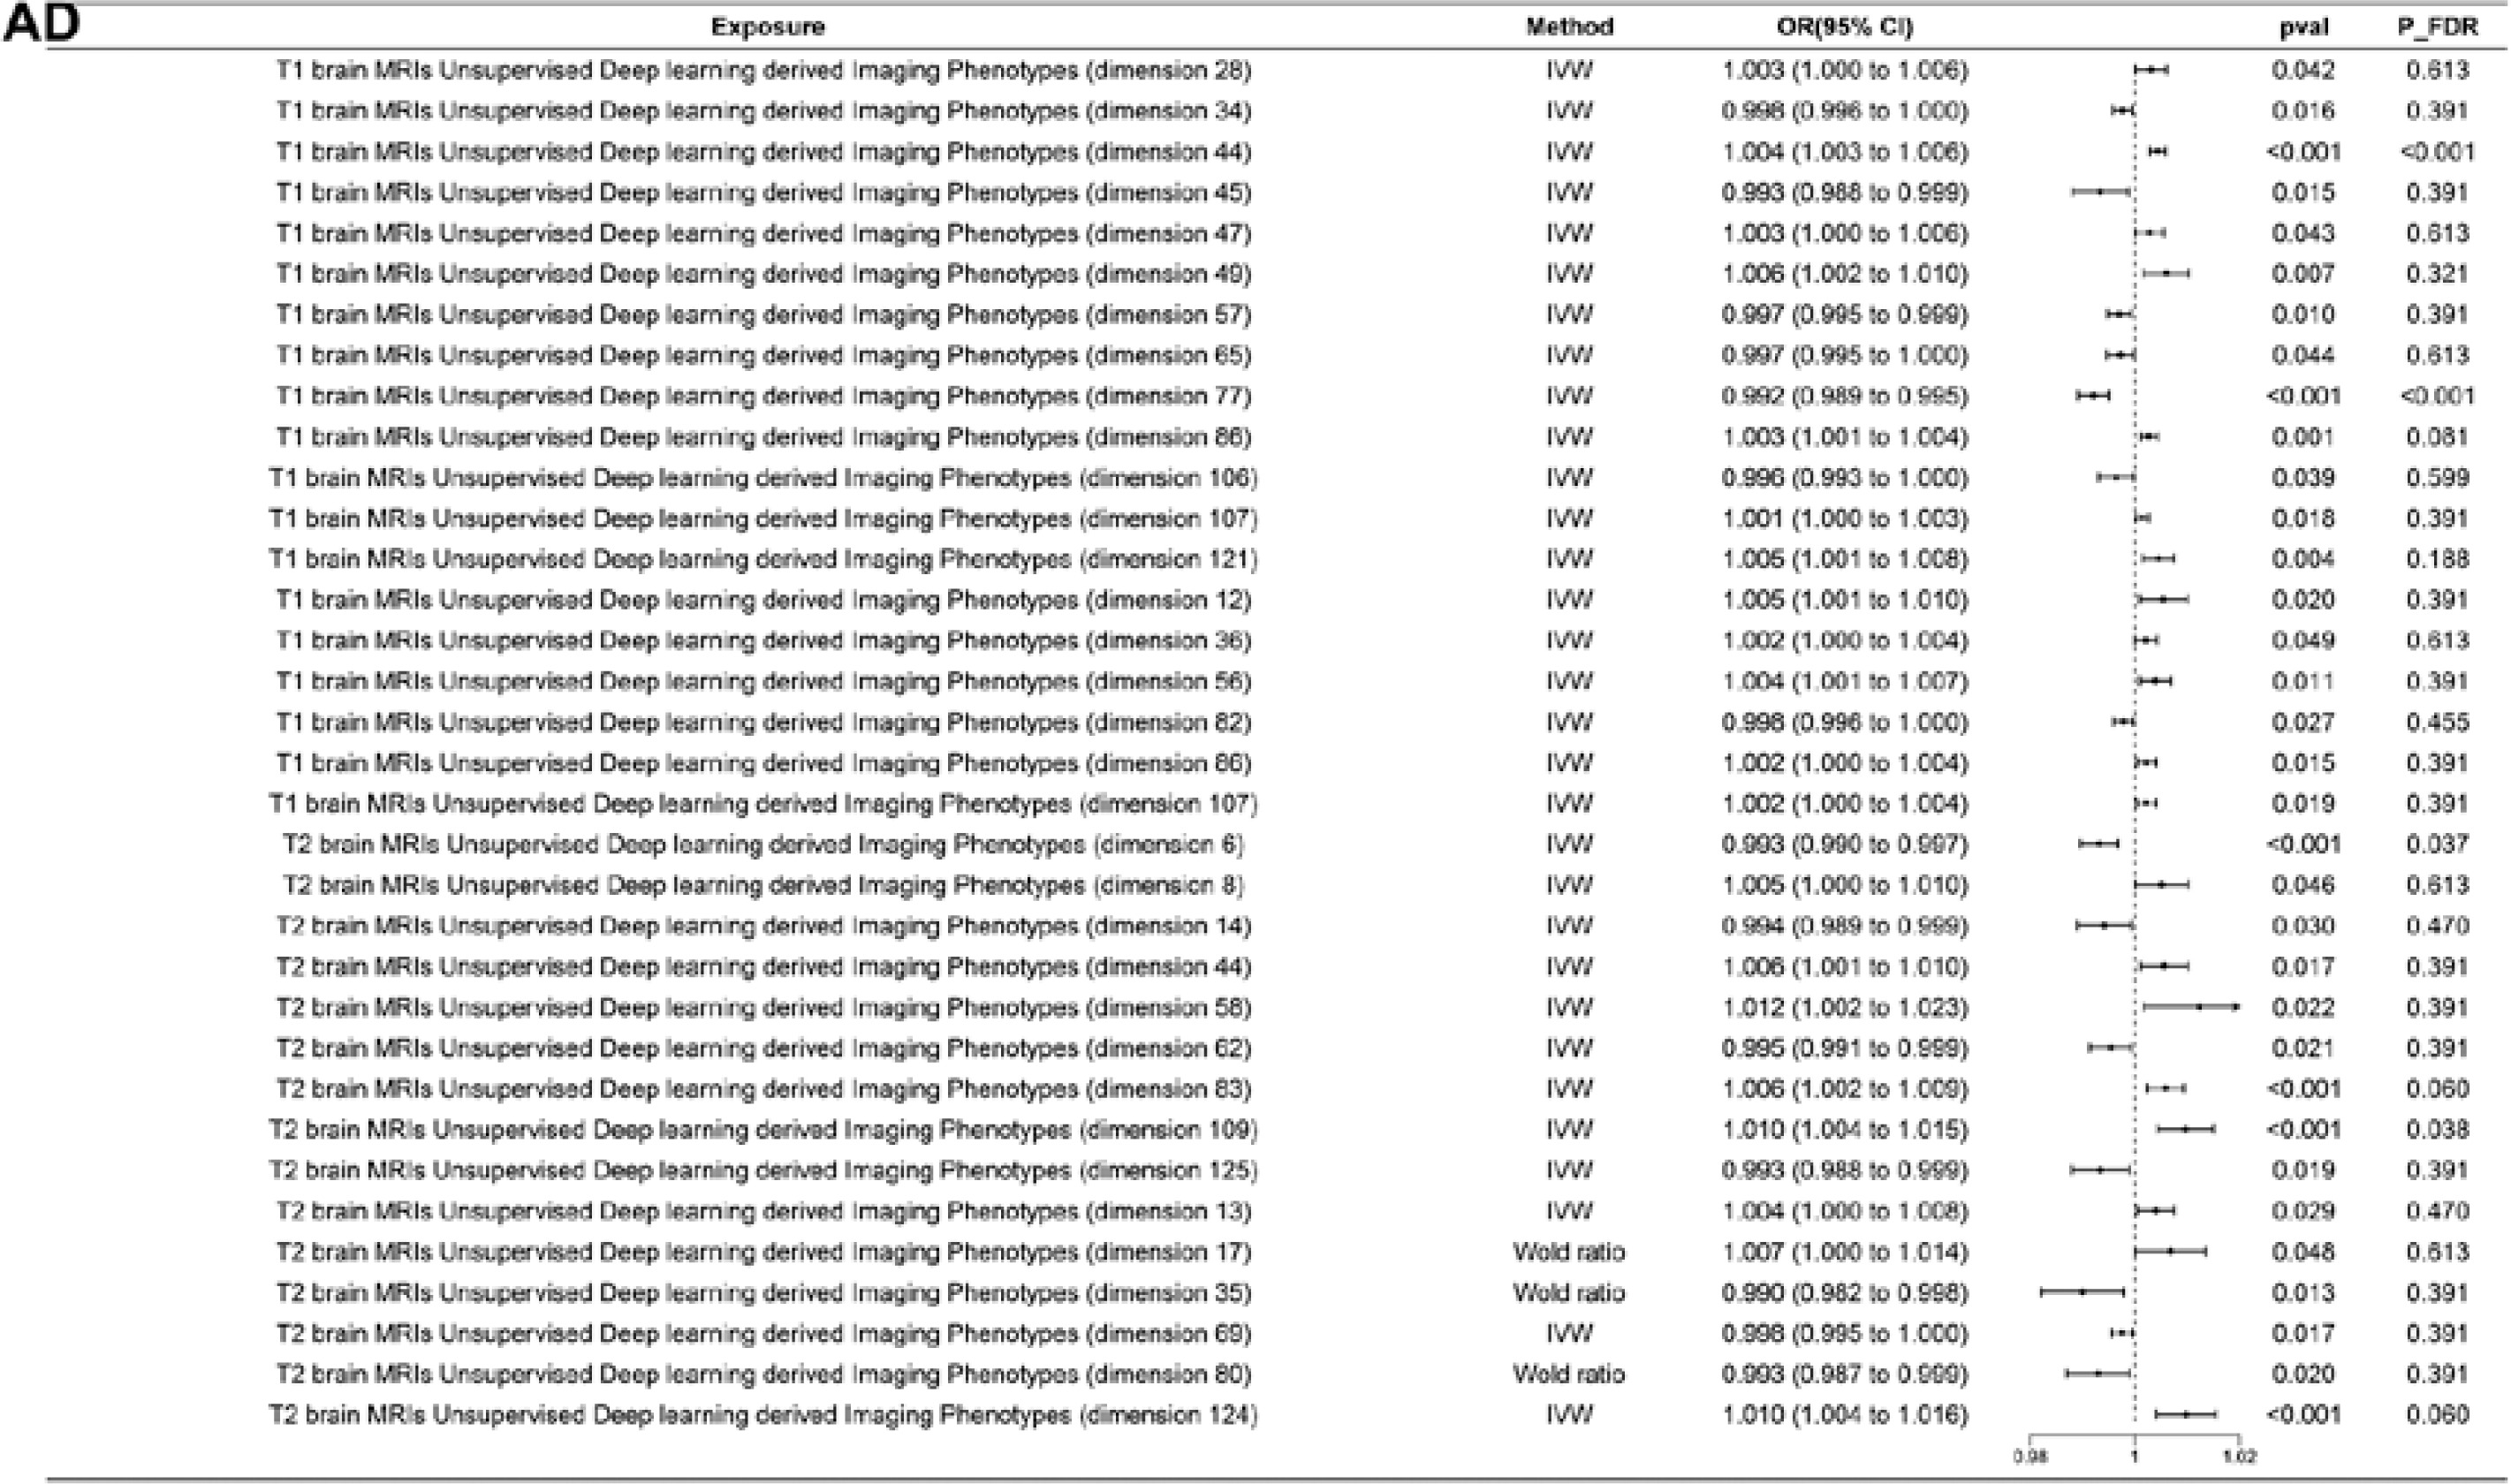
Figure 3
Forest plot showing MR-derived associations between 56 unsupervised deep-learning imaging phenotypes (UDIPs) and Parkinson’s disease (PD)
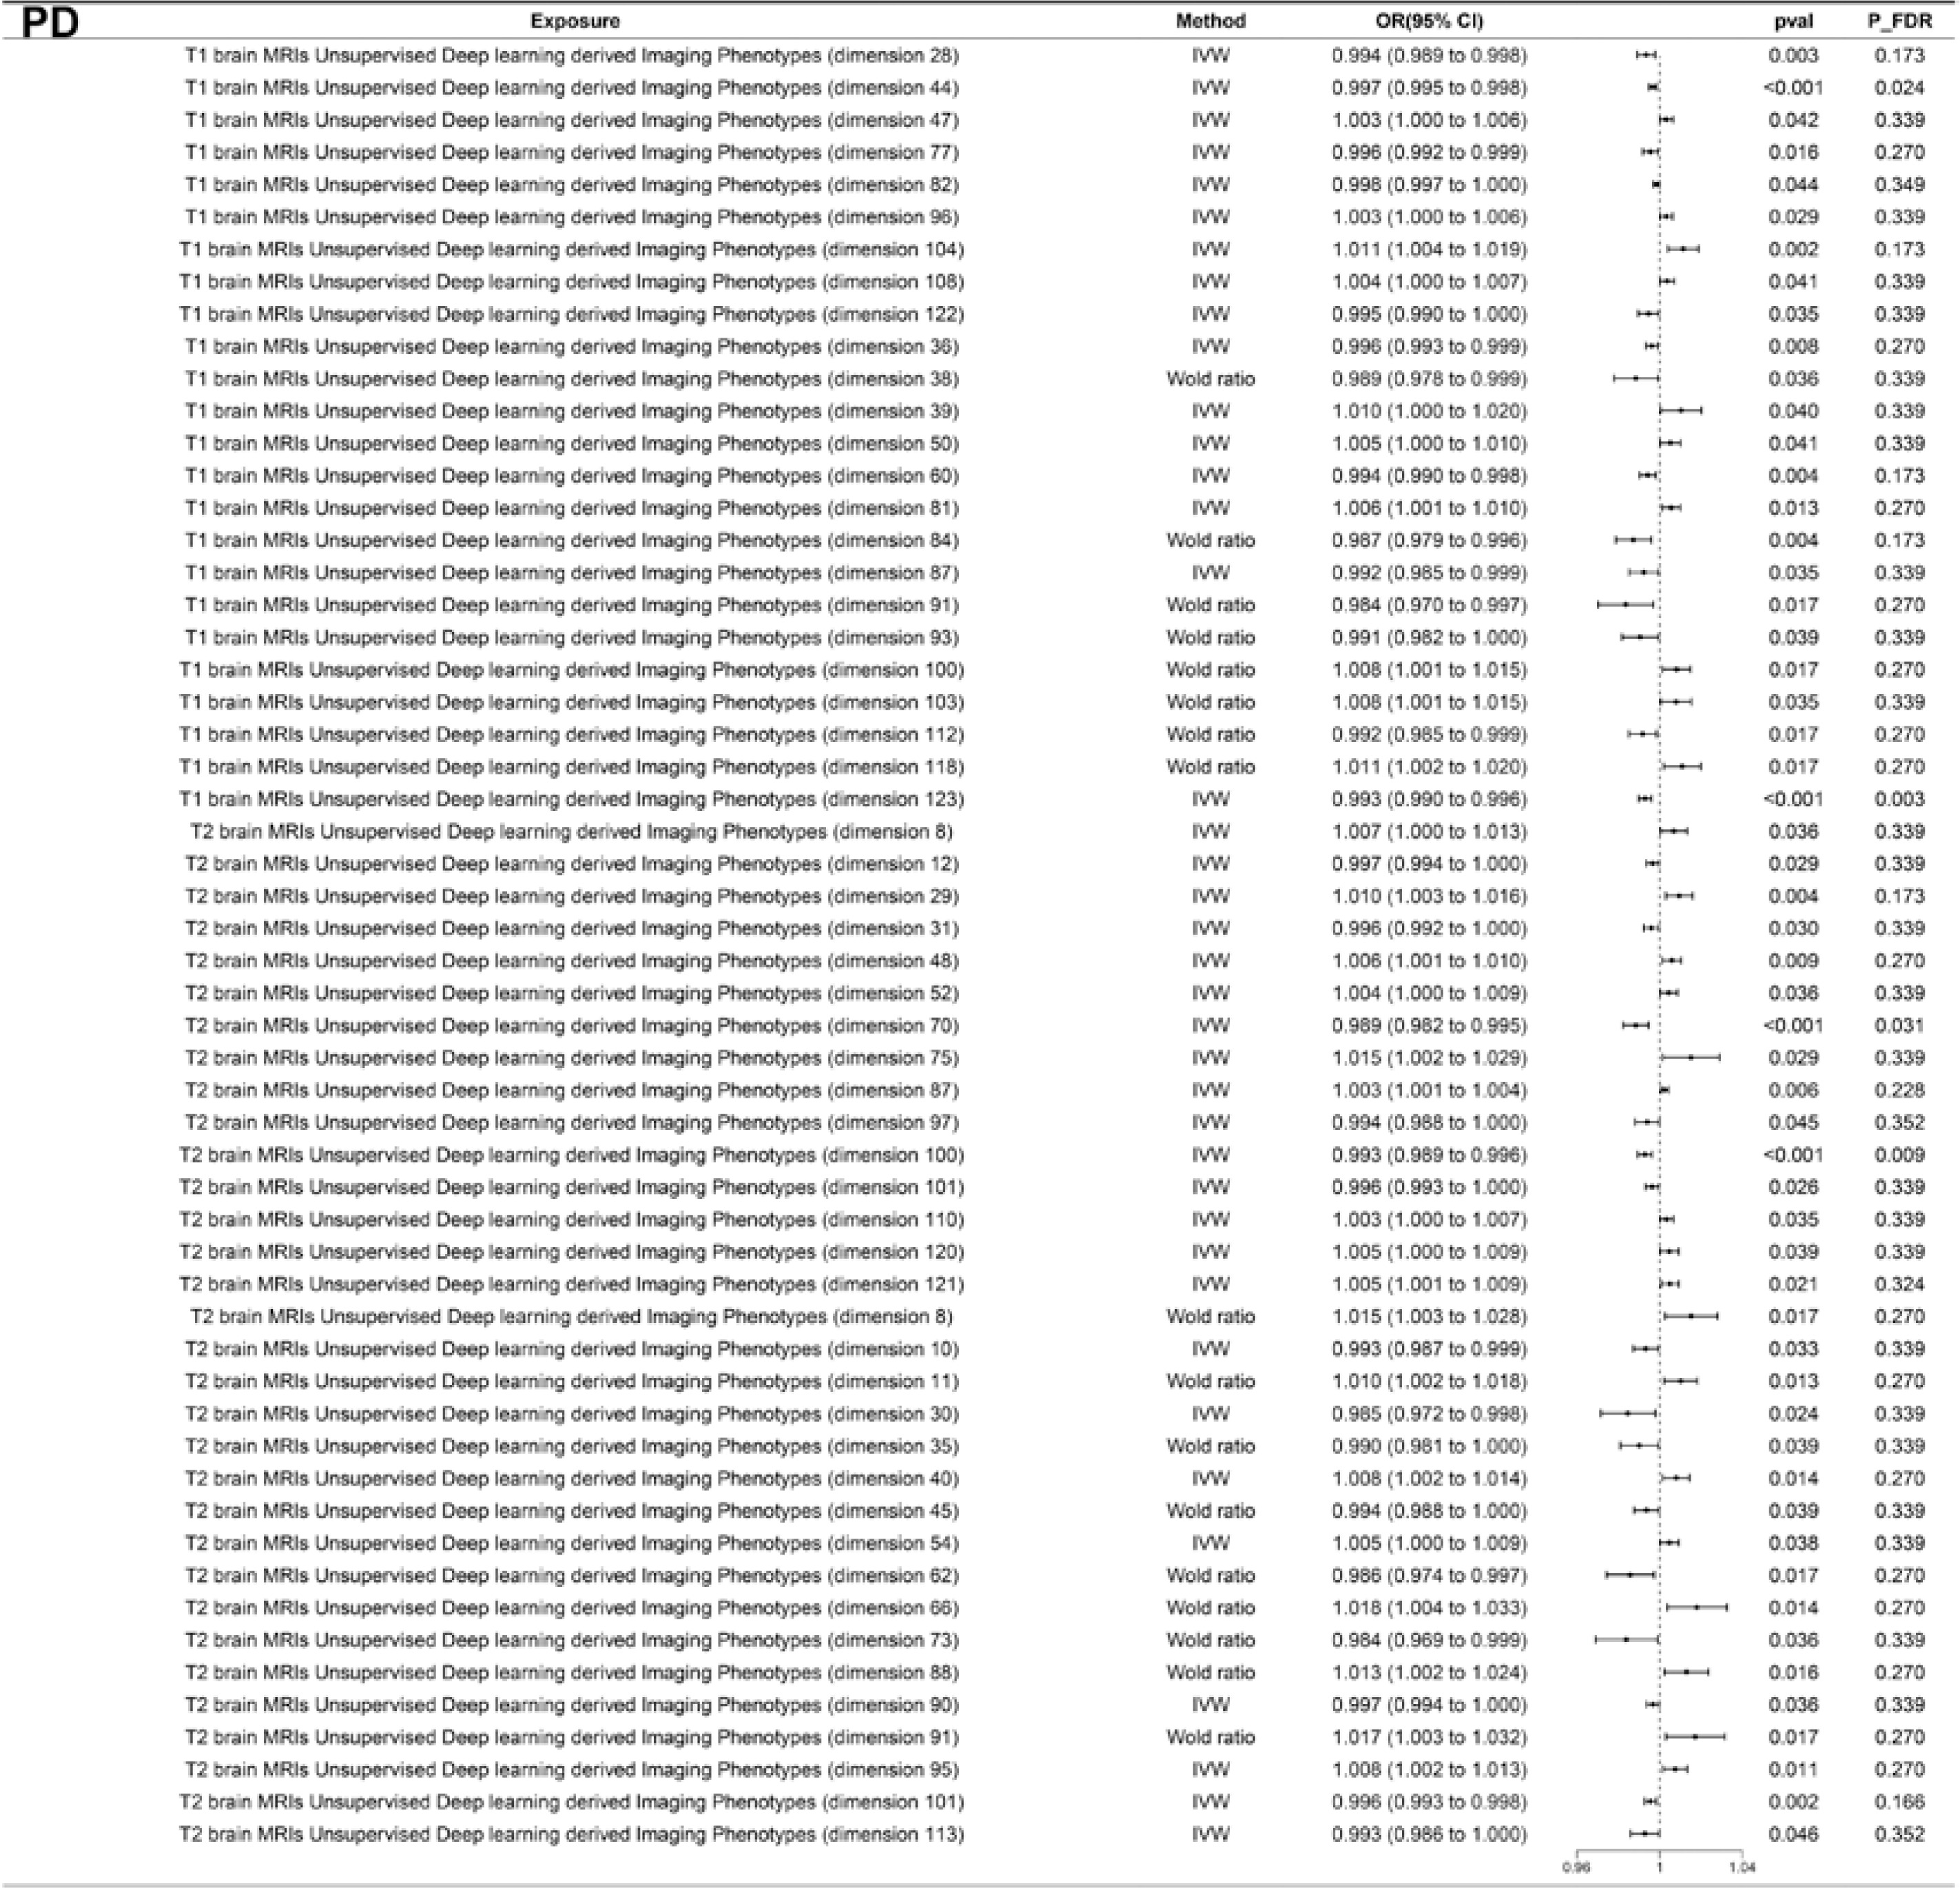
Figure 4
Forest plot showing 22 unsupervised deep-learning imaging phenotypes (UDIPs) with significant genetic associations and putative causal effects on amyotrophic lateral sclerosis (ALS) based on MR analysis
Potential causal effect of brain region-specific gene expression on NDDs
eQTL summary statistics across 13 brain regions were integrated to further investigate potential causal relationships between regional gene expression profiles and NDDs-related traits. The results showed evidence of significant causal associations between multiple brain region-specific genes and NDDs (Supplementary Figure S2). Supplementary Table SV shows the relevant genes and specific MR results for 13 brain regions potentially causally associated with the 4 NDDs. In region B1, two genes (HLA-DRB1 and HLA-DQA2) showed evidence of significant effects on all four NDDs (AD, PD, ALS, and MS) (Figure 7 A). Specifically, elevated HLA-DRB1 expression was associated with increased disease risk for AD (OR = 1.142, 95% CI: 1.032–1.262), PD (OR = 1.329, 95% CI: 1.134–1.557), ALS (OR = 1.023, 95% CI: 1.001–1.046), and MS (OR = 10.256, 95% CI: 5.003–21.024). Conversely, higher HLA-DQA2 expression showed evidence of protective effects against all four disorders, with ORs (95% CI) of 0.949 (0.914–0.987) for AD, 0.925 (0.877–0.975) for PD, 0.990 (0.982–0.999) for ALS, and 0.461 (0.384–0.555) for MS. In the B1 region, HLA-DRB1 and HLA-DQA2 exhibited significant SMR associations across all four disorders. However, the HEIDI test suggested potential heterogeneity in the nature of these signals. For MS, significant heterogeneity was observed (P HEIDI < 0.05), suggesting that these associations are likely influenced by the complex linkage disequilibrium characteristic of the MHC region in autoimmune pathologies. Conversely, for AD, PD, and ALS, both genes consistently showed no evidence of heterogeneity in the HEIDI test (P HEIDI > 0.05). This suggests consistency with a shared underlying signal for these neurodegenerative conditions and is less consistent with linkage artifacts.
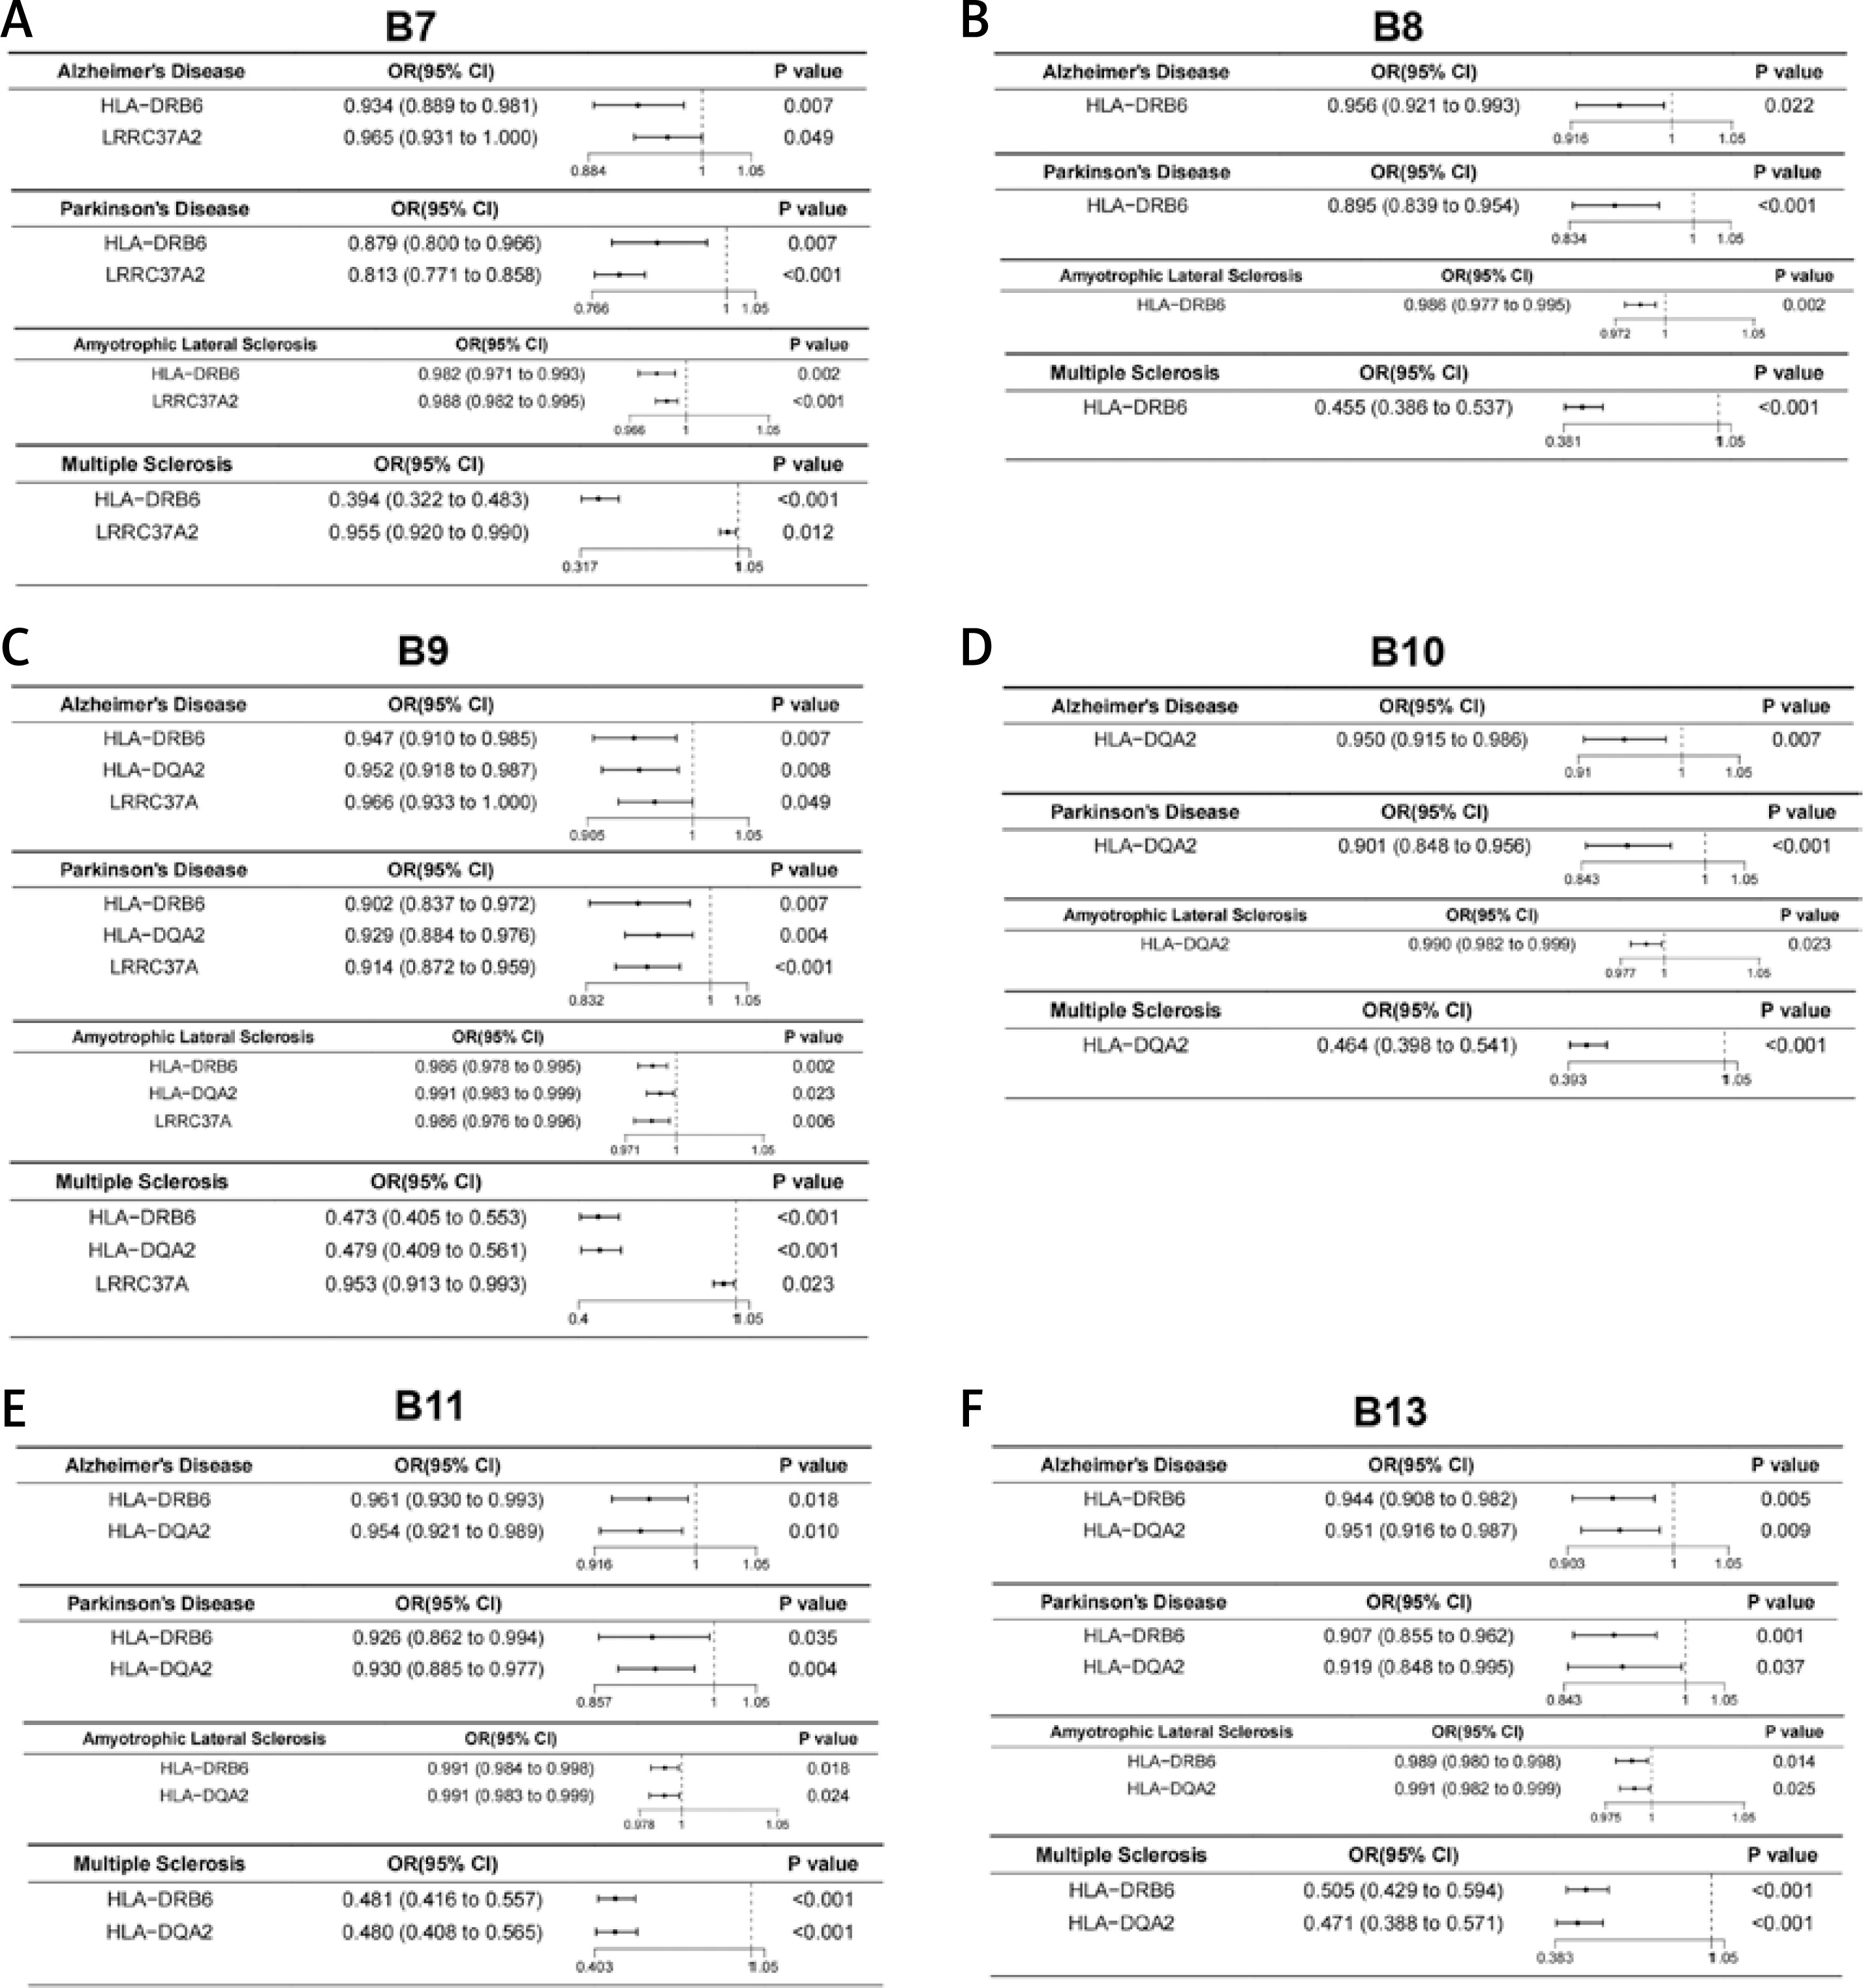
In the B2 region, as shown in Figure 7 B, we identified two genes (HLA - DRB1 and LRRC37A2) showing evidence of potential causal associations with all four NDDs. HLA-DRB1 was associated with increased risk for these four diseases, whereas LRRC37A2 was associated with decreased risk. In the B3 region, as shown in Figure 7 C, we identified HLA-DQA2 as a potentially protective gene that showed evidence of causal associations with all four NDDs. In the B4 region, as shown in Figure 7 D, we identified both HLA-DRB6 and LRRC37A as protective genes that showed evidence of causal associations with all four NDDs. In the B5 region, as shown in Figure 7 E, we identified two genes (HLA-DRB1 and ZC3H7B) that showed evidence of causal associations with all four NDDs. HLA-DRB1 was associated with increased risk for these four disorders, whereas ZC3H7B was associated with decreased risk. In the B6 region, as shown in Figure 7 F, we identified three genes (HLA-DRB6, HLA-DQB1, and LRRC37A2) that showed evidence of causal associations with all four NDDs. Among them, HLA-DQB1 was associated with increased risk for these disorders, whereas HLA-DRB6 and LRRC37A2 were associated with decreased risk. In the B7 region, as shown in Figure 8 A, we identified HLA-DRB6 and LRRC37A2 as potentially protective genes that showed evidence of causal associations with all four NDDs. In the B8 region, as shown in Figure 8 B, we identified HLA-DRB6 as a protective gene that showed evidence of causal associations with all four NDDs. In the B9 region, as shown in Figure 8 C, we identified three genes (HLA-DRB6, HLA-DQA2, and LRRC37A) as potentially protective genes that showed evidence of causal associations with all four NDDs. In the B10 region, as shown in Figure 8 D, we identified HLA-DQA2 as a potentially protective gene that showed evidence of causal associations with all four NDDs. In the B11 and B13 regions (Figures 8 E, F), consistent results were obtained, identifying HLA-DRB6 and HLA-DQA2 as potentially protective genes significantly associated with all four NDDs. No genes were found to exhibit concurrent causal relationships with all four disorders in the B12 region.
Figure 7
Forest plot showing genes with significant genetic associations and putative causal effects in regions A–F (B1–B6) for all four neurodegenerative diseases. A (B1) – amygdala; B (B2) – anterior cingulate cortex BA24; C (B3) – caudate basal ganglia; D (B4) – cerebellar hemisphere; E (B5) – cerebellum; F (B6) – cortex
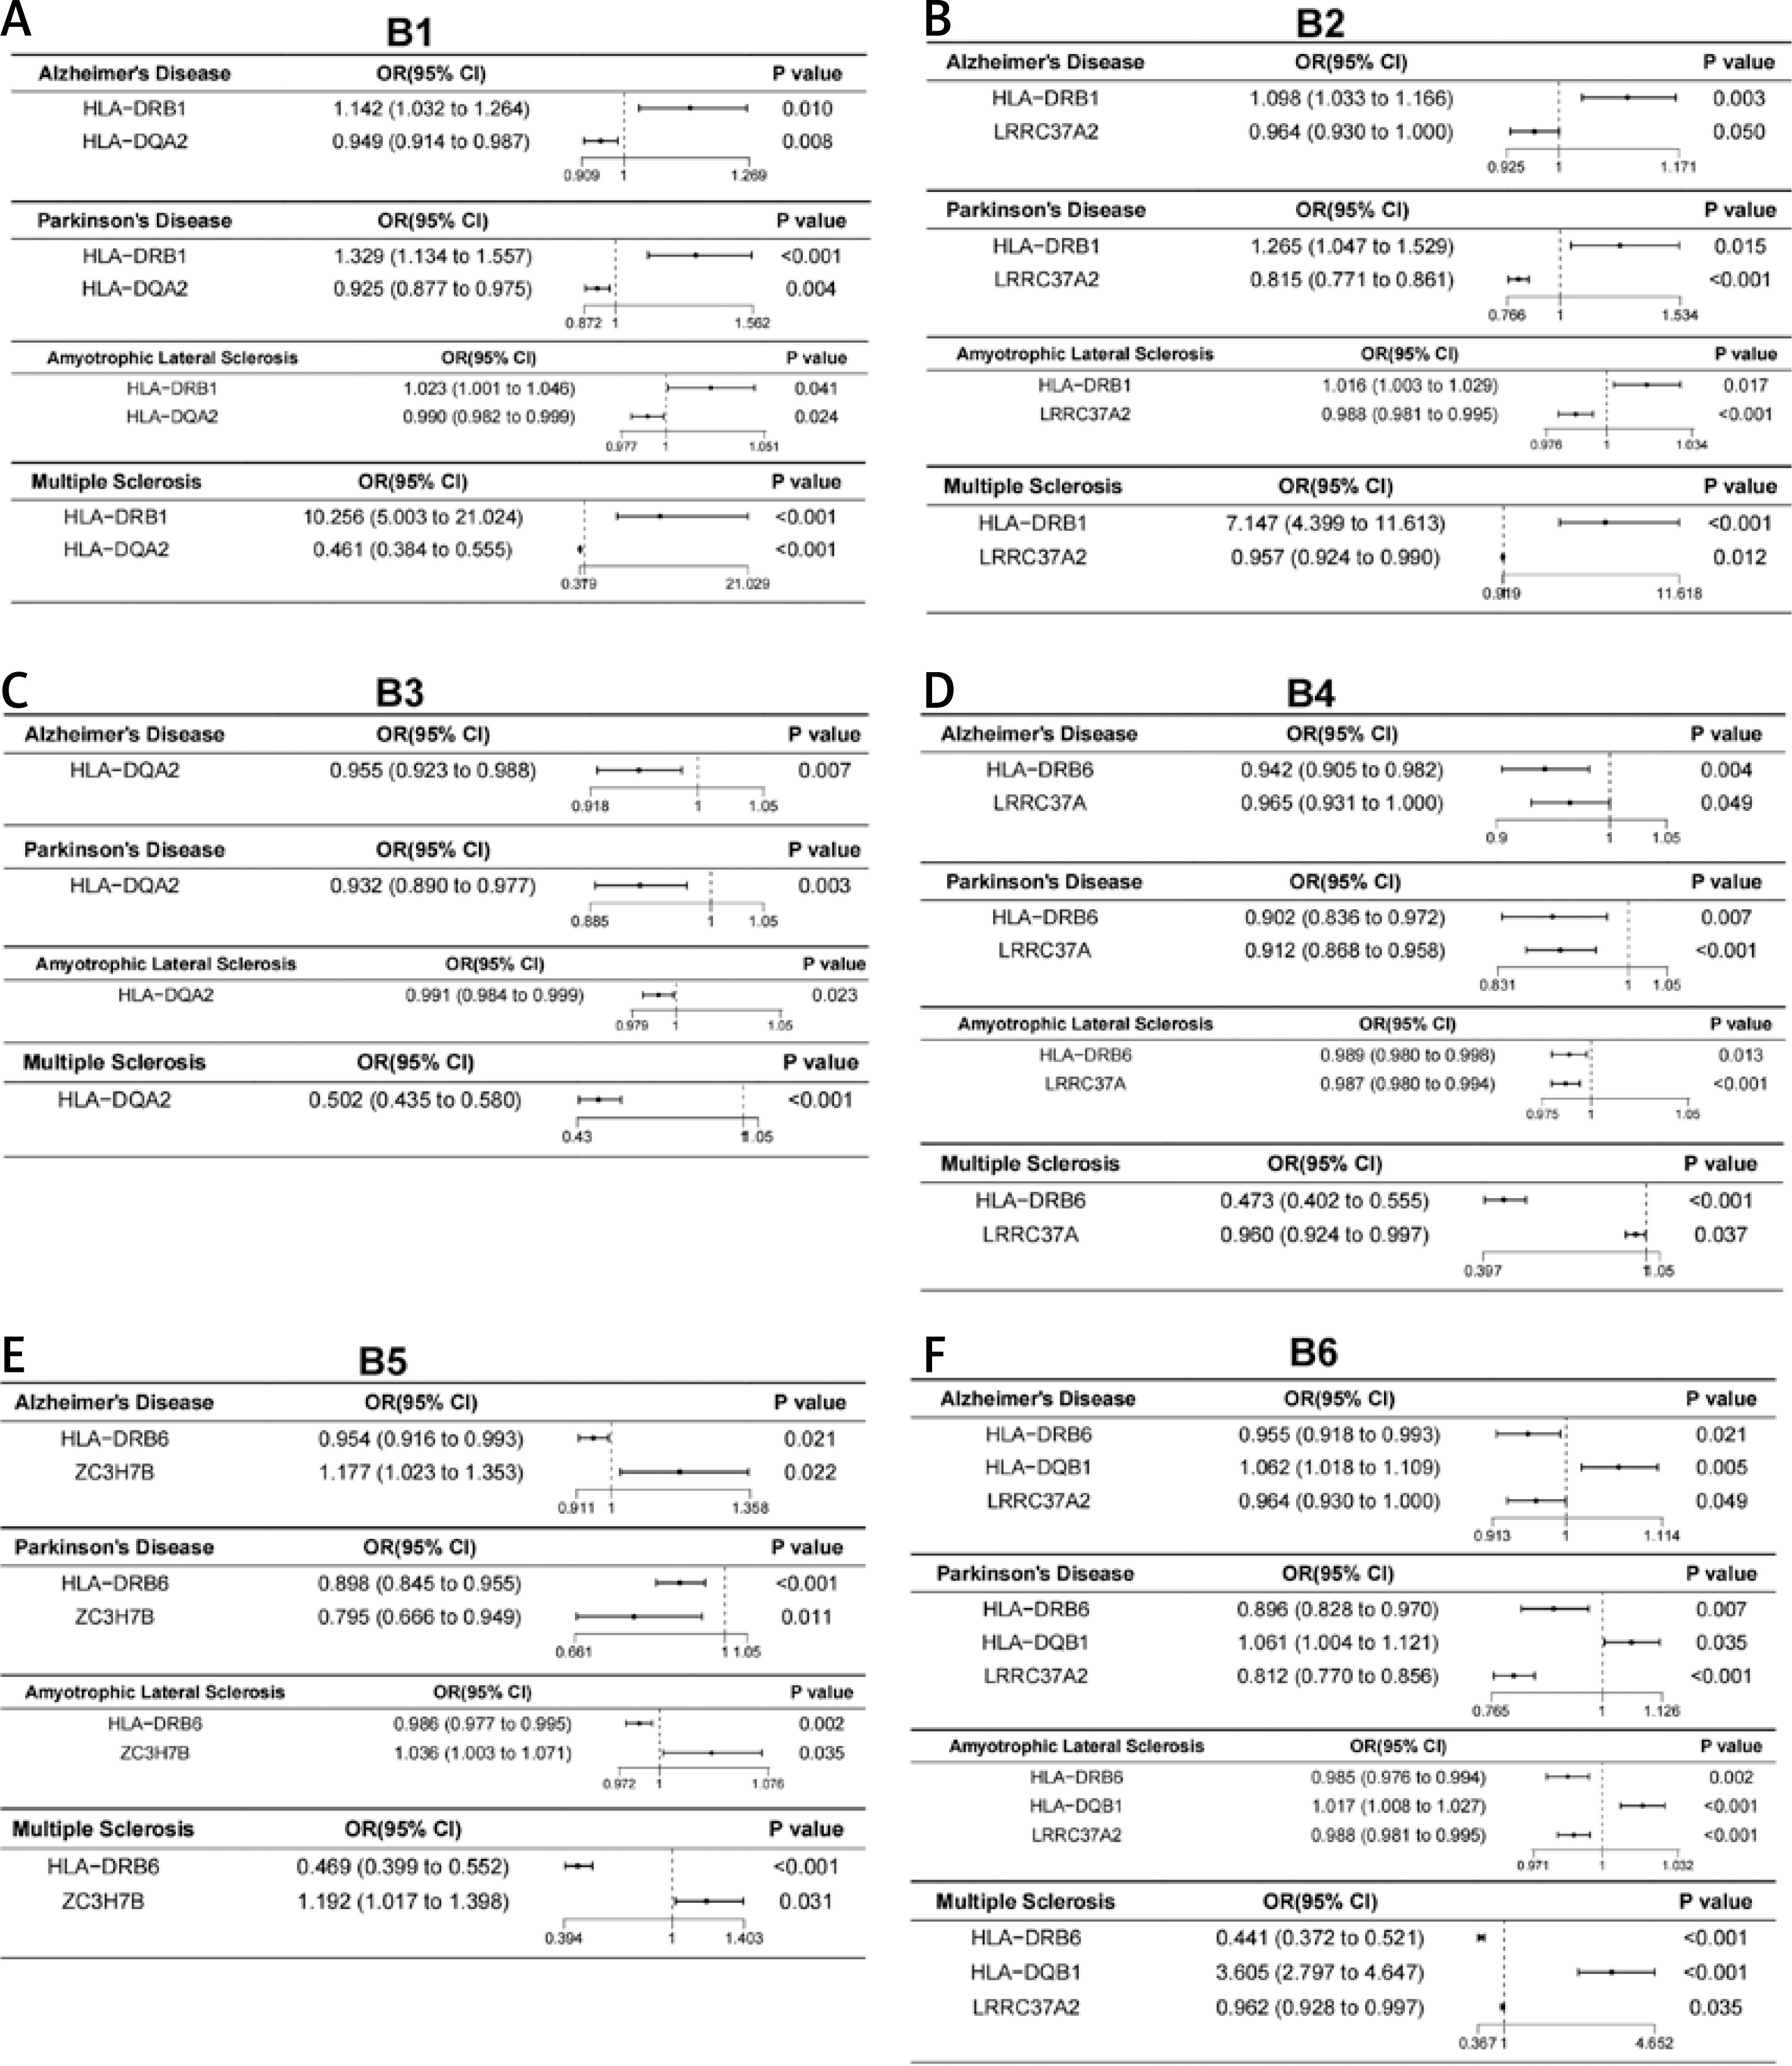
Figure 8
Forest plot showing genes with significant genetic associations and putative causal effects in regions A–F for all four neurodegenerative diseases. A (B7) – frontal cortex BA9; B (B8) – hippocampus; C (B9) – hypothalamus; D (B10) – nucleus accumbens basal ganglia; E (B11) – putamen basal ganglia; F (B13) – substantia nigra
Discussion
The intricate interplay between NDDs and brain structures is garnering increasing attention, particularly amid accelerating population aging. By leveraging MR analysis, this study systematically investigated potential causal relationships between brain structural alterations, gene expression across 13 brain regions, and four major NDDs (AD, PD, ALS, and MS). These findings may provide novel insights into the pathogenesis of NDDs and highlight the critical role of brain structure–gene expression interactions in disease etiology.
Aging, a key independent risk factor for NDDs, plays an indispensable role throughout the lifespan [23]. As age advances, systemic and organ functions decline progressively, with the brain being particularly vulnerable [24]. Aging-induced brain atrophy, reduced blood flow, altered neural circuitry, and cognitive decline not only impair brain function but also affect other tissues via neuroendocrine and inflammatory pathways [25, 26]. These structural and functional brain aging signatures likely serve as critical intermediaries linking brain health to NDD pathogenesis. This study aimed to investigate whether brain structure modulates NDD development and assess potential causal relationships between brain structural and gene expression profiles and NDD-related traits, thereby providing genetic insights into brain–NDD relationships in the context of aging.
Brain imaging-derived phenotypes have been widely applied in investigations of brain structure-disease relationships. Previous psychiatric studies leveraging these phenotypes have identified associations between gray matter volume in specific brain regions and anxiety symptoms. Other studies have utilized these phenotypes to dissect relationships between brain structure and cognitive impairment, as well as AD [27–29]. This study integrated brain imaging-derived phenotypes with MR analysis, identifying potential causal effects of multiple brain regions on NDD-related traits. For example, after FDR correction, several UDIPs remained significantly associated with AD, and these UDIPs were predominantly located in the frontal operculum cortex. As part of the cortical regions, the frontal operculum cortex may undergo morphological changes (e.g., volume reduction) or functional abnormalities during AD progression, leading to impairments in cognitive, executive, and language functions. Studies have shown that the frontal operculum cortex is among the brain regions most vulnerable to AD. Compared with controls, AD patients exhibit marked atrophy in this region, with significant volume reduction observed in the frontal operculum cortex [30]. Additionally, studies have indicated that abnormal functional connectivity in the frontal operculum cortex may correlate with cognitive decline [31]. In MS, several UDIPs remained significantly associated with MS after FDR correction, with most UDIPs strongly associated with the pallidum and caudate. Large-scale GWAS have demonstrated that volume variations in the pallidum and caudate are regulated by specific genetic factors [32, 33]. These genes may indirectly contribute to the pathogenesis of MS by modulating neurodevelopment or synaptic plasticity. For instance, certain genes associated with basal ganglia volume may concurrently regulate immune responses or myelin repair mechanisms, thereby increasing susceptibility to MS [33]. The association between the pallidum/caudate and MS may manifest through a genetic-structural-functional cascade. Future studies should integrate radiomics with multi-omics data to further characterize specific biological markers and therapeutic targets in MS. Collectively, these findings not only validate the critical role of brain structural alterations in NDD pathogenesis but also suggest that aging-related brain changes, driven by genetic factors, may exacerbate NDD progression.
The study also analyzed region-specific gene expression across 13 brain regions and identified significant relationships consistent with potential causal effects on NDDs. While previous studies have reported associations between these brain regions and NDDs, the specific mechanisms underlying their roles in aging-related NDDs progression remain incompletely understood. Further experimental validation is required to determine how age-related gene expression changes and functional alterations in these regions initiate or exacerbate NDDs. Our study identified significant associations between HLA (human leukocyte antigen) genes and these brain regions. HLA genes, located within the major histocompatibility complex (MHC), encode proteins critical for antigen presentation and adaptive immune responses [34, 35]. Recent studies have highlighted the role of HLA polymorphisms in modulating NDD risk and pathological progression. We observed widespread expression of HLA genes (e.g., HLA-DQA2, HLA-DQB1, HLA-DRB6, HLA-DRB1) across multiple brain regions, with all showing evidence of potential causal relationships with four major NDDs (AD, PD, ALS, MS). For example, HLA-DQA2 showed evidence of causal associations with all four NDDs in brain regions B1, B3, B9, B10, B11, and B13, while HLA-DRB6 showed similar relationships in regions B5, B6, B7, B8, B9, B11, and B13.
The HLA gene cluster, as a core component of the MHC, is located within the chromosomal region 6p21. This locus exhibits high genetic diversity and complex linkage disequilibrium architecture, making it one of the most strongly associated loci with NDDs in GWAS. This genetic signature provides a molecular basis for shared pathomechanisms across multiple NDDs [36]. These characteristics enable HLA genes to participate in the pathogenesis of neurodegenerative disorders through multiple immune-mediated pathways. Based on previous studies, we summarize five potential mechanisms (1. aberrant antigen presentation triggering adaptive immune responses, 2. immune cell dysfunction and inflammatory cascade amplification, 3. loss of immune tolerance and autoimmune attack, 4. immunoproteasome dysregulation and pathological effects of soluble HLA (sHLA), 5. cross-tissue immunomodulation) as follows:
(1) Aberrant antigen presentation triggers adaptive immune responses. HLA class II molecules (e.g., HLA-DRB1, HLA-DQA2) are pathologically overexpressed on antigen-presenting cells (APCs) such as microglia and astrocytes, where they recognize and present endogenous autoantigens – including misfolded proteins like β-amyloid (Aβ), α-synuclein, and tau characteristic of neurodegenerative diseases – to CD4+ T cells, initiating adaptive immunity [37]. In AD, early-onset patients exhibit elevated HLA class II-mediated autoantigen presentation (e.g., via HLA-DRB5-DRB1), promoting tau hyperphosphorylation and periplaque inflammatory infiltration around Aβ deposits; the HLA-DRB1*15:01 allele specifically binds Aβ epitopes, activating T cell-mediated inflammation that accelerates pathology [38, 39]. In PD, microglial uptake of α-synuclein forms HLA-II/antigen-peptide complexes, activating effector T cells to secrete pro-inflammatory cytokines (e.g., TNF-α, IFN-γ) that directly damage dopaminergic neurons, while HLA-DRB1 specifically mediates α-synuclein presentation to amplify adaptive immune responses [39, 40]. In MS, HLA genes present antigens like myelin basic protein, triggering T cell-mediated demyelination, with the HLA-DRB1*15:01 risk allele modulating T-cell polarization (e.g., Th1/Th17 differentiation) to drive neuroinflammation [21, 41].
(2) Immune cell dysfunction and inflammatory cascade amplification. HLA genes modulate functions of immune cells (e.g., microglia, B cells), influencing neuroinflammation intensity and disease progression. HLA-DQA2 overexpression enhances microglial phagocytic capacity for α-synuclein, mitigating protein aggregate damage in PD [42], whereas HLA-DRB1 risk alleles promote microglial release of pro-inflammatory cytokines (e.g., IL-6, TNF-α), exacerbating neuronal injury [43]. Single-cell sequencing reveals HLA-DQA2 upregulation in PD peripheral blood, concurrent with memory B-cell clonal expansion and AP-1 transcription factor activation, indicating enhanced B-cell antigen presentation that activates adaptive immunity to drive pathogenesis [42].
(3) Loss of immune tolerance and autoimmune attack. Genetic variations in the HLA region may disrupt central nervous system immune tolerance, triggering autoimmunity. In AD, the rs9271192 polymorphism within HLA-DRB5-DRB1 correlates with disease risk by breaking tolerance to neuronal antigens, inducing autoantibody-mediated attack [44]. In MS, HLA-DRB1*15:01 presents myelin antigens to breach tolerance, activating myelin-specific T-cell attacks that cause demyelination [41].
(4) Immunoproteasome dysregulation and pathological effects of sHLA. Chronic immunoproteasome activation generates neurotoxic antigenic peptides (e.g., HLA-A23/A24 complexes) through aberrant antigen processing, accelerating neuronal apoptosis [45]. Dementia patients with HLA-A23/A24 serotypes exhibit elevated plasma sHLA-I levels; its open conformation (lacking β2-microglobulin/peptide) binds neuronal inhibitory receptors (e.g., KIR3DL1), suppressing CD8+ T-cell function and inducing synaptic plasticity impairment [45].
(5) Cross-tissue immunomodulation. Emerging evidence implicates HLA genes in neurodegenerative diseases via the gut-brain axis. Gut microbiota metabolites (e.g., lipopolysaccharide) activate peripheral immune cells that migrate to the CNS, synergizing with HLA molecules to amplify neuroinflammation [46]. For instance, protective HLA-DRB6 alleles may attenuate ALS risk by suppressing microbiota-induced immune responses [47].
This study provides evidence supporting causal associations between HLA gene expression (HLA-DRB1, HLA-DQA2, HLA-DRB6) in multiple brain regions (amygdala, hippocampus, basal ganglia) and four major NDDs (AD, PD, ALS, MS), lending support to the potential universality of these immune mechanisms across NDDs. Specifically, HLA-DQA2 overexpression in basal ganglia correlates with protective effects in PD/MS, likely through modulating microglial phagocytosis and antigen presentation efficiency – consistent with prior evidence of HLA-mediated immunopathogenesis [36, 48]. Collectively, HLA genes participate in NDD development via antigen presentation, immune cell activation, tolerance regulation, and gut-brain crosstalk, providing a rationale for prioritizing these immune pathways in future experimental studies to evaluate their potential relevance to disease progression [49, 50]. Notably, sensitivity analyses using the HEIDI test provided crucial nuance regarding these associations. While the signals in MS showed evidence of heterogeneity – potentially reflecting the extensive linkage disequilibrium inherent to the MHC region in autoimmunity – the associations in neurodegenerative conditions (AD, PD, ALS) showed no evidence of heterogeneity. This distinction suggests a direct causal role for these immune regulators in neurodegeneration, distinct from the LD-driven pathology often observed in classical autoimmune diseases.
Notably, the ZC3H7B gene in the cerebellum (B5) showed evidence of differential associations across NDDs – protective for PD but detrimental for AD, ALS, and MS. This paradox may stem from tissue-specific gene regulatory networks: in PD, ZC3H7B potentially stabilizes dopaminergic synaptic transcripts, whereas in other NDDs, its pro-inflammatory interactions with glial cells may accelerate neurodegeneration. Just as with the APOE ε2 allele, in AD, APOE ε2 is associated with a protective effect by reducing Aβ accumulation and delaying cognitive decline, while in PD, APOE ε2 is associated with an increased risk of PD [51–53]. In methodological terms, because the selection of SNPs in MR analysis depends on the significance threshold in GWAS data, the SNPs significantly associated with ZC3H7B vary across GWAS for different diseases. This may lead to inconsistent effect directions. Therefore, the observed divergent associations should be interpreted as hypothesis-generating and require further validation. Future studies require single-cell multi-omics approaches to elucidate the cell-type-specific roles of ZC3H7B in cerebellar subregions.
This study holds significant implications and methodological strengths. For the first time, MR analysis was employed to investigate genetic and potentially causal relationships between brain structure and four major NDDs, offering novel insights into disease pathogenesis. These findings may advance understanding of mechanisms underlying NDDs and provide evidence consistent with a potential causal role of brain structural alterations in NDDs. Additionally, the use of MR analysis helped mitigate confounding factors and reverse causation, while large-scale GWAS datasets minimized weak instrument bias and enhanced statistical power.
Finally, a major limitation of this study is the predominant reliance on GWAS summary statistics derived from individuals of European ancestry. While this strategy minimizes bias due to population stratification, it restricts the generalizability of our findings to other ethnic groups (e.g., Asian or African populations). This limitation is particularly critical for our findings within the HLA/MHC region. The major histocompatibility complex exhibits highly complex and population-specific LD structures. Consequently, the potential causal associations identified here for HLA genes might be driven by specific LD patterns unique to European populations and may not be replicable in populations with different haplotype structures. Future studies utilizing large-scale multi-ancestry GWAS data are urgently needed to validate the cross-population stability of these neurodegenerative disease targets. We assessed the robustness of our findings in the MHC region through the HEIDI test (P HEIDI > 0.05), which evaluates whether observed SMR associations are consistent with a shared causal variant or may be driven by linkage disequilibrium. While we used a standard 100 kb window for cis-eQTLs – consistent with recent methodologies identifying HLA-DQA2 as a causal target [50] – we acknowledge that the extensive LD in the MHC region remains a challenge. Future studies incorporating fine-mapping or larger genomic windows may further refine these associations.
In conclusion, this study provides genetic evidence suggesting potential causal relationships between brain structure, gene expression across distinct brain regions, and four major NDDs (AD, PD, ALS, and MS), thereby providing a new direction for investigating NDD pathogenesis. Future research should expand sample populations to include diverse ethnic groups and further investigate the biological mechanisms potentially underlying aging-related NDD progression, laying a foundation for future functional studies to test and further evaluate these genetically predicted associations.

