Introduction
Obesity is a global pandemic, with profound clinical, social, and economic consequences [1]. It is a complex, metabolic disease resulting from the expansion of adipose tissue, which depends on the interplay between hyperplasia (proliferation and differentiation of adipose precursor cells) and hypertrophy (increase in adipocyte size) [2]. Recent studies indicate that mitochondrial dysfunction caused by excessive nutrient supply that overwhelms the Krebs cycle and the mitochondrial respiratory chain may be associated with the development of obesity, oxidative stress, and inflammation [3, 4]. Prevention of mitochondrial dysfunction is a potential tool to combat obesity.
Among the factors influencing mitochondrial activity and adipocyte metabolism, the adipomyokine irisin has been clearly associated with an increase in energy expenditure due to its ability to stimulate the browning of white adipose tissue (WAT) [5]. Browning of WAT is a process of trans-differentiation from white to beige adipocytes, involving mitochondrial biogenesis, uncoupling of the mitochondrial respiratory chain and switch from energy accumulation to energy dissipation. Thus, strategies aimed at promoting WAT browning may have great potential to improve metabolism and treat obesity, due to the ability of brown adipose tissue (BAT) to dissipate energy through thermogenesis [6]. Recent studies have shown that irisin levels, in addition to physical activity, can also be influenced by diet and certain specific drugs (such as metformin, fenofibrate, and all-trans retinoic acid) [7]. Irisin exerts beneficial effects on energy homeostasis [8], reduces systemic inflammation [9], modulates metabolic processes [10], and increases the whole body metabolic rate by inducing glucose transporter 4 (GLUT-4) expression and stimulating glycolysis in adipocytes [11].
Glucagon-like peptide-1 (GLP-1) and glucose-dependent insulinotropic polypeptide (GIP) are known incretin hormones in humans, released predominantly in the intestine [12]. These hormones are secreted in response to nutrient intake and stimulate insulin secretion from the pancreas [13]. GLP-1 exerts its effects through the GLP-1 receptor (GLP-1R) in multiple tissues, including the pancreas, kidneys, adipose tissue, brain, and smooth muscles [14]. GLP-1, besides its role in glucose homoeostasis, reduces appetite, food intake, and body weight [15]. Due to the short half-life of native GLP-1, GLP-1 receptor agonists (GLP-1RAs) have been developed for therapeutic purposes, such as exendin-4, introduced for the treatment of type 2 diabetes (T2D) in the mid-2000s [16]. Over the last decade, GLP-1RA has also gained considerable attention as an effective anti-obesity agent [17–19].
Obese patients with type 2 diabetes treated with exenatide have been shown to have significantly increased irisin levels, which correlated with improved metabolic profiles [20], thus suggesting a possible interaction between irisin and incretin hormones. In addition, both the GLP-1 insulinotropic effects and irisin levels are defective in T2D, and their exogenous administration is able to improve glycemic control [21, 22]. Furthermore, some researchers suggest that irisin can be considered an incretin hormone because its secretion is influenced by meals and increases insulin secretion in a glucose-dependent manner [23]. Thus, both peptides share direct pancreatic effects. Recent studies suggested that, albeit through different receptor pathways, irisin and GLP-1 activate the same intracellular signaling proteins, e.g. PI-3K, AKT, CREB, and ERK1/2 [23].
Based on these reports, the aim of the study was to investigate the effect of exendin-4 on mitochondrial function in human preadipocytes, as well as on selected adipokines and irisin secretion. Additionally, expression of the FNDC5 gene as a precursor of irisin and the NAMPT gene as a precursor of visfatin was examined to validate the results of irisin and visfatin protein secretion.
Material and methods
Cell culture
Chub-S7 is an immortalized cell line provided by Nestle Research Center (Lausanne, Switzerland). These cells, derived from subcutaneous abdominal adipose tissue, preserved their adipogenic capacity and can differentiate into mature adipocytes [24]. The Chub-S7 cells (Nestle Research Center, Lausanne, Switzerland) were cultured in a mixture of DMEM/Ham’s F12 1 : 1 (Sigma) supplemented with 10% fetal bovine serum (Sigma). The cells were incubated in a basal medium consisting of serum-free DMEM/F12 medium, supplemented with 17 µM D-pantothenic acid (Sigma), 33 µM d-biotin (Sigma), 5 µg/ml transferrin (Sigma), 1 nM triiodothyronine (Sigma), 5 µg/ml insulin (Sigma), 500 µg/ml fetuin (Sigma), and 5 ng/ml selenium (Sigma). The Chub-S7 cells were differentiated into mature adipocytes by adding 1 µM dexamethasone (Sigma) and 1 µM rosiglitazone (Cayman). For the first 48 h of differentiation, 500 µM IBMX (Sigma) was additionally added. The differentiation process lasted 21 days. The differentiated adipocytes were exposed to the following factors for 24 h: irisin (250 ng/ml) or GLP-1R agonist exendin-4 (Ex-4) (100 nM) or GLP-1R antagonist exendin-9 (Ex-9) (100 nM).
Oil-Red-O staining
In order to assess the differentiation of Chub-S7 adipocytes, lipid droplets in cells were stained with red oil dye. The cells were fixed using a 4% solution of paraformaldehyde (POCH, Gliwice, Poland) and then incubated for 1 h with red oil dye (Sigma), according to the protocol provided by the manufacturer. Next, these cells were visualized under a Nikon ECLIPSE TS100 microscope.
Protein secretion
Irisin, visfatin/NAMPT, and adiponectin levels in the culture medium/cell lysate were measured using enzyme-linked immunosorbent assay (ELISA). Irisin levels were measured using an Irisin ELISA Kit (limit of quantification [LoQ] – 1 ng/ml; BioVendor-Research and Diagnostic Products, Brno, Czech Republic). Human visfatin (NAMPT) (IntraCellular) ELISA Kit (LoQ – 30 pg/ml; BioVendor-Research and Diagnostic Products, Brno, Czech Republic) was used to measure visfatin levels. For visfatin determinations, 10× diluted culture medium was used, and for intracellular NAMPT determinations, 1000× diluted cell lysate was used. Results from NAMPT were calculated with Magellan 6 software as pg NAMPT and then adjusted for protein content and reported as pg NAMPT/mg of cell protein. Protein content was measured in the cell lysate samples using a Total Protein Kit, Micro Lowry, Peterson’s Modification (Sigma). Adiponectin was measured using a Human Total Adiponectin/Acrp30 ELISA Kit (LoQ – 0.891 ng/ml; Bio-Techne, R&D Systems, USA). All the steps were performed strictly in accordance with the kit instructions.
Relative gene expression
The quantitative expression analysis of UCP1, UCP2 (uncoupling proteins), NAMPT (nicotinamide phosphoribosyltransferase), and FNDC5 (fibronectin type III domain-containing protein 5) was performed by real-time PCR using 18S rRNA (Hs03003631_g1) (Applied Biosystems) as the reference gene.
Following incubation, total RNA was isolated from cells using the TRIzol Plus RNA Purification System (Life Technologies, Carlsbad, CA, USA). The quality of RNA was assessed using a Nano-Drop spectrophotometer (Thermo Fisher Scientific, Wilmington, DE, USA). One microgram of total RNA was reverse transcribed using a reverse transcription kit (High Capacity cDNA Reverse Transcription Kit (Applied Biosystems, Carlsbad, CA, USA) with random primers. Subsequently, cDNA was subjected to real-time PCR. Quantitative real-time polymerase chain reaction (qPCR) was performed with TaqMan Gene Expression Assays, according to the manufacturer’s protocol using TaqMan primers for UCP1 (Hs00222453_m1), UCP2 (Hs01075227_m1), NAMPT (Hs00237184_m1), and FNDC5 (Hs00401006_m1) (Applied Biosystems, Carlsbad, CA, USA). Amplification was performed using the continuous fluorescence detection system 7900 HT Fast Real Time PCR system (Applied Biosystems, Carlsbad, CA, USA). Data were obtained in a form of sigmoid amplification plots in which fluorescence was plotted against the number of cycles. The threshold cycle (CT) served as a measurement of the starting template amount in each sample. Expression ratio was calculated as the normalized CT difference between the control probe and the sample.
Oxygen consumption
Mitochondrial respiration was determined by high-resolution respirometry using an Oxygraph-2k (O2k; OROBOROS Instruments, Austria, Innsbruck) according to the phosphorylation control protocol for intact cells [25]. For respirometric analysis, cells were cultured in 25 cm2 flasks, trypsinized and counted in a Bürker chamber. Then, the cell suspension was diluted with cultured medium to an appropriate concentration of 106 cells/ml and 2 ml samples of cell suspension were added to the Oxygraph chambers. The protocol according to Dunham-Snary et al. [26] was used. The following working concentrations for each mitochondrial effector were selected: 2 µg/ml oligomycin, 0.5–3.0 µM FCCP (p-trifluoromethoxy carbonyl cyanide phenyl hydrazone), 12 µM antimycin A (AA), and 3 µM rotenone (Rote). Before each experiment, the polarographic oxygen sensors (OroboPOS, POS) were calibrated by a two-point calibration, routinely achieved at air saturation and zero oxygen concentration according to the protocol described by Gnaiger et al. [27]. Accordingly, static calibration involved the determination of the constant signal of the POS recorded at 100% and 0% air saturation (achieved with Na-dithionite, OroboPOS-Service Kit) under the particular experimental conditions (temperature, signal amplification by electronic gain, polarization voltage, stirring speed, medium). The procedure used for background correction has been described in detail by Gnaiger et al. [28].
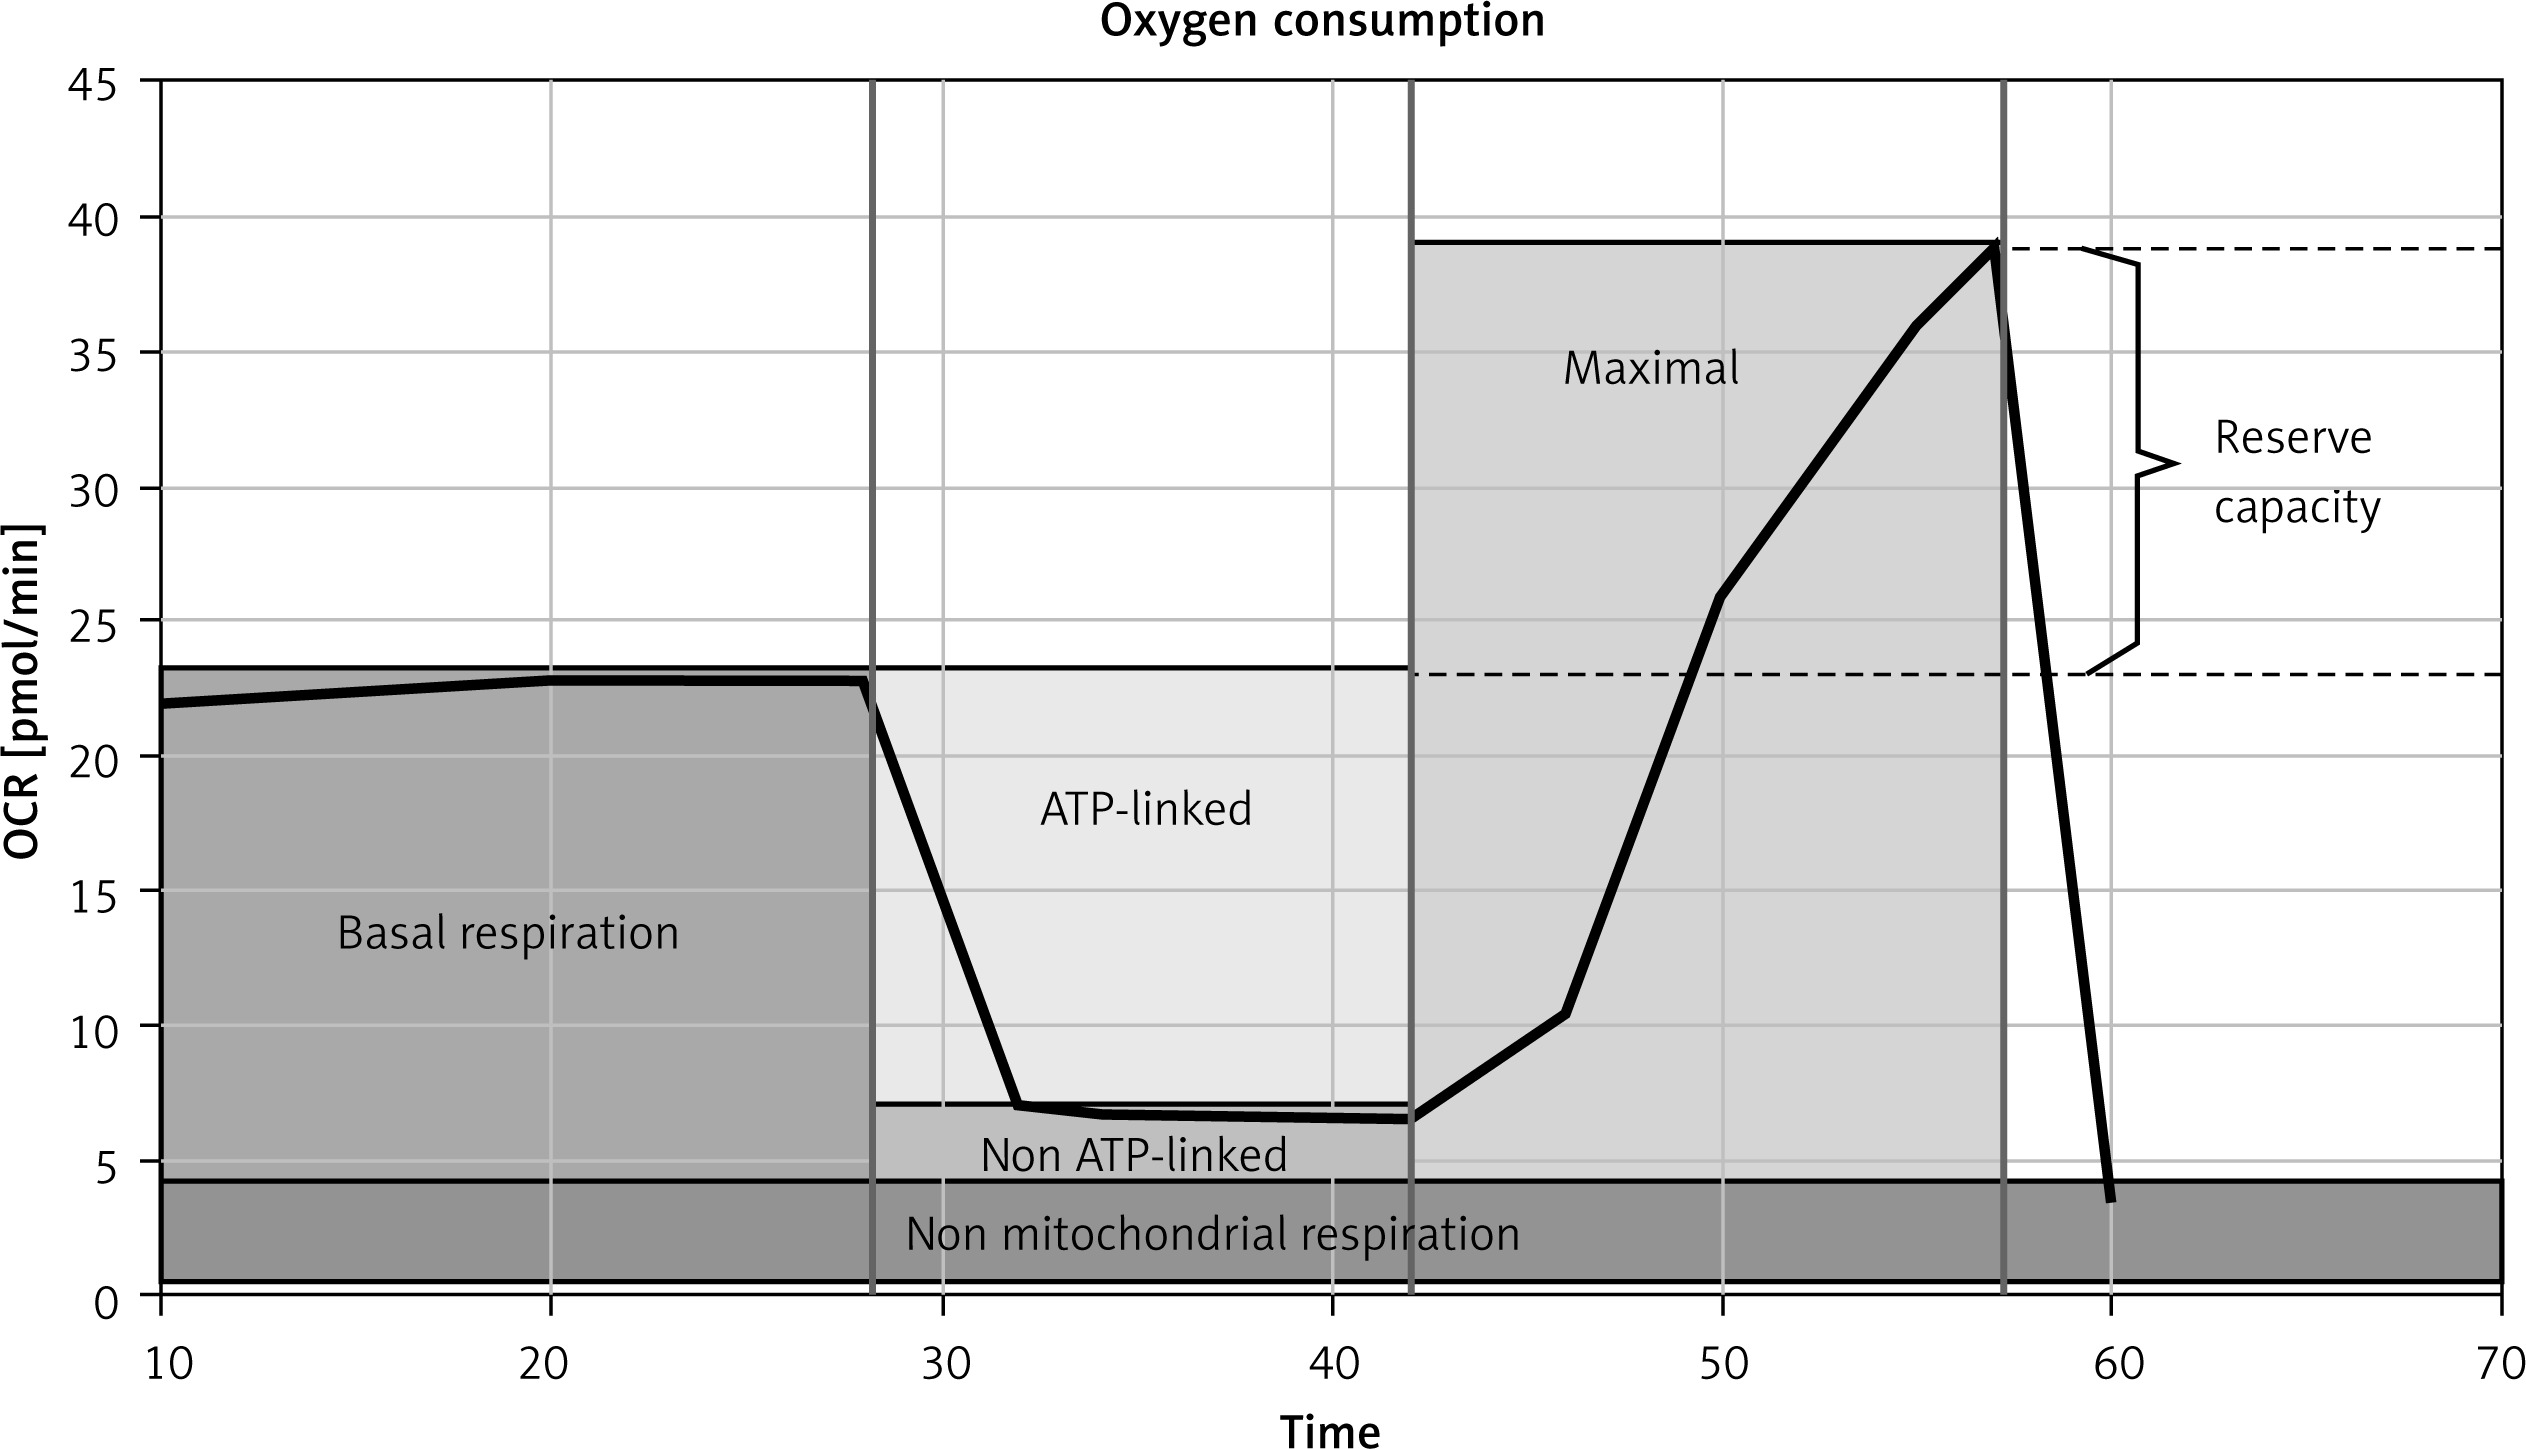
The protocol for oxygen consumption rate (OCR) measurement in the intact cells included in sequence: (I) a short period of routine respiration (routine), reflecting the aerobic metabolic activity under cellular routine conditions; (II) oligomycin, which is an ATP synthase inhibitor and blocks oxidative phosphorylation and the electron transport chain; (III) FCCP titration, which yields the maximum stimulated respiration, as a measure of electron transport system capacity of uncoupled mitochondria; (IV) antimycin A – an inhibitor of mitochondrial respiratory complex III – and rotenone – an inhibitor of mitochondrial respiratory complex I. Cellular bioenergetic parameters including ATP- and non-ATP-linked oxygen consumption as well as maximal oxygen consumption and reserve capacity were calculated (Figure 1).
Intracellular ATP content
The intracellular ATP content was measured using the ATPlite Luminescence ATP Detection Assay System (Perkin Elmer, Waltham, MA, USA), according to the protocol provided by the manufacturer, and the luminescence was measured using a Tecan Genios microplate reader (Thermo Fisher). Results were calculated with Magellan 6 software as nmol ATP and then normalized for protein content in the sample. Protein content was measured in the samples of cell lysates using a Total Protein Kit, Micro Lowry, Peterson’s Modification (Sigma). Finally, results were reported as nmol ATP/mg of cell protein.
Statistical analysis
All data were expressed as the mean ±S.D. from three independent experiments (biological replicates) measured in technical triplicates. Statistical significance for comparisons between treated and control cell samples was determined by the unpaired t-test using Statistica 10.0 PL software.
Results
Cell differentiation
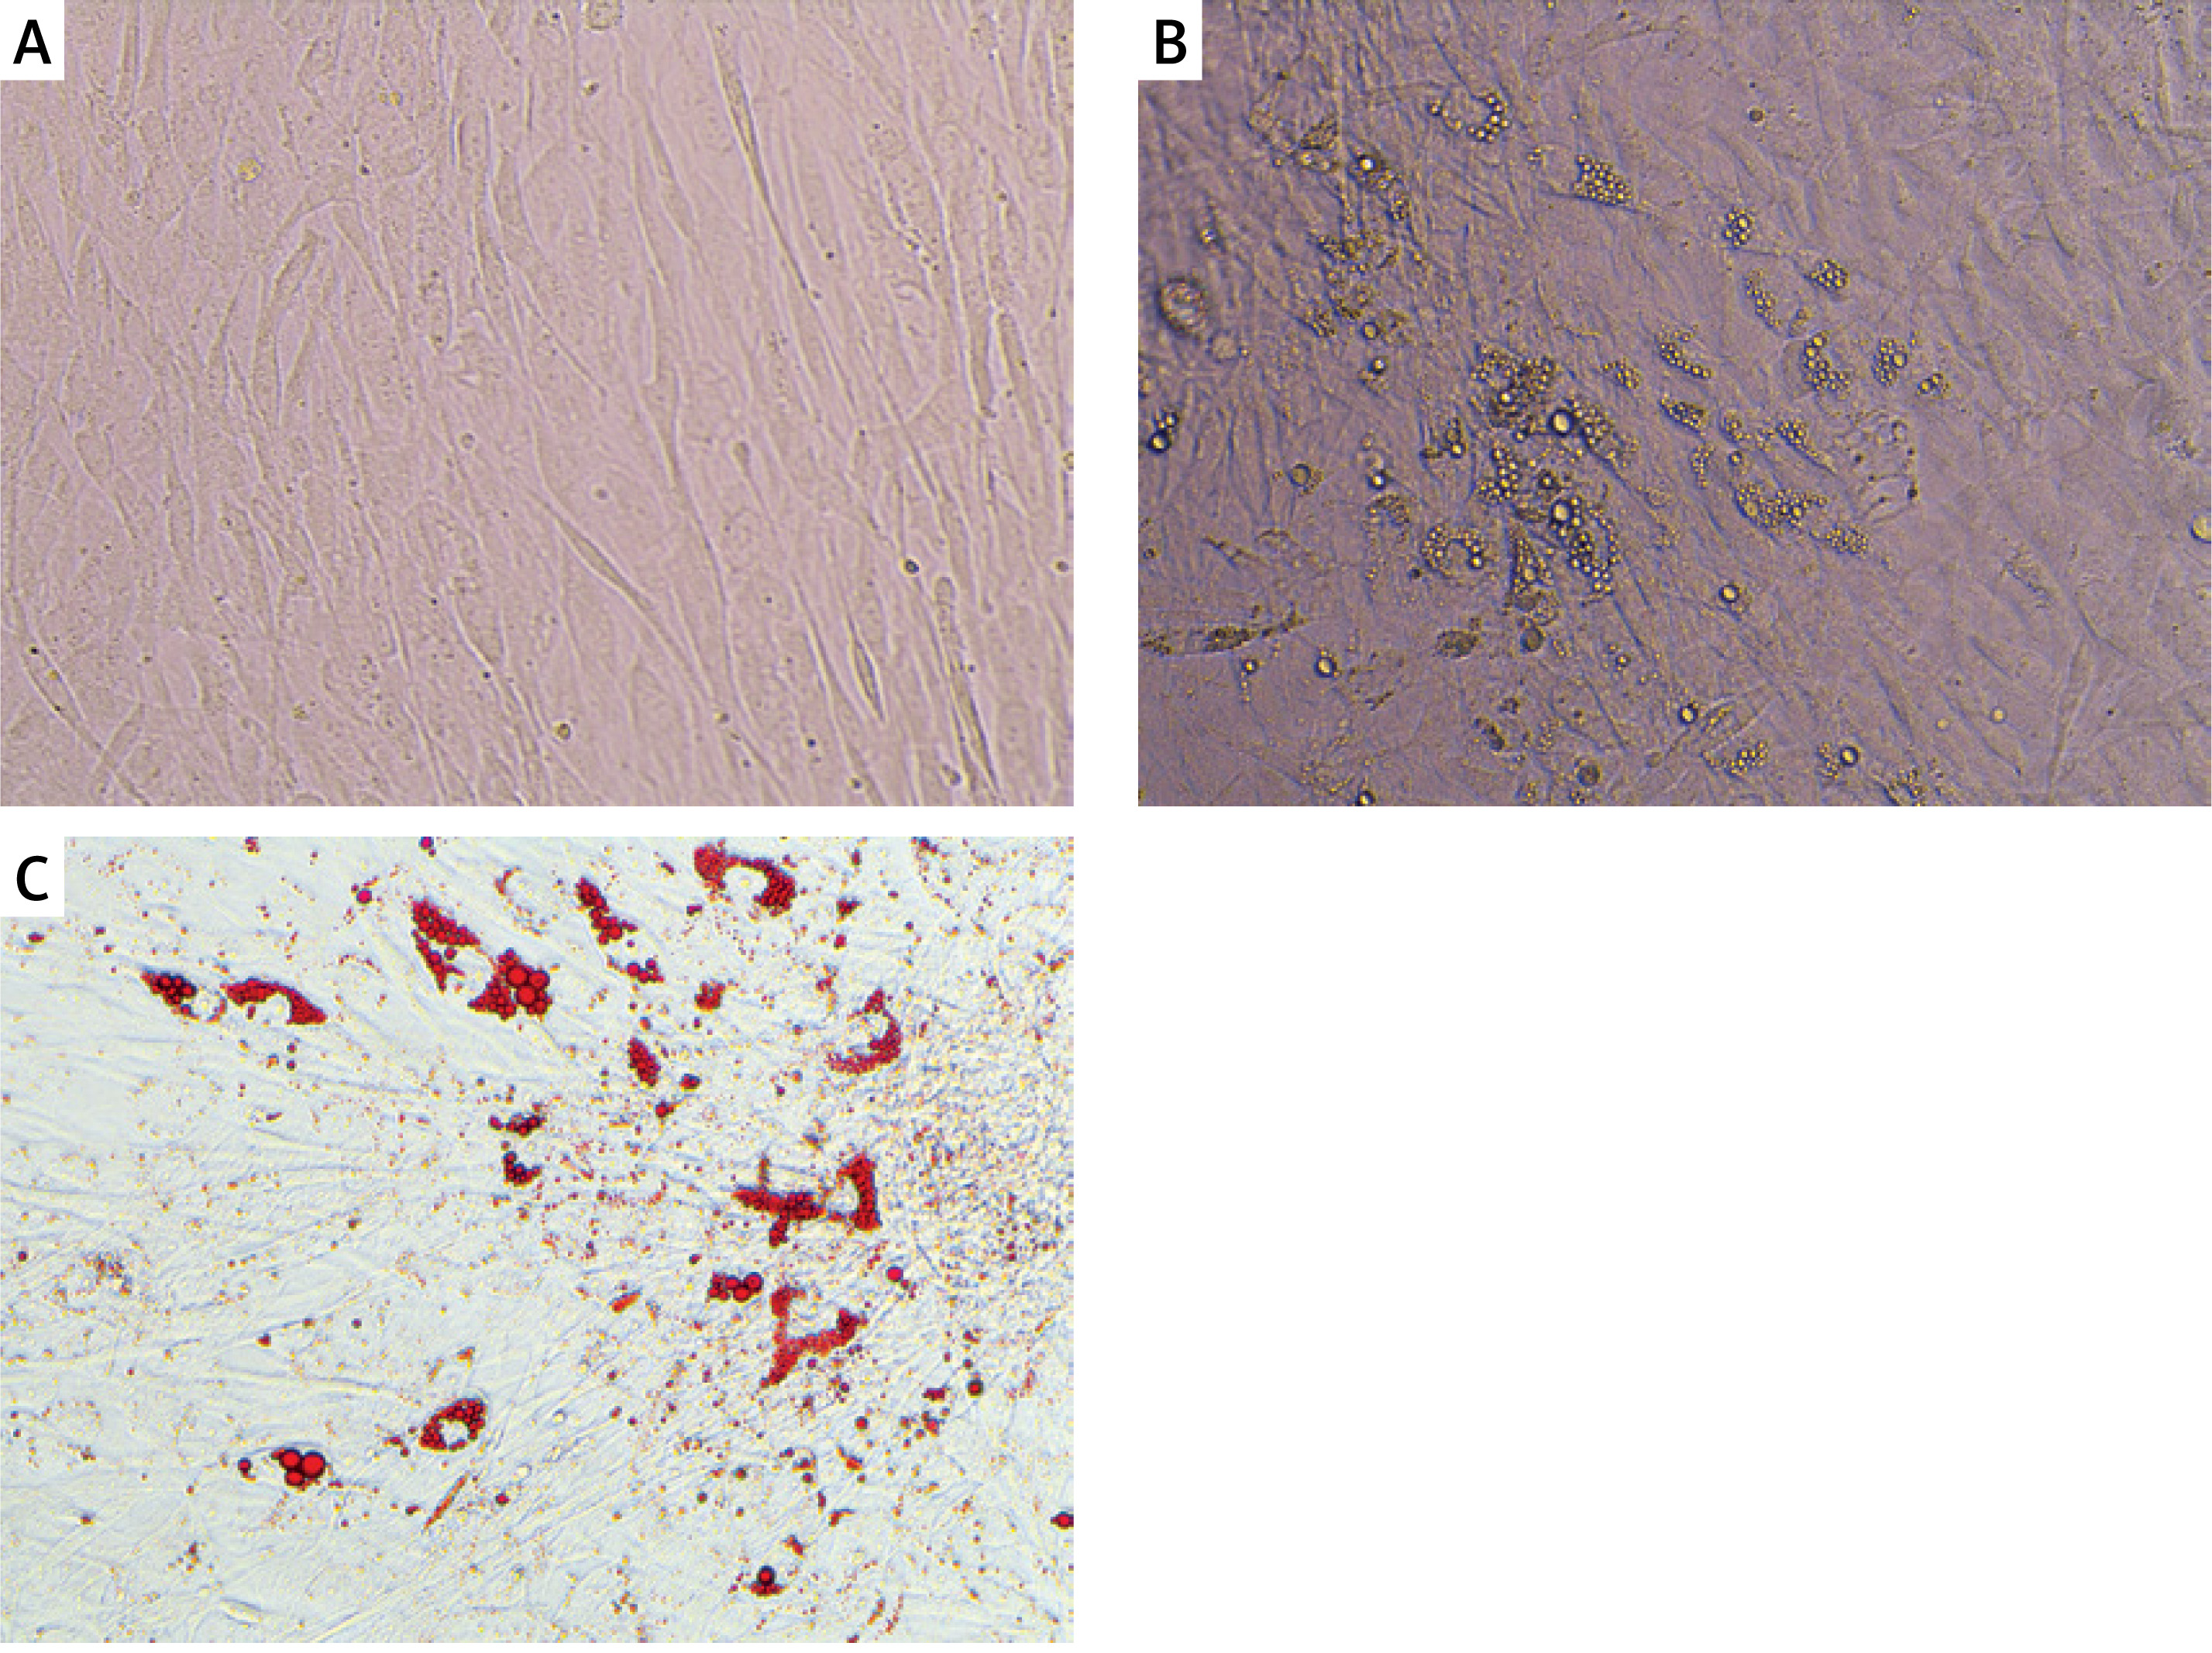
Changes in morphology of Chub-S7 cells and lipid droplet accumulation were observed using light microscopy. After 21 days of differentiation, the cells were stained with Oil Red-O. The lipid droplets in the cells turned red (Figure 2), which confirmed that preadipocytes differentiated into mature, functional adipocytes, used for further research.
Protein secretion
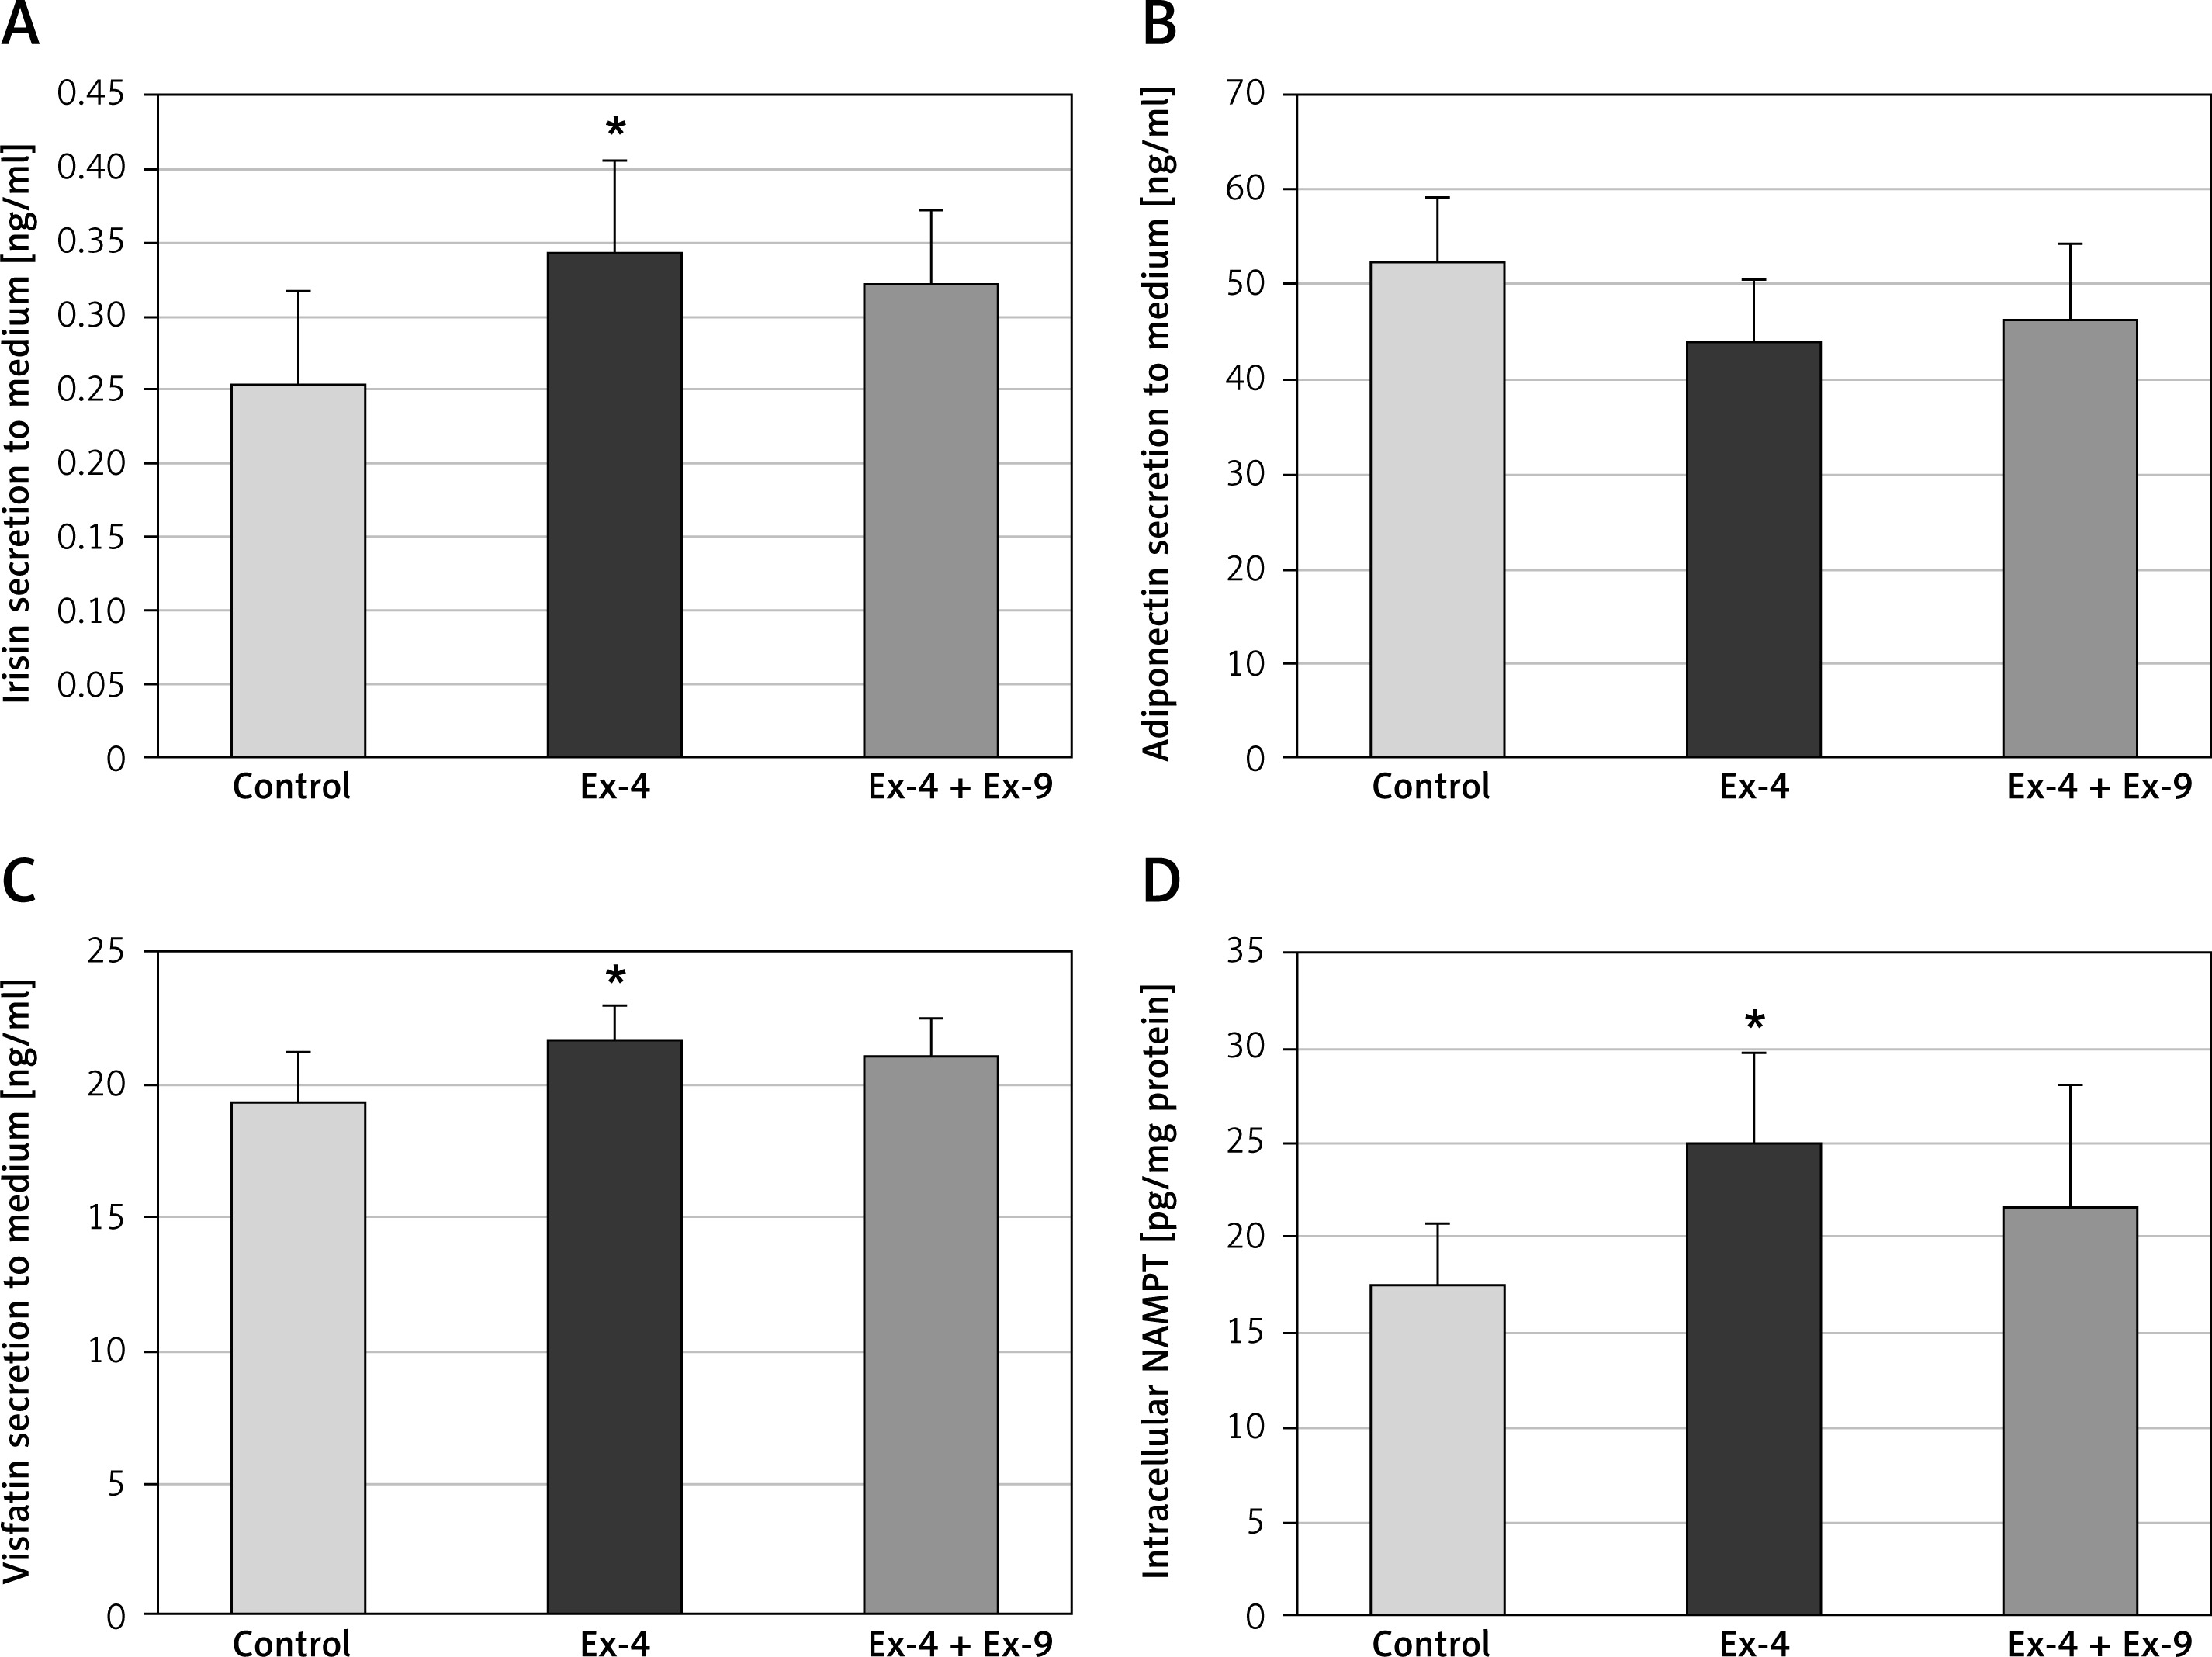
Analysis of protein secretion indicated that Chub-S7 cells exposed to Ex-4 released significantly more irisin (Figure 3 A) and visfatin (Figure 3 C) to cell culture supernatant and presented a higher intracellular NAMPT level than control cells (Figure 3 D). In the case of adiponectin, no significant changes were observed in Chub-S7 cells incubated with Ex-4 (Figure 3 B). To confirm the specificity of effects exerted by Ex-4 in Chub-S7 cells, the experiments were repeated using 100 nM exendin-9, a GLP-1 receptor antagonist, which reverted the effects of Ex-4 on protein secretion.
Figure 3
(A) Irisin, (B) adiponectin, (C) visfatin, and (D) NAMPT were measured by enzyme-linked immunosorbent assay (ELISA) in cell culture supernatant (A, B, C) or cell lysate (D) after exposure to exendin-4 (Ex-4) (100 nM, 24 h) or exendin-4 (100 nM, 24 h) along with exendin-9 (100 nM, 24 h) (Ex-4 + Ex-9). Values are presented as mean + SD (n = 3) and were analyzed using a t-test; *p < 0.05 compared to control
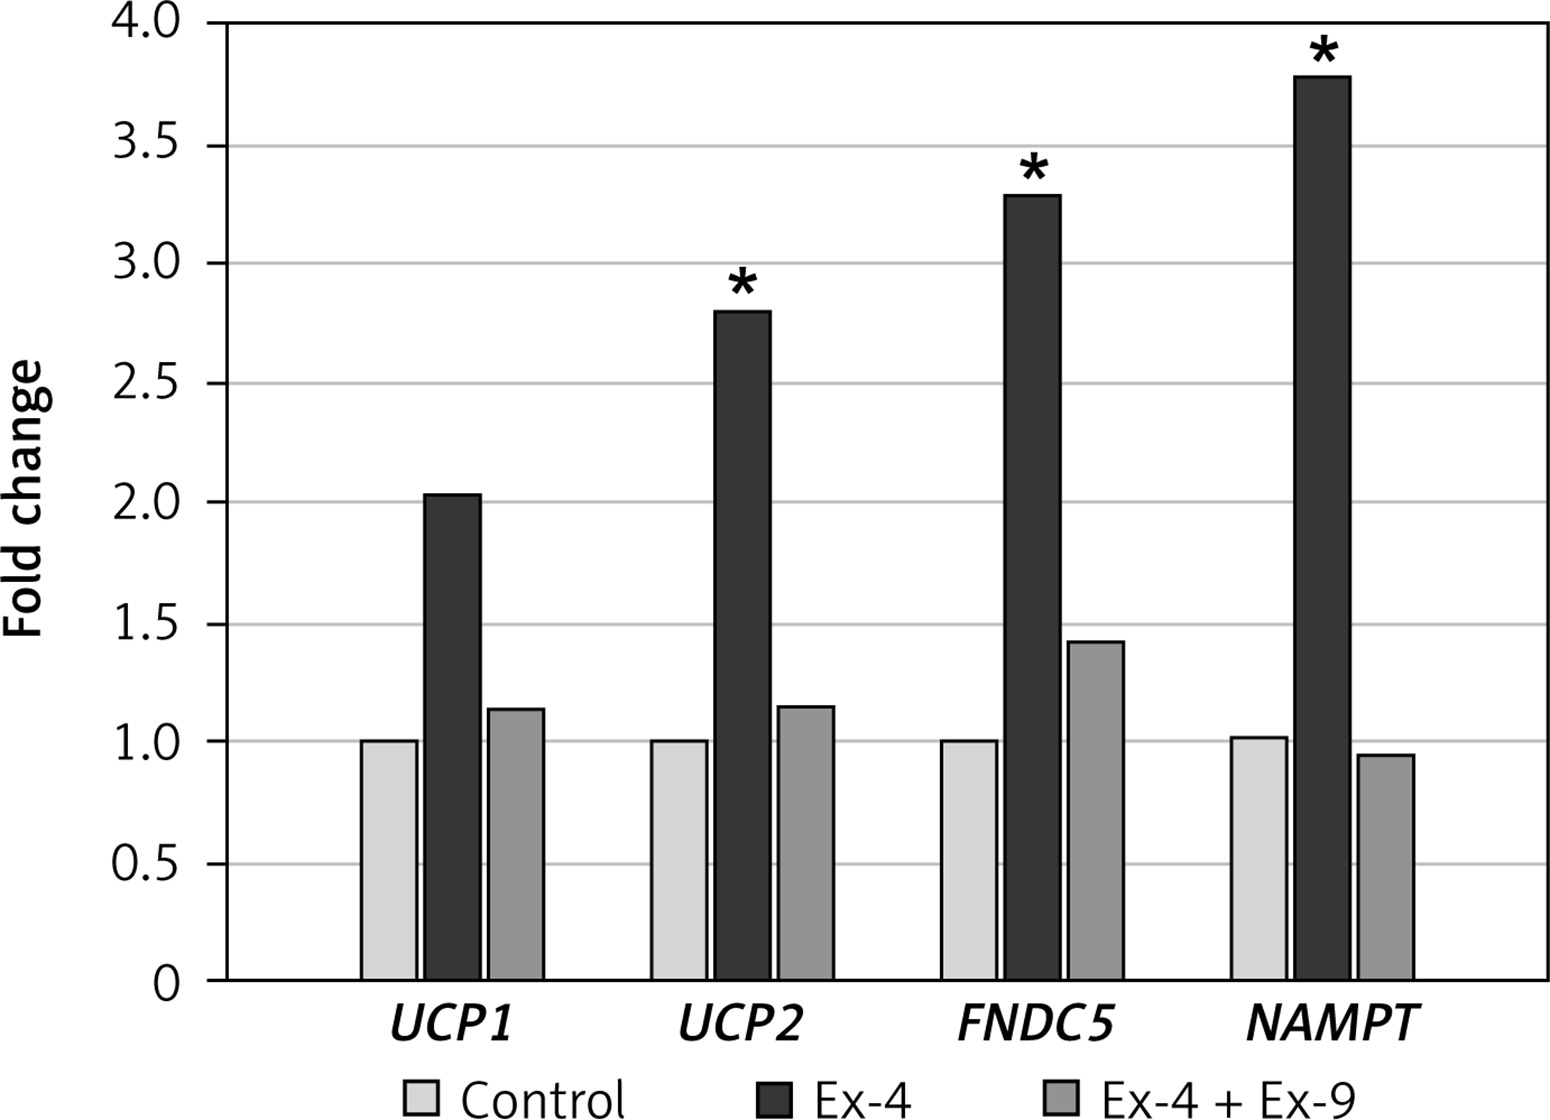
Gene expression
Selected genes were examined: (i) genes related to mitochondrial uncoupling (UCP1, UCP2), (ii) the gene encoding transmembrane protein fibronectin type III domain-containing protein 5 precursor of irisin (FNDC5), and (iii) the gene involved in NAD+ synthesis (NAMPT) (Figure 4). The expression of UCP genes is related to discharge of the proton gradient that is generated by the mitochondrial respiratory chain. The UCP2 gene was upregulated in Chub-S7 cells incubated with Ex-4, while the expression of the UCP1 gene only tended to be slightly increased in Ex-4 treated cells. Ex-4 increased more than threefold the expression of the FNDC5 gene, coding for irisin, and NAMPT, coding for a key nicotinamide adenine dinucleotide (NAD) biosynthetic enzyme in mammals. Exendin-9 abolished these effects of GLP-1 receptor agonist, thus confirming that they were related to Ex-4.
Oxygen consumption
Mitochondrial respiration was analyzed by high-resolution respirometry using an Oxygraph-2k system.
Exploratory observations of oxygen consumption revealed differences between cells treated with irisin or Ex-4 and control cells. The addition of exendin-9 together with Ex-4 abolished the effect of GLP-1RA (Table I).
Table I
Oxygen consumption rates (OCR) measured by high resolution respirometry in Chub-S7 cells
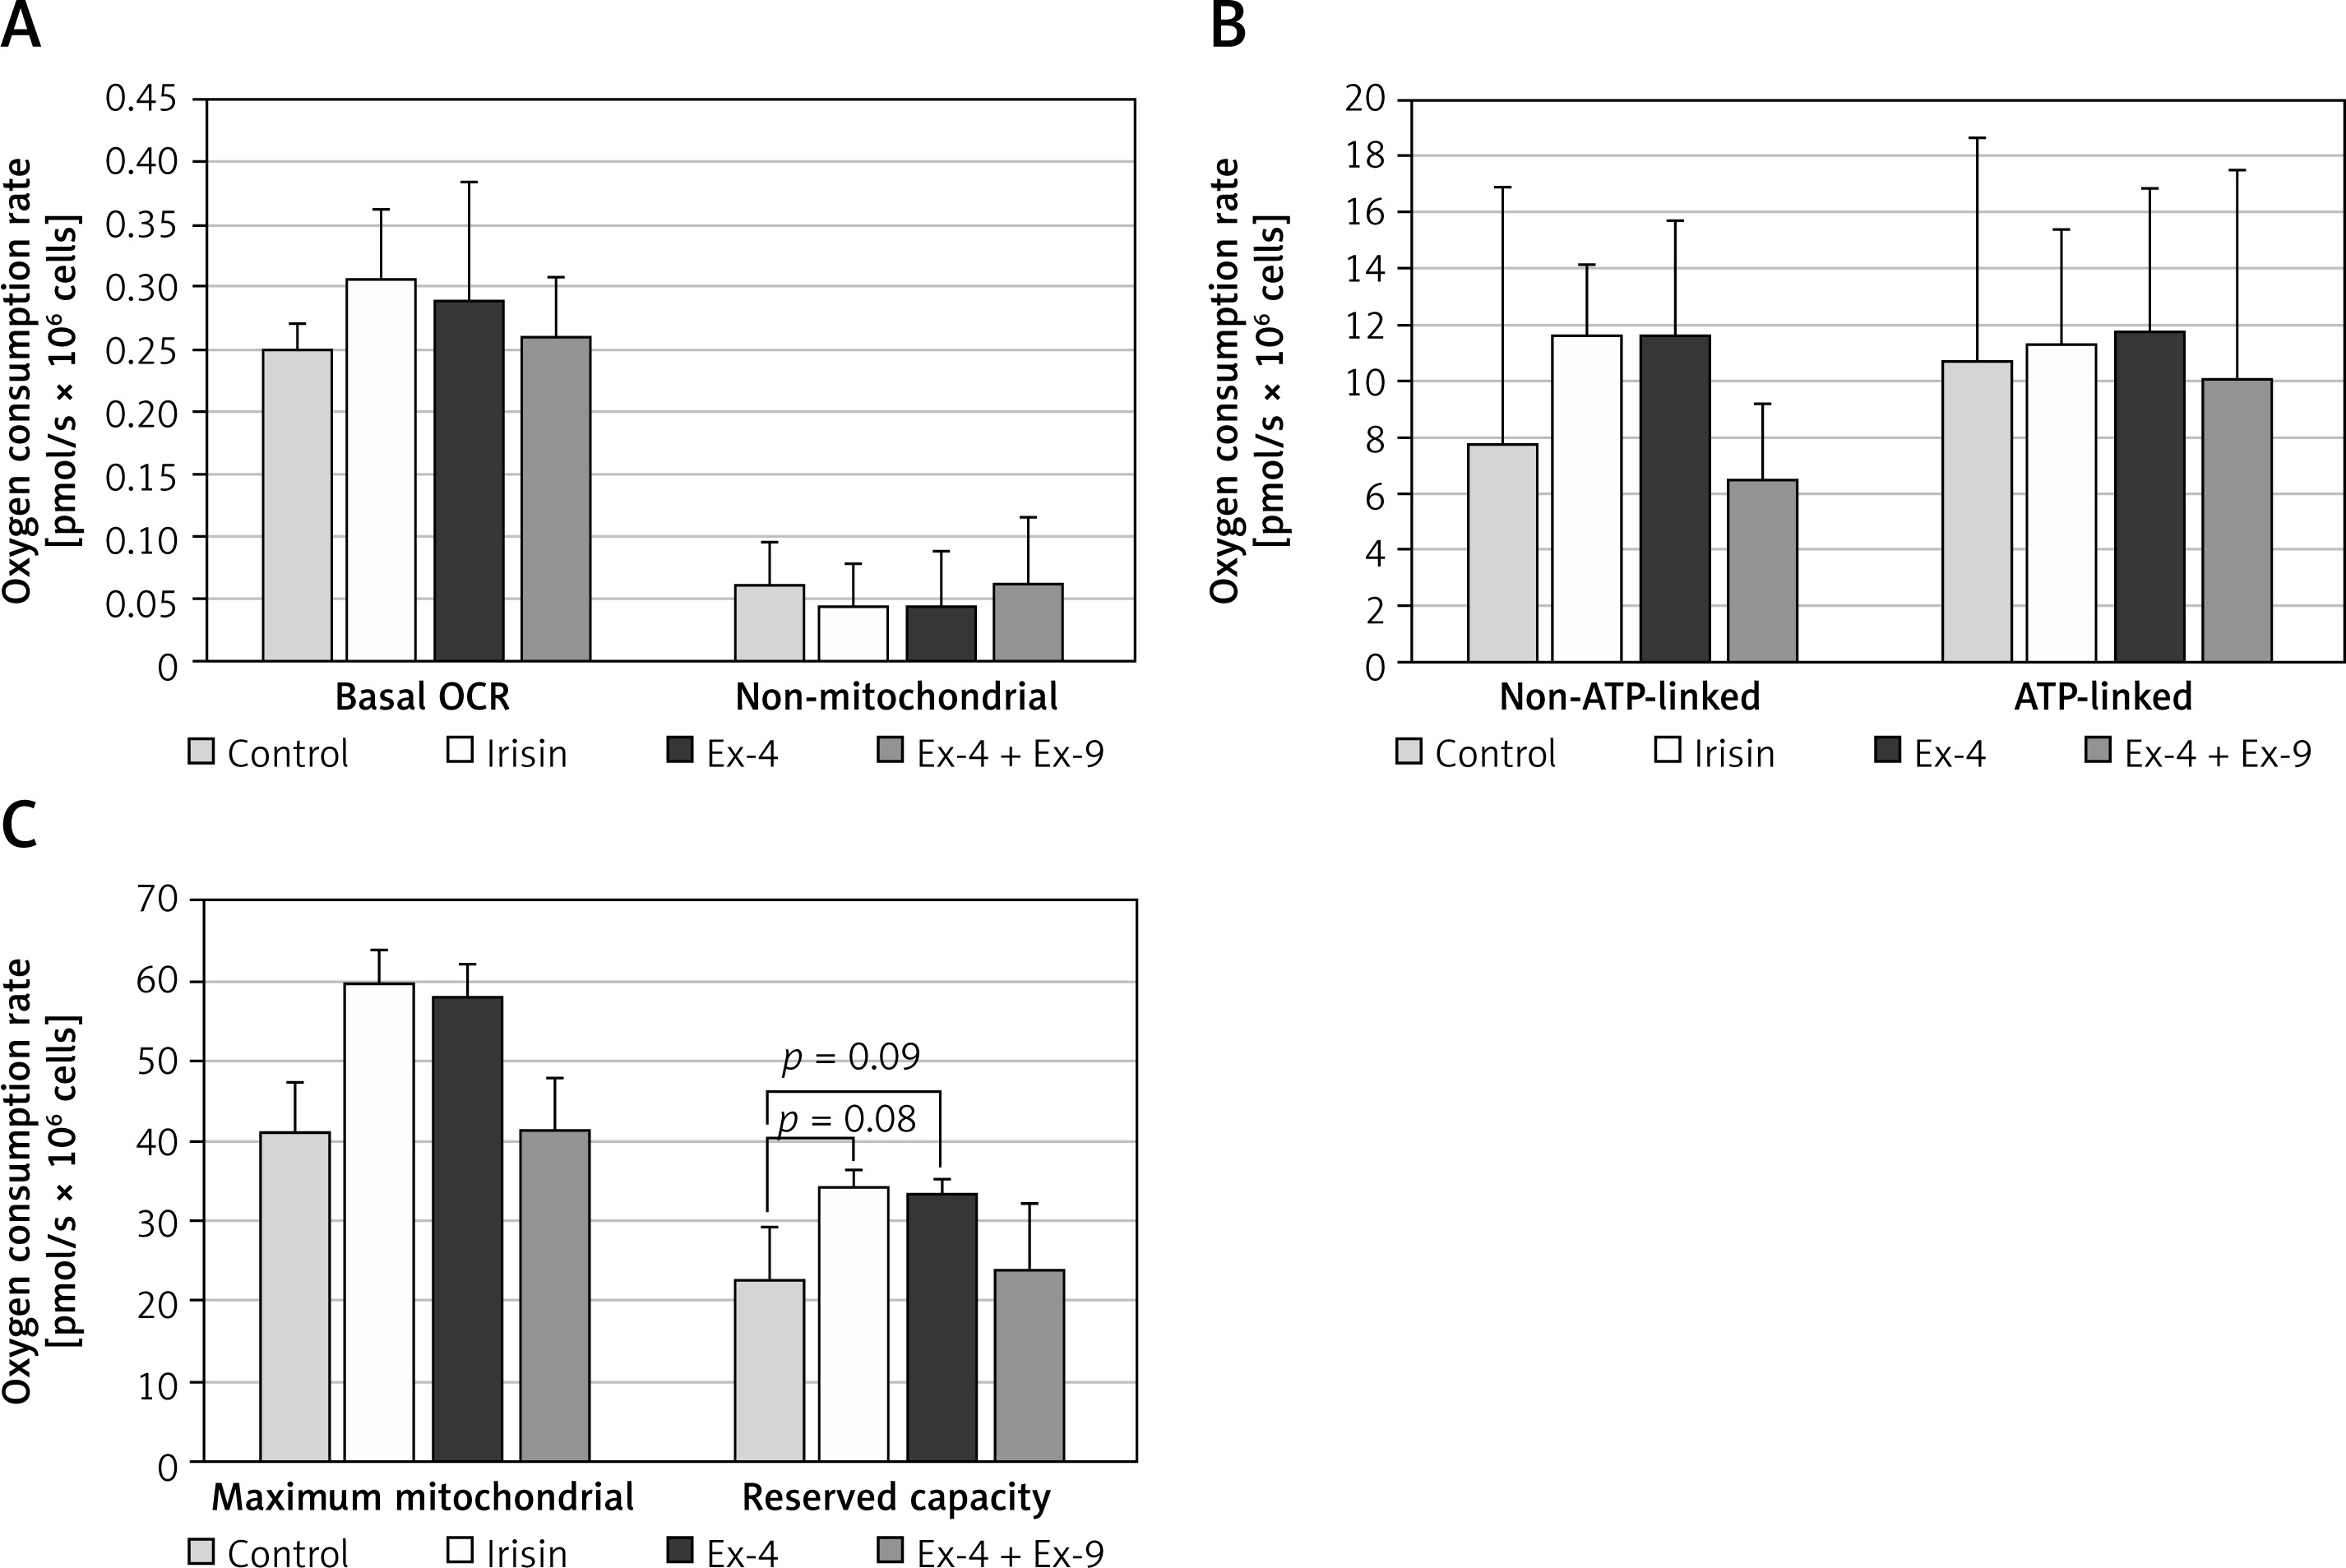
Basal OCR was slightly increased in irisin treated cells (Figure 5 A). When the non-mitochondrial oxygen consumption, measured after full inhibition of mitochondrial electron transport chain by antimycin A and rotenone, was subtracted, the routine mitochondrial respiration was increased in the irisin and Ex-4 treated cells. ATP-linked oxygen consumption, calculated as the difference between basal oxygen consumption and OCR measured after the addition of oligomycin to inhibit complex V, remained similar regardless of the exposure of adipocytes. In contrast, non-ATP-linked oxygen consumption tended to increase in cells exposed to irisin or Ex-4 compared to controls (Figure 5 B). Further analysis of mitochondrial respiratory states revealed significantly increased maximal mitochondrial OCR both in irisin and in Ex-4-treated cells after stimulation of electron transport chain uncoupling from ATP synthesis in mitochondria by FCCP. Reserve capacity, calculated by subtracting basal OCR from maximal oxygen consumption after the addition of FCCP, was found to slightly increase in a similar way after incubation with irisin or Ex-4 (Figure 5 C). Addition of exendin-9 to GLP-1RA caused OCR to be restored to control values, showing that the observed changes in mitochondrial oxygen consumption rates were dependent on Ex-4/GLP-1R interaction (Figure 5).
Figure 5
Oxygen consumption measured by high resolution respirometry (Oxygraph-2k, OROBOROS Instruments) in Chub-S7 control cells and cells incubated with irisin (250 ng/ml, 24 h), exendin-4 (Ex-4, 100 nM, 24 h) or Ex-4 (100 nM, 24 h) + exendin- 9 (Ex-4 + Ex-9, 100 nM, 24 h). A – Basal oxygen consumption rate (OCR) and non-mitochondrial OCR. B – Non-ATP and ATP-linked respiration. C – Maximum mitochondrial OCR and reserve capacity. Data are presented as mean +SD (n = 3) and were analyzed using a t-test; *p < 0.05 compared to control
Intracellular ATP content
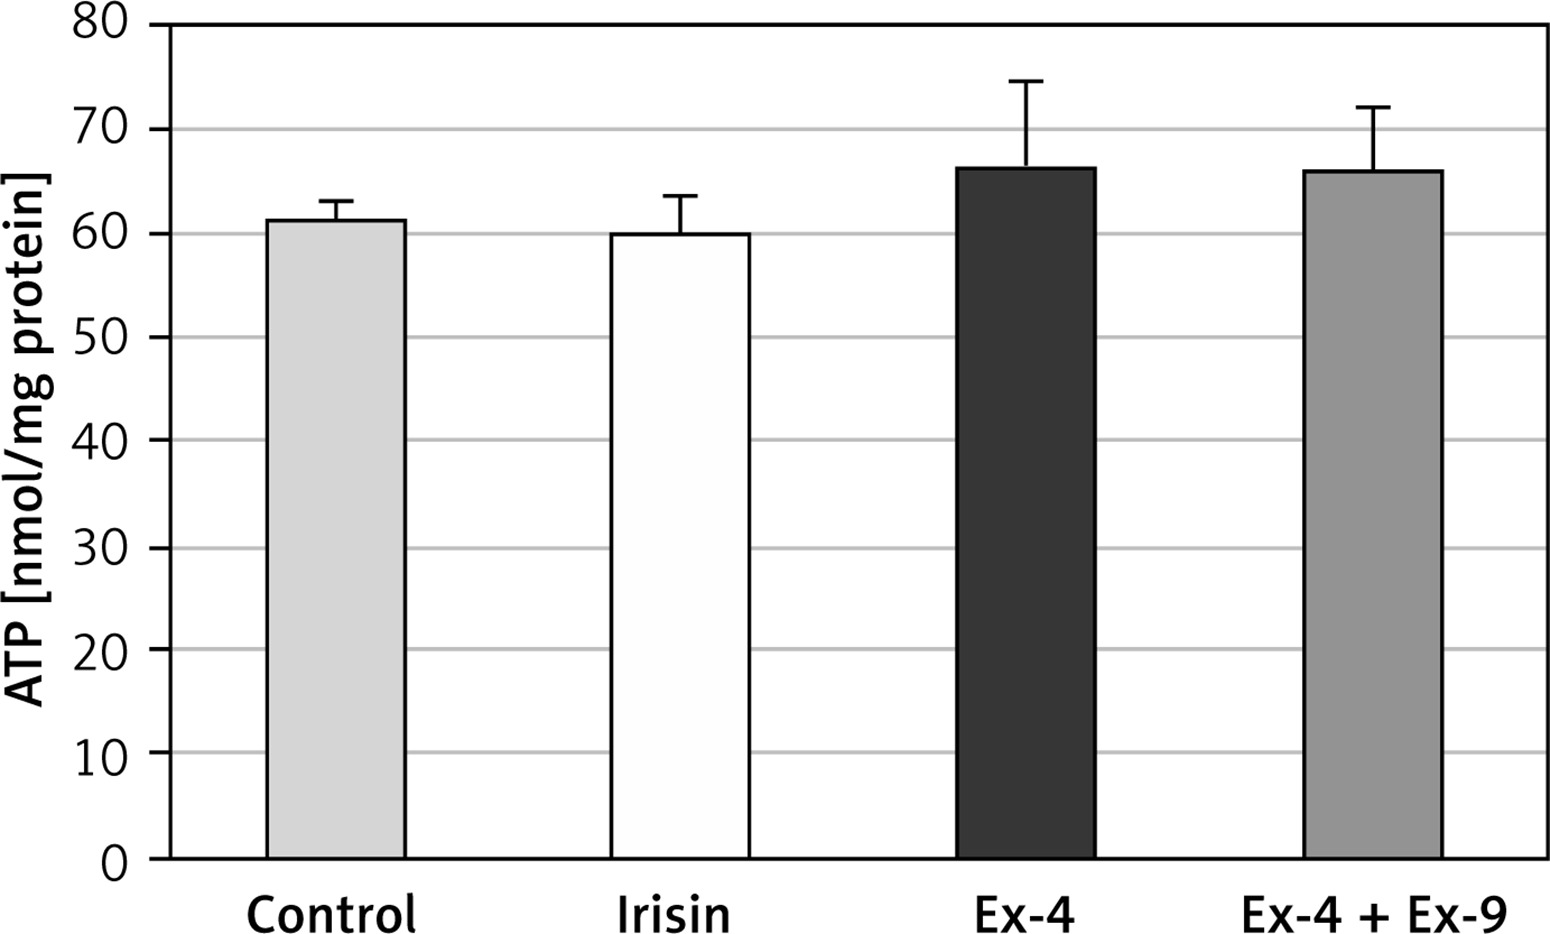
No changes in intracellular ATP content were observed in Chub-S7 cells exposed to irisin or Ex-4 (Figure 6). These results show that in the experiment, the increased mitochondrial oxygen consumption rate was not associated with raised ATP synthesis.
Figure 6
Intracellular ATP content in Chub-S7 control, irisin (250 ng/ml, 24 h) treated cells, exendin-4 (Ex-4, 100 nM, 24 h) treated cells and exendin-4 (100 nM, 24 h) + exendin-9 (Ex-4 + Ex-9, 100 nM, 24 h) treated cells. Results are presented as nmol ATP/mg of cell protein, as mean + SD measured in triplicate from three independent experiments, and were analyzed using a t-test
Discussion
Our previous work has shown that Ex-4 may affect the mitochondrial bioenergetics in human adipocytes by enhanced expression of sirtuins (1 and 3) [29]. Based on these results, in the current study, we also investigated the effect of GLP-1RA on secretion of selected adipokines (irisin, visfatin/NAMPT and adiponectin) related to the sirtuin pathway. It has been reported that adiponectin prevents mitochondrial dysfunction in a sirtuin-3 (SIRT3)-dependent manner [30]. Furthermore, SIRT3 is an NAD(+)-dependent deacetylase which functions in conjunction with mitochondrial NAMPT to promote cell survival following genotoxic stress [31].
Simental-Mendía et al. in a meta-analysis of randomized controlled trials reported an increase in adiponectin concentrations in the course of GLP-1RA therapy [32]. They observed a significant increase in serum adiponectin levels after liraglutide, while exenatide had no effect, which is consistent with our results. In our in vitro study, no significant changes in adiponectin secretion to the cell culture supernatant after incubation of Chub-S7cells with Ex-4 were observed. The opposite results were obtained by Kim Chung et al. [33], who found that Ex-4 upregulated adiponectin synthesis in 3T3-L1 adipocytes though PKA expression and/or PKA activity. In our study, although adiponectin remained unchanged under Ex-4, secretion of another adipokine – irisin – was significantly increased. This finding is in line with the study by Liu et al. [20] demonstrating that exenatide significantly increased serum irisin levels in patients with T2D. These results suggest that the upregulation of irisin might be a novel mechanism for the beneficial effects of exenatide in patients with T2D.
Visfatin is an adipocytokine with insulin mimetic activity whose enzymatic function is the same as NAMPT [34]. Our results showed that Ex-4 increased visfatin secretion to the culture medium and intracellular NAMPT level. A similar effect on visfatin was observed in other studies that showed that GLP-1 induced secretion of visfatin into the culture medium of 3T3-L1 adipocytes due to increased visfatin mRNA expression [35].
This study showed that Ex-4 significantly upregulated not only protein but also NAMPT gene expression. Similar results were obtained by Lee et al. [36] in an experiment on C57BL/6J mice, showing that NAMPT expression was induced by Ex-4 treatment. Furthermore, the data suggested that Ex-4 treatment may increase sirtuin expression via the NAD+ biosynthesis pathway. Indeed, our previous work showed that Ex-4 significantly increased expression of SIRT1 [29]. Recent studies have demonstrated that NAMPT deficiency induces adipose tissue dysfunction and insulin resistance, and altered whole-body energy and glucose metabolism [37, 38]. These findings suggest that Ex-4 may have a beneficial effect on metabolic abnormalities by influencing postprandial glycemia also through an increase in expression of the NAMPT gene. Furthermore, NAMPT-mediated NAD+ biosynthesis and sirtuins in the intestine are critical for intestinal homeostasis, including GLP-1 production [39].
Our data showed that Ex-4 upregulated the expression of UCP2, responsible together with UCP1 for heat generation and non-shivering thermogenesis in brown adipose tissue. In the presence of UCPs, a high respiratory rate occurs in the absence of ATP production. Uncoupling protein 2 plays a role in fatty acid and glucose metabolism and transportation of TCA cycle metabolites. The role of uncoupling proteins in various metabolic conditions, such as diabetes and obesity, has been reported [40].
Recent studies have demonstrated that FNDC5 expression and secretion of irisin from adipocytes is lower in patients with obesity and T2D than in lean controls [41]. In our study, Ex-4 upregulated the expression of the FNDC5 gene. This is particularly important, as irisin is known to suppress oxidative stress by retaining mitochondrial biogenesis and dynamics and exerts a protective effect by promoting SIRT3-dependent mitochondrial quality control [42, 43]. In addition, it has been shown that irisin treatment targets uncoupling protein 2 (UCP2) and activates the AMPK-Nrf2 pathway, substantially improving oxidative stress and mitochondrial dysfunction [44].
We also examined the influence of Ex-4 and irisin on mitochondrial functions in human adipocytes to compare the effects of these peptides. Our results showed that both irisin and Ex-4 increased maximum OCR. Recently, another study revealed a similar effect of irisin on the metabolic function of osteoclast progenitors during differentiation, where treatment with 10 ng/ml of irisin for 48 h significantly increased maximal respiration, associated with increased mitochondrial content shown by fluorescent imaging [45]. Furthermore, Jansen et al. [46] reported that the GLP-1 analog exenatide increased hepatic mitochondrial respiration in high-fat fed mice in various respiratory states, such as LEAK, OXPHOS, and ETS. In our study, both irisin and Ex-4 also independently increased non-ATP-linked OCR, while intracellular ATP content remain unchanged. This confirms our earlier report that increased mitochondrial OCR was accompanied by slightly decreased mitochondrial membrane potential but not excessive ATP synthesis in mature adipocytes exposed to Ex-4 [29]. Such subtle effects may reflect functional adaptations of mitochondria to conditions that require ATP generation or energy dissipation. Nutrient excess and physical activity are sensed at the organismal and cellular levels, activating hormonal, metabolite, and protein signaling that control mitochondrial-linked gene transcription and mRNA translation to enhance respiratory capacity [47]. Thus, mild effects of both the nutrient-sensitive peptides – the GLP-1RA exendin-4 and irisin – on mitochondrial respiration observed in our study may be a part of an adaptive response, preventing mitochondrial damage and subsequent proinflammatory and dysfunctional adipocytes.
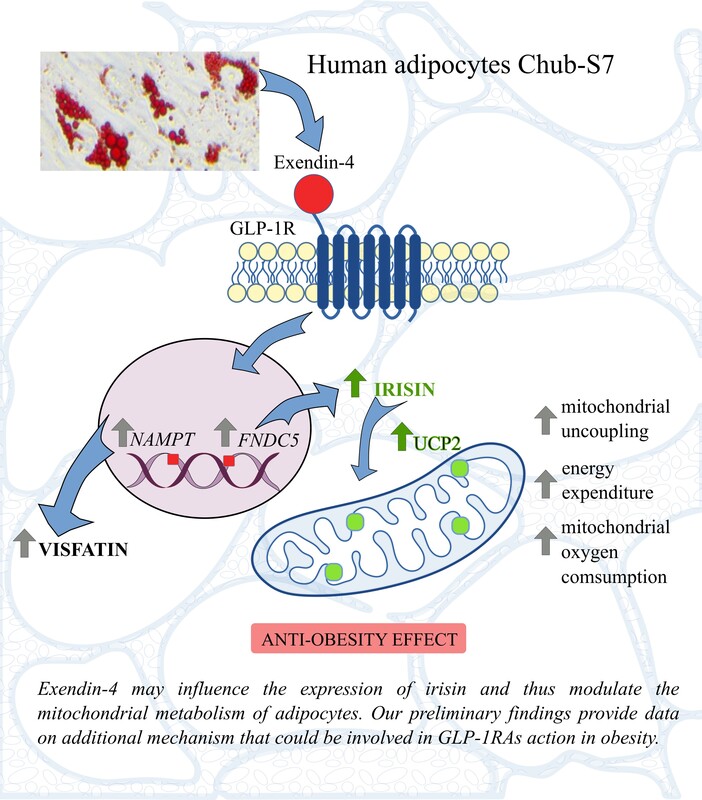
To summarize, the present results showed that Ex-4 influences the expression of genes related to mitochondrial biogenesis, energy expenditure, and mitochondrial uncoupling, including FNDC5 coding for irisin, as well as mildly stimulating mitochondrial activity. The finding that changes in expression of mRNA and respective proteins are further reflected in mitochondrial bioenergetics is a strength of the study, as is the unique cell model. However, due to the limited data collected on mitochondrial metabolism, the results presented here should be considered as preliminary, providing a basis for further studies in animal models and clinical samples, supporting the hypothesis that irisin may mediate the action of GLP-1RAs. To better elucidate the action of irisin and confirm whether it mediates exendin-4 effects, it would also be interesting to perform experiments with simultaneous silencing of the FNDC5 gene.
Although the study has yielded interesting results, it has some limitations. One shortcoming is that the in vitro Chub-S7 model derived from preadipocytes of a single obese individual does not reflect biological variability. It would be worthwhile to repeat the study on adipocytes from different donors, but this is difficult due to invasiveness and ethical considerations. On the other hand, such a model allows the detection of even small effects due to the high repeatability of the results. Indeed, the fold change in expression of selected genes is not impressive, and thus may reduce the strength of our observations. In our study, the observed effect of Ex-4 on mitochondrial activity was also relatively small. These modest effects may be due to the low level of GLP-1R expression in adipose tissue. Some authors have hypothesized that in humans, GLP-1R expression is more abundant in visceral adipose tissue (VAT), especially in obese subjects with a high insulin-resistant profile [48]. Although the expression of GLP-1R is well documented in human preadipocytes and adipocytes [48], the level of expression may be different in various types of adipocytes; therefore, it would be interesting to investigate the expression of GLP-1R at the mRNA or protein level in our cell model. In our research, we used the subcutaneous adipose tissue cell model (Chub-S7 cells) due to the small number of publications in this field. Further additional studies should be conducted with higher statistical power to confirm the observed associations.
In conclusion, stimulation of human adipocytes in vitro by the GLP-1RA Ex-4 enhanced the expression of irisin at the mRNA and protein levels. Ex-4 and irisin similarly increase energy expenditure in human adipocytes, a mechanism of action that is beneficial in the treatment of obesity. Given the limitations of the in vitro model using one human adipocyte cell line, further studies are necessary to confirm the hypothesis that nutrients, by stimulating the secretion of GLP-1, may influence the expression of irisin and thus modulate the mitochondrial metabolism of adipocytes.