Introduction
Gastrointestinal tumors encompass gastric cancer (GC) and colorectal cancer (CRC) [1]. Globally, GC has the fifth highest incidence rate among all cancers and is the fourth leading cause of cancer-related deaths [2, 3]. CRC is the second leading cause of cancer mortality, with 1 million deaths attributed to CRC in 2020 [3]. This highlights that gastrointestinal tumors remain a significant public health issue worldwide. Previous research has identified several risk factors associated with gastrointestinal tumors, including smoking, alcohol consumption, high fat intake, low fiber intake, genetics, age, and certain infections [4–6]. Recently, studies investigating the connection between blood metabolites and various diseases have gained increased attention.
Metabolomics has emerged as a critical area in the medical field. It identifies changes in metabolites or metabolite pathways that help uncover the causes of disease development from a molecular perspective [7]. Metabolites can participate in human physiological activities as signaling molecules, endogenous toxins, immunomodulators, and environmental sensors, promoting or inhibiting the occurrence of diseases [8]. Determination of metabolites can help medical staff find new diagnostic or prognostic biomarkers for various diseases [9]. With the rapid advancement of metabolomics, researchers are increasingly focusing on the changes in blood metabolites associated with gastrointestinal tumors. Numerous studies have demonstrated that blood metabolites play a role in the development of these tumors [10, 11]. Specifically, some primary bile acids and short-chain fatty acids have been found to promote the growth of gastrointestinal tumors, while ursodeoxycholic acid and butyric acid have shown beneficial effects [12]. In addition, Dai et al. investigated the impact of 150 metabolites on the progression of GC [13]. Furthermore, Coker et al. examined the relationship between 20 metabolites and the progression of CRC [14]. However, the metabolites that have been studied represent only a small fraction of the vast number of metabolites, and the relationships between multitudinous metabolites and gastrointestinal tumors need to be explored. Traditional observational studies lack credibility due to potential biases, such as reverse causations and confounding factors. A randomized controlled trial (RCT) is considered the best way to confirm causality, but related RCTs are rare due to the large number of metabolites.
A Mendelian randomization (MR) study is considered the second most persuasive research method to explore the causal relationship between exposure and outcome after an RCT [15]. MR studies use single nucleotide polymorphisms (SNPs) as instrumental variables (IVs) to infer causal associations between exposures and outcomes, which can overcome the impact of potential biases on causal inferences [16]. According to Mendel’s laws of inheritance, parents randomly assign alleles to their offspring. Therefore, MR studies are less affected by confounding factors [17]. In addition, genetic variation is determined earlier than exposure, so MR studies do not present a problem with reverse causation [18].
The relationships between blood metabolites and gastrointestinal tumors remain unclear, so further research is necessary. We used data from genome-wide association studies (GWAS) to conduct MR analyses to comprehensively screen 1400 blood metabolites and metabolite ratios for the causal relationships with gastrointestinal tumor risk. Identifying new specific biomarkers among a large number of blood metabolites can guide the clinical diagnoses and prognoses of gastrointestinal tumors.
Material and methods
Study design
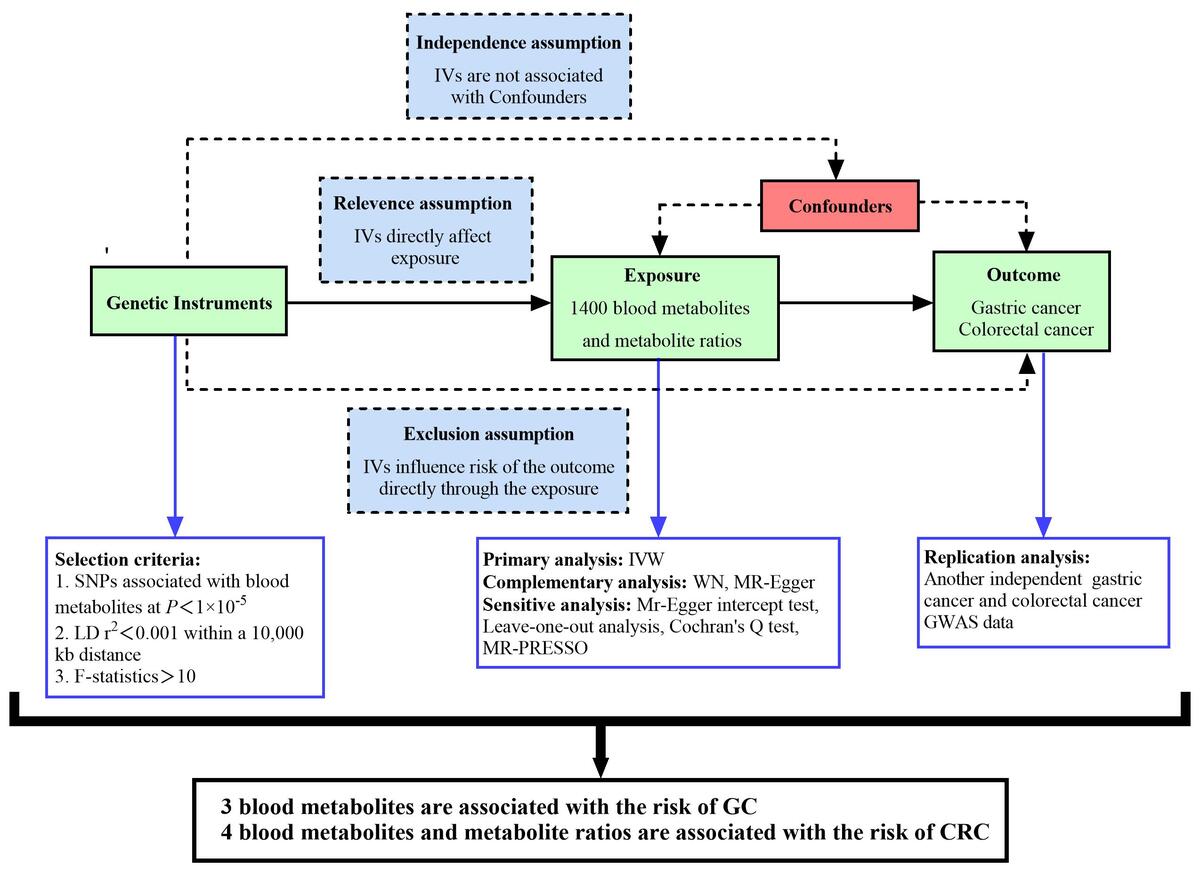
We systematically assessed the potential causal relationships between 1400 human blood metabolites and metabolite ratios and gastrointestinal tumor risk using a two-sample randomization approach and designed the study based on the three core hypotheses of the MR analysis [19]: (1) Relevance assumption: The IVs selected must be closely related to exposures (GC, CRC). (2) Independence assumption: The selected IVs are only allowed to be related to exposures and should not be related to potential confounding factors. (3) Exclusion assumption: The selected IVs should influence outcomes entirely through exposures.
GWAS data for 1400 human blood metabolites and metabolite ratios
We used the most up-to-date and comprehensive GWAS datasets currently available for the human metabolome [20]. Based on the Canadian Longitudinal Study on Aging (CLSA) cohort, researchers analyzed data on 1,091 blood metabolites and 309 metabolite ratios by examining 8,299 participants and approximately 15.4 million SNPs. The full GWAS summary statistics of the 1400 biomarkers were publicly available.
GWAS data for GC and CRC
GWAS summary data for GC and CRC are from the FinnGen database (https://www.finngen.fi/fi). Data on GC (phenocode: C3_STOMACH_EXALLC) include a total of 288,444 European participants (case: 1,307; control: 287,137). Data on CRC (phenocode: C3_COLORECTAL_EXALLC) include a total of 293,646 European participants (case: 6,509; control: 287,137).
To further verify the results of this study, we repeatedly analyzed another set of GWAS summary data of GC and CRC, all from the Open GWAS database (https://gwas.mrcieu.ac.uk/). The latest data on GC include a total of 476,116 European participants (cases: 1,029; controls: 475,087), with a total of 24,188,662 SNPs (GWAS ID: ebi-a-GCST90018849) [21]. The latest data on CRC include a total of 470,002 European participants (cases: 6,581; controls: 463,421), with a total of 24,182,361 SNPs (GWAS ID: ebi-a-GCST90018808) [21].
Selection of IVs
IVs associated with exposure should meet the following requirements: (1) All IVs should have gene-wide significance. Considering the limited number of SNPs with significant genome-wide effects, we relaxed the threshold to p < 5 × 10⁻⁵ and obtained IVs from 1400 blood metabolites and metabolite ratios. This strategy is consistent with the approach of previous studies [22, 23]. (2) The linkage disequilibrium threshold applied was R2 < 0.001, and the genomic region was within 10,000 kb. (3) The F value represents the intensity of MR, and F > 10 indicates that IVs of exposure factors have a strong ability to predict results. The formula for calculating the F value is as follows: F = R2 (n – k – 1)/[k (1 – R2)], R2 = 2 × EAF × (1 – EAF) × β2 [24]. We further coordinated the SNPs of exposures and outcomes and removed the SNPs with palindromic effects and allele discordances. Then, the final results were subjected to MR analyses.
MR analysis and sensitivity analysis
We mainly used the inverse variance weighted (IVW) method for MR analysis, which uses a meta-analysis method to integrate the Wald ratios of individual SNPs. This can assume that IVs can only affect the results through specific exposures. Therefore, the IVW method can achieve a robust result without polymorphism [25]. The IVW method uses the reciprocal of each IV variance as a weight to calculate weighted results. This process is carried out on the premise of ensuring that all IVs are valid to evaluate level pleiotropy [26]. However, when there are uncertainties in genetic associations and risk factors, such as weak IVs, the IVW method is biased to underestimate actual results [27]. Therefore, MR-Egger regression and weighted median (WM) methods are used as supplementary analytical methods. MR-Egger regression uses the reciprocal of the outcome variance as a weight to fit. It adds an intercept term to the regression to perform weighted linear regression when IVs are invalid to produce causal estimates [28]. The WM method is the median of the weighted empirical density function of the ratio estimate. It combines data from multiple genetic variants into a single causal estimate. When the proportion of invalid IVs is as high as 50%, and the accuracy of estimates varies widely between IVs, the WM method can still provide consistent effect estimates [29].
In order to further test the stability and reliability of the results, we conducted a sensitivity analysis, heterogeneity test, and pleiotropic test on the results. A leave-one-out analysis was used to analyze the sensitivity of the results. It removes each SNP in turn and then calculates the results of all remaining SNPs. When there is no statistically significant difference between the results of a single SNP and the total results, it means that the SNP will not have a non-specific impact on the results [30]. Cochran’s Q test was used to quantify the heterogeneity of instrumental variables. P > 0.05 proves no heterogeneity, and the fixed-effect IVW method is used; p < 0.05 indicates significant heterogeneity, and the random-effect IVW method is used [30]. MR-Egger regression was used to detect horizontal pleiotropy. When its intercept term is close to 0 and p > 0.05, it means that there is no horizontal pleiotropy [31]. The MR-pleiotropy residual sum and outlier (MR-PRESSO) method was used to remove significant outliers and further reduce horizontal pleiotropy [32]. The funnel plot was used to detect publication bias. The roughly symmetrical plot illustrates that the results have no significant publication bias. The false discovery rate (FDR) method was employed to adjust the P-values of the final results.
Replication analysis
To further verify the credibility of candidate blood metabolites, we performed the same MR analysis on another GC and CRC GWAS dataset. The overlapping blood metabolites of the two MR analyses were considered to have a significant causal relationship with GC or CRC.
Metabolic pathway analysis
To further clarify the biological mechanism of the impact of screened blood metabolites on GC and CRC, we used MetaboAnalyst 5.0 (https://www.metaboanalyst.ca/) to conduct metabolic pathway analyses. The dataset for pathway analysis came from the Small Molecular Pathway Database (SMPDB) and the Kyoto Encyclopedia of Genes and Genomes (KEGG).
Results
MR analysis of the causal relationship between 1400 human blood metabolites and metabolite ratios and the risk of GC
Preliminary analysis
After strict quality control of the IVs, we obtained SNPs for 62 metabolites and metabolite ratios in the FinnGen database. (Details of SNPs are listed in Supplementary Table SI). The screened IVs contained 15–39 SNPs. The F values of all the SNPs were greater than 10, indicating that the included IVs have strong predictive capabilities. (Details of IVs are shown in Supplementary Table SII). We used multiple sensitivity analysis to assess the heterogeneity and pleiotropy of each result. We finally strictly screened out 60 metabolites and metabolite ratios, including 38 metabolites of known chemical properties, 13 metabolites of unknown chemical properties, and 9 metabolite ratios (Supplementary Table SIII). Thirty-two metabolites or metabolite ratios were associated with a decreased risk of GC, and 28 metabolites or metabolite ratios were associated with an increased risk of GC.
Replication analysis
To further verify the results, we used the same method to analyze the latest data on GC in the open GWAS database. Fifty-one metabolites and metabolite ratios were screened out by the IVW method. The filtered IVs contained 17–42 SNPs, and the F value of each SNP was greater than 10 (Supplementary Table SIV). All the 51 metabolites and metabolite ratios, including 30 metabolites of known chemical properties, 11 metabolites of unknown chemical properties, and 10 metabolite ratios, passed the multiplex sensitivity analyses (Supplementary Table SV). Twenty metabolites or metabolite ratios were associated with reduced GC risk, and 31 metabolites or metabolite ratios were associated with increased GC risk.
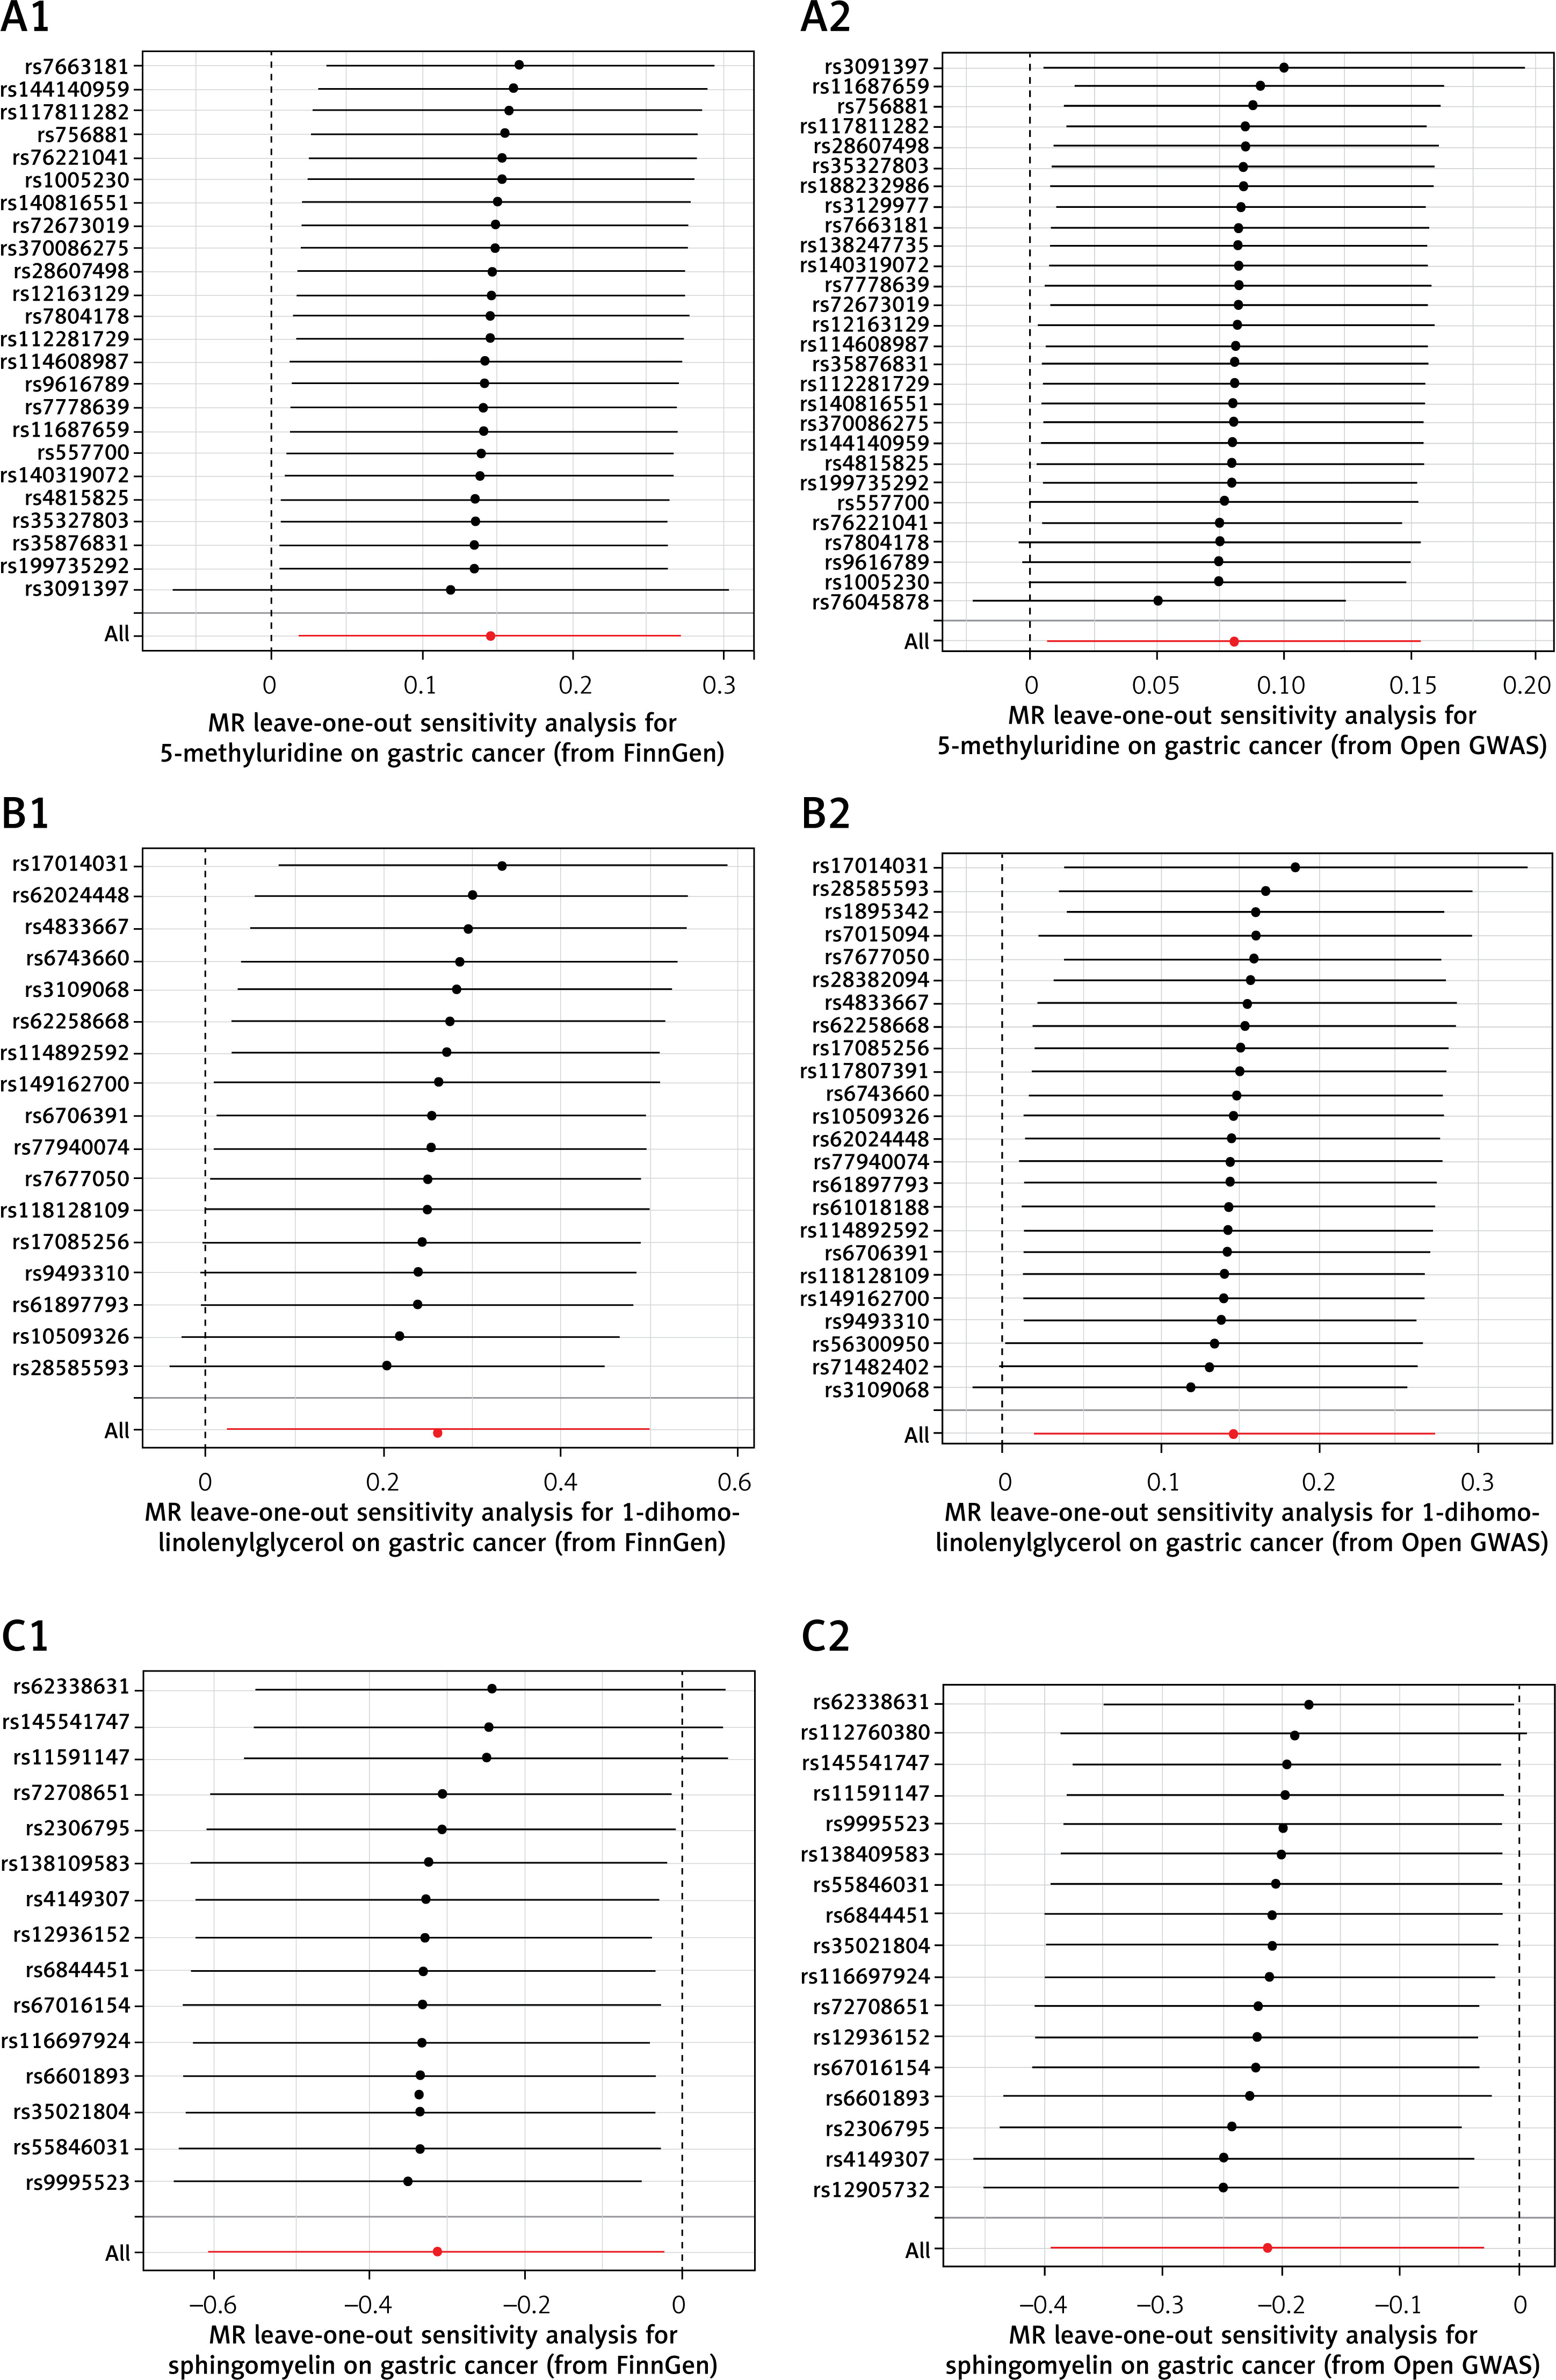
Combined with previous MR analysis from the FinnGen database, we found 3 overlapping metabolites. 5-methyluridine and 1-dihomo-linolenylglycerol were associated with increased GC risk, and sphingomyelin was associated with decreased GC risk. The sensitivity analysis showed that none of the results had apparent heterogeneity or a pleiotropic effect (Table I, Figure 1), and the P-values after FDR correction were all less than 0.05. The forest plots are shown in Figure 2. In addition, as shown in Figure 3, the leave-out-one analysis showed that excluding any SNP would not significantly affect the overall results, supporting the reliability and stability of the MR analysis. The funnel plots were approximately symmetrical, indicating no publication bias in the results (Supplementary Figure S1).
Table I
Sensitivity analysis results of overlapped metabolites with respect to gastric cancer
Figure 1
Scatter plots depicting association of overlapped metabolites and gastric cancer. A1, A2 – 5-methyluridine; B1, B2 – 1-dihomo-linolenylglycerol; C1, C2 – sphingomyelin. Each of these points represents an instrumental variable. The vertical and horizontal lines at the center of the dot represent 95% CI. The slope of the colored line represents the size of the causal relationship. SNPs – single-nucleotide polymorphisms

Figure 2
Forest plots for association of overlapped metabolites and gastric cancer risk
SNPs – single-nucleotide polymorphisms, OR – odds ratio, CI – confidence interval, GWAS – genome-wide association study.
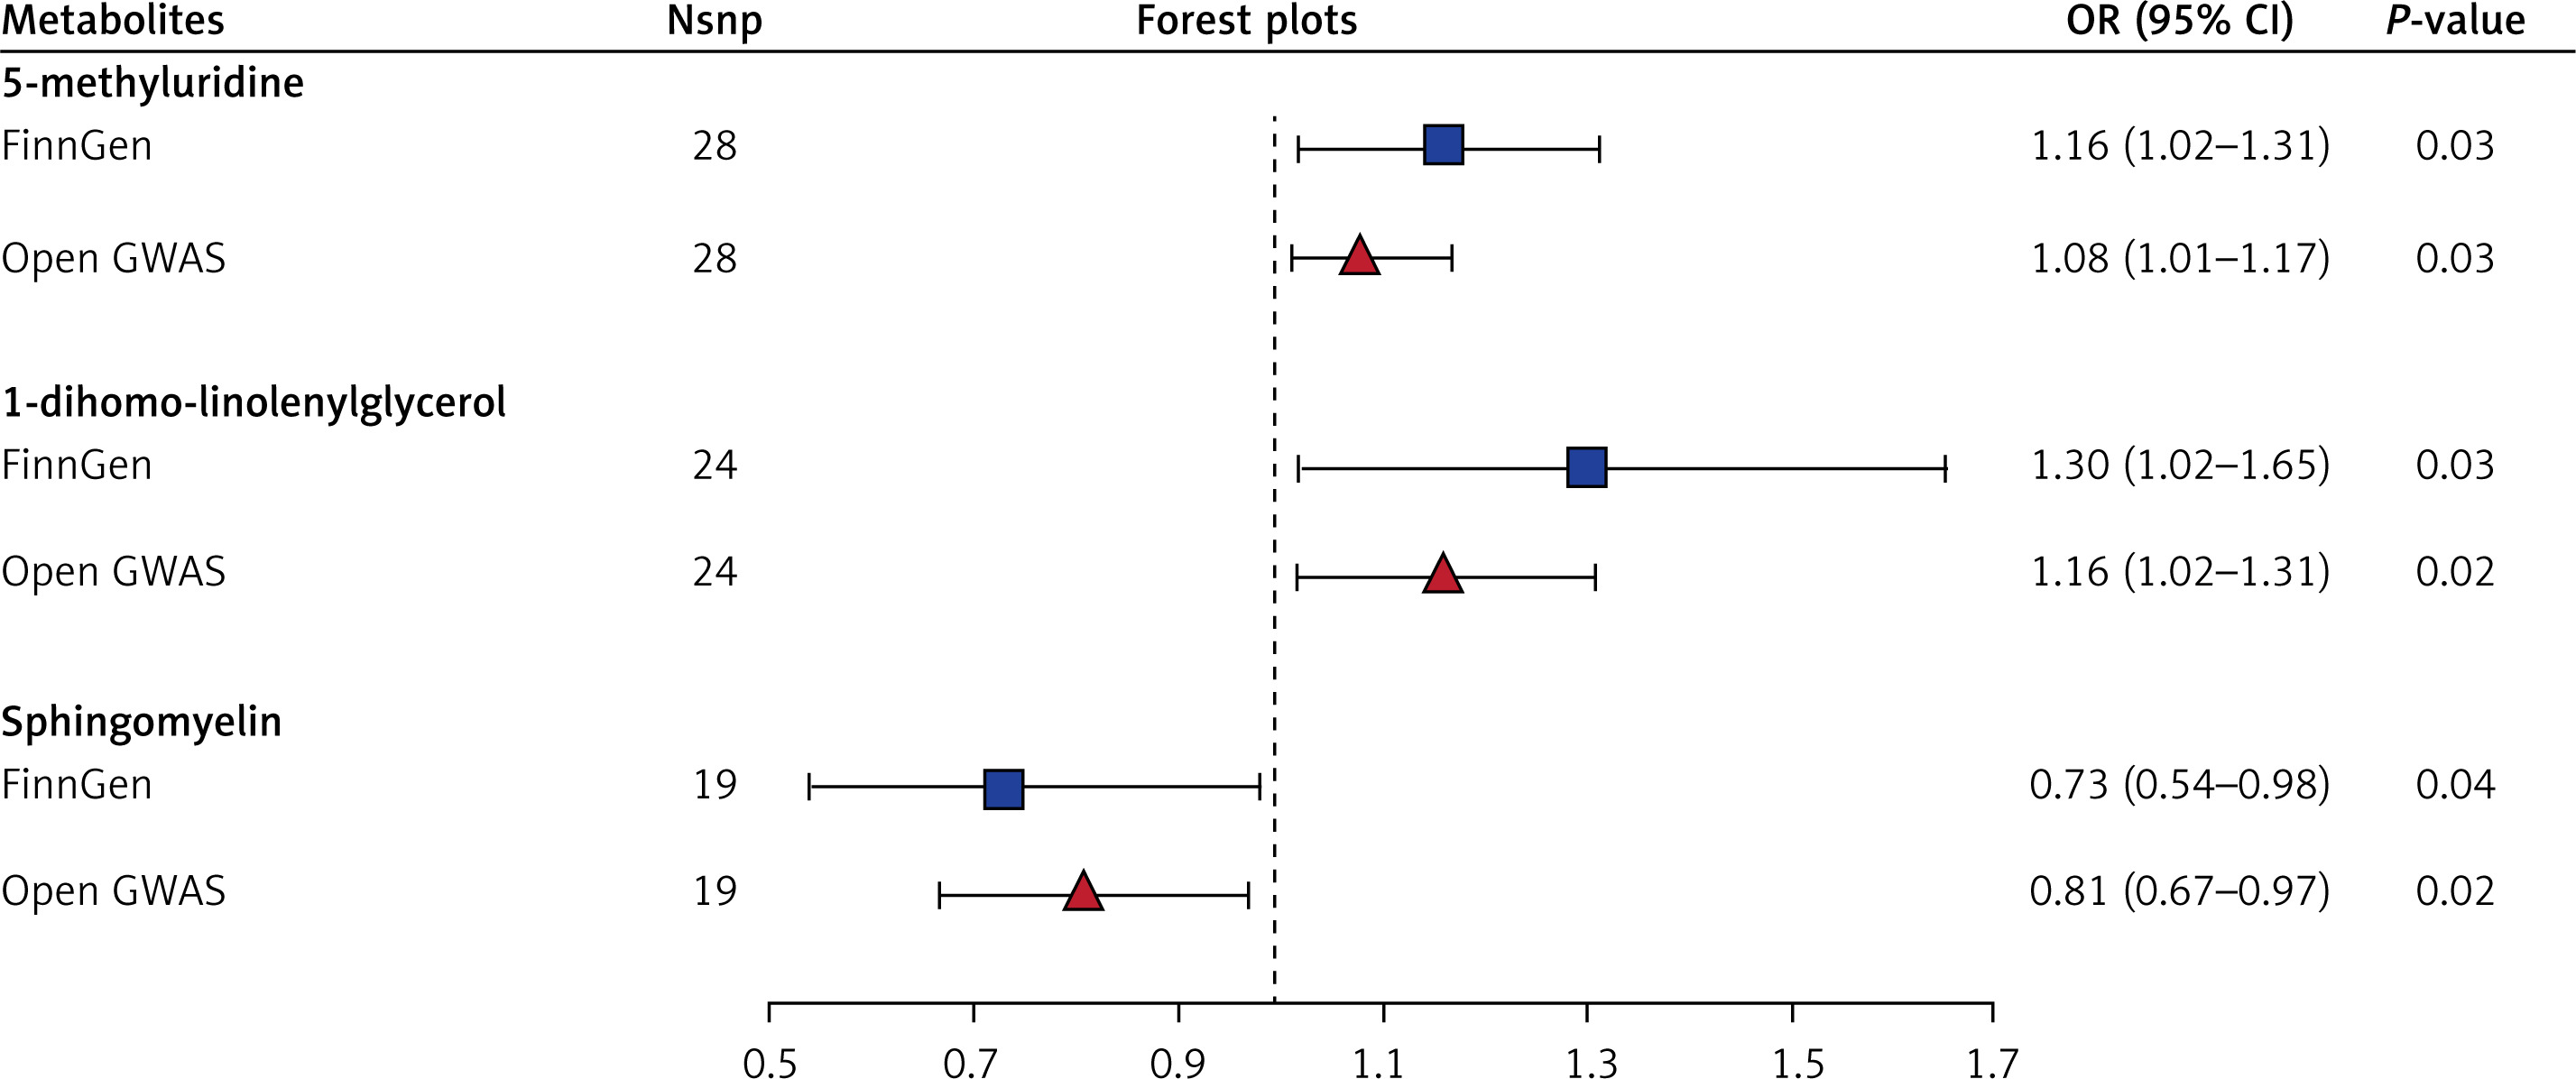
Figure 3
MR leave-one-out sensitivity analyses for association of overlapped metabolites and gastric cancer risk. A1, A2 – 5-methyluridine; B1, B2 – 1-dihomo-linolenylglycerol; C1, C2 – sphingomyelin. There is no statistically significant difference between the result of a single SNP and the total result
MR analysis of the causal relationship between 1400 human blood metabolites and metabolite ratios and the risk of CRC
Preliminary analysis
After implementing strict quality control for each IV, we identified SNPs associated with 92 metabolites and metabolite ratios in the FinnGen database. IVs contained 12–40 SNPs. The F values of all SNPs were greater than 10. Detailed information about the IVs is provided in Supplementary Table SVI. We conducted the multiple sensitivity analysis to evaluate the heterogeneity and pleiotropy of each result, ultimately rigorously filtering down to 81 metabolites and metabolite ratios, including 59 metabolites with known chemical properties, 10 metabolites with unknown chemical properties, and 12 metabolite ratios (Supplementary Table SVII). Of these, 53 metabolites or metabolite ratios were negatively correlated with CRC risk, while 28 were positively correlated with CRC risk.
Replication analyses
To further validate our results, we analyzed the latest data on CRC from the open GWAS database using the same method. We screened 110 metabolites and metabolite ratios using the IVW method. The identified IVs included 15–45 SNPs, with each SNP exhibiting an F value greater than 10 (Supplementary Table SVIII). After conducting thorough screenings, a total of 82 metabolites and metabolite ratios passed multiple sensitivity analyses. There were 48 metabolites with known chemical properties, 18 metabolites with unknown chemical properties, and 16 metabolite ratios (Supplementary Table SIX). Among these, 5 metabolites or metabolite ratios were negatively correlated with CRC risk, while 47 metabolites or metabolite ratios showed a positive correlation with CRC risk.
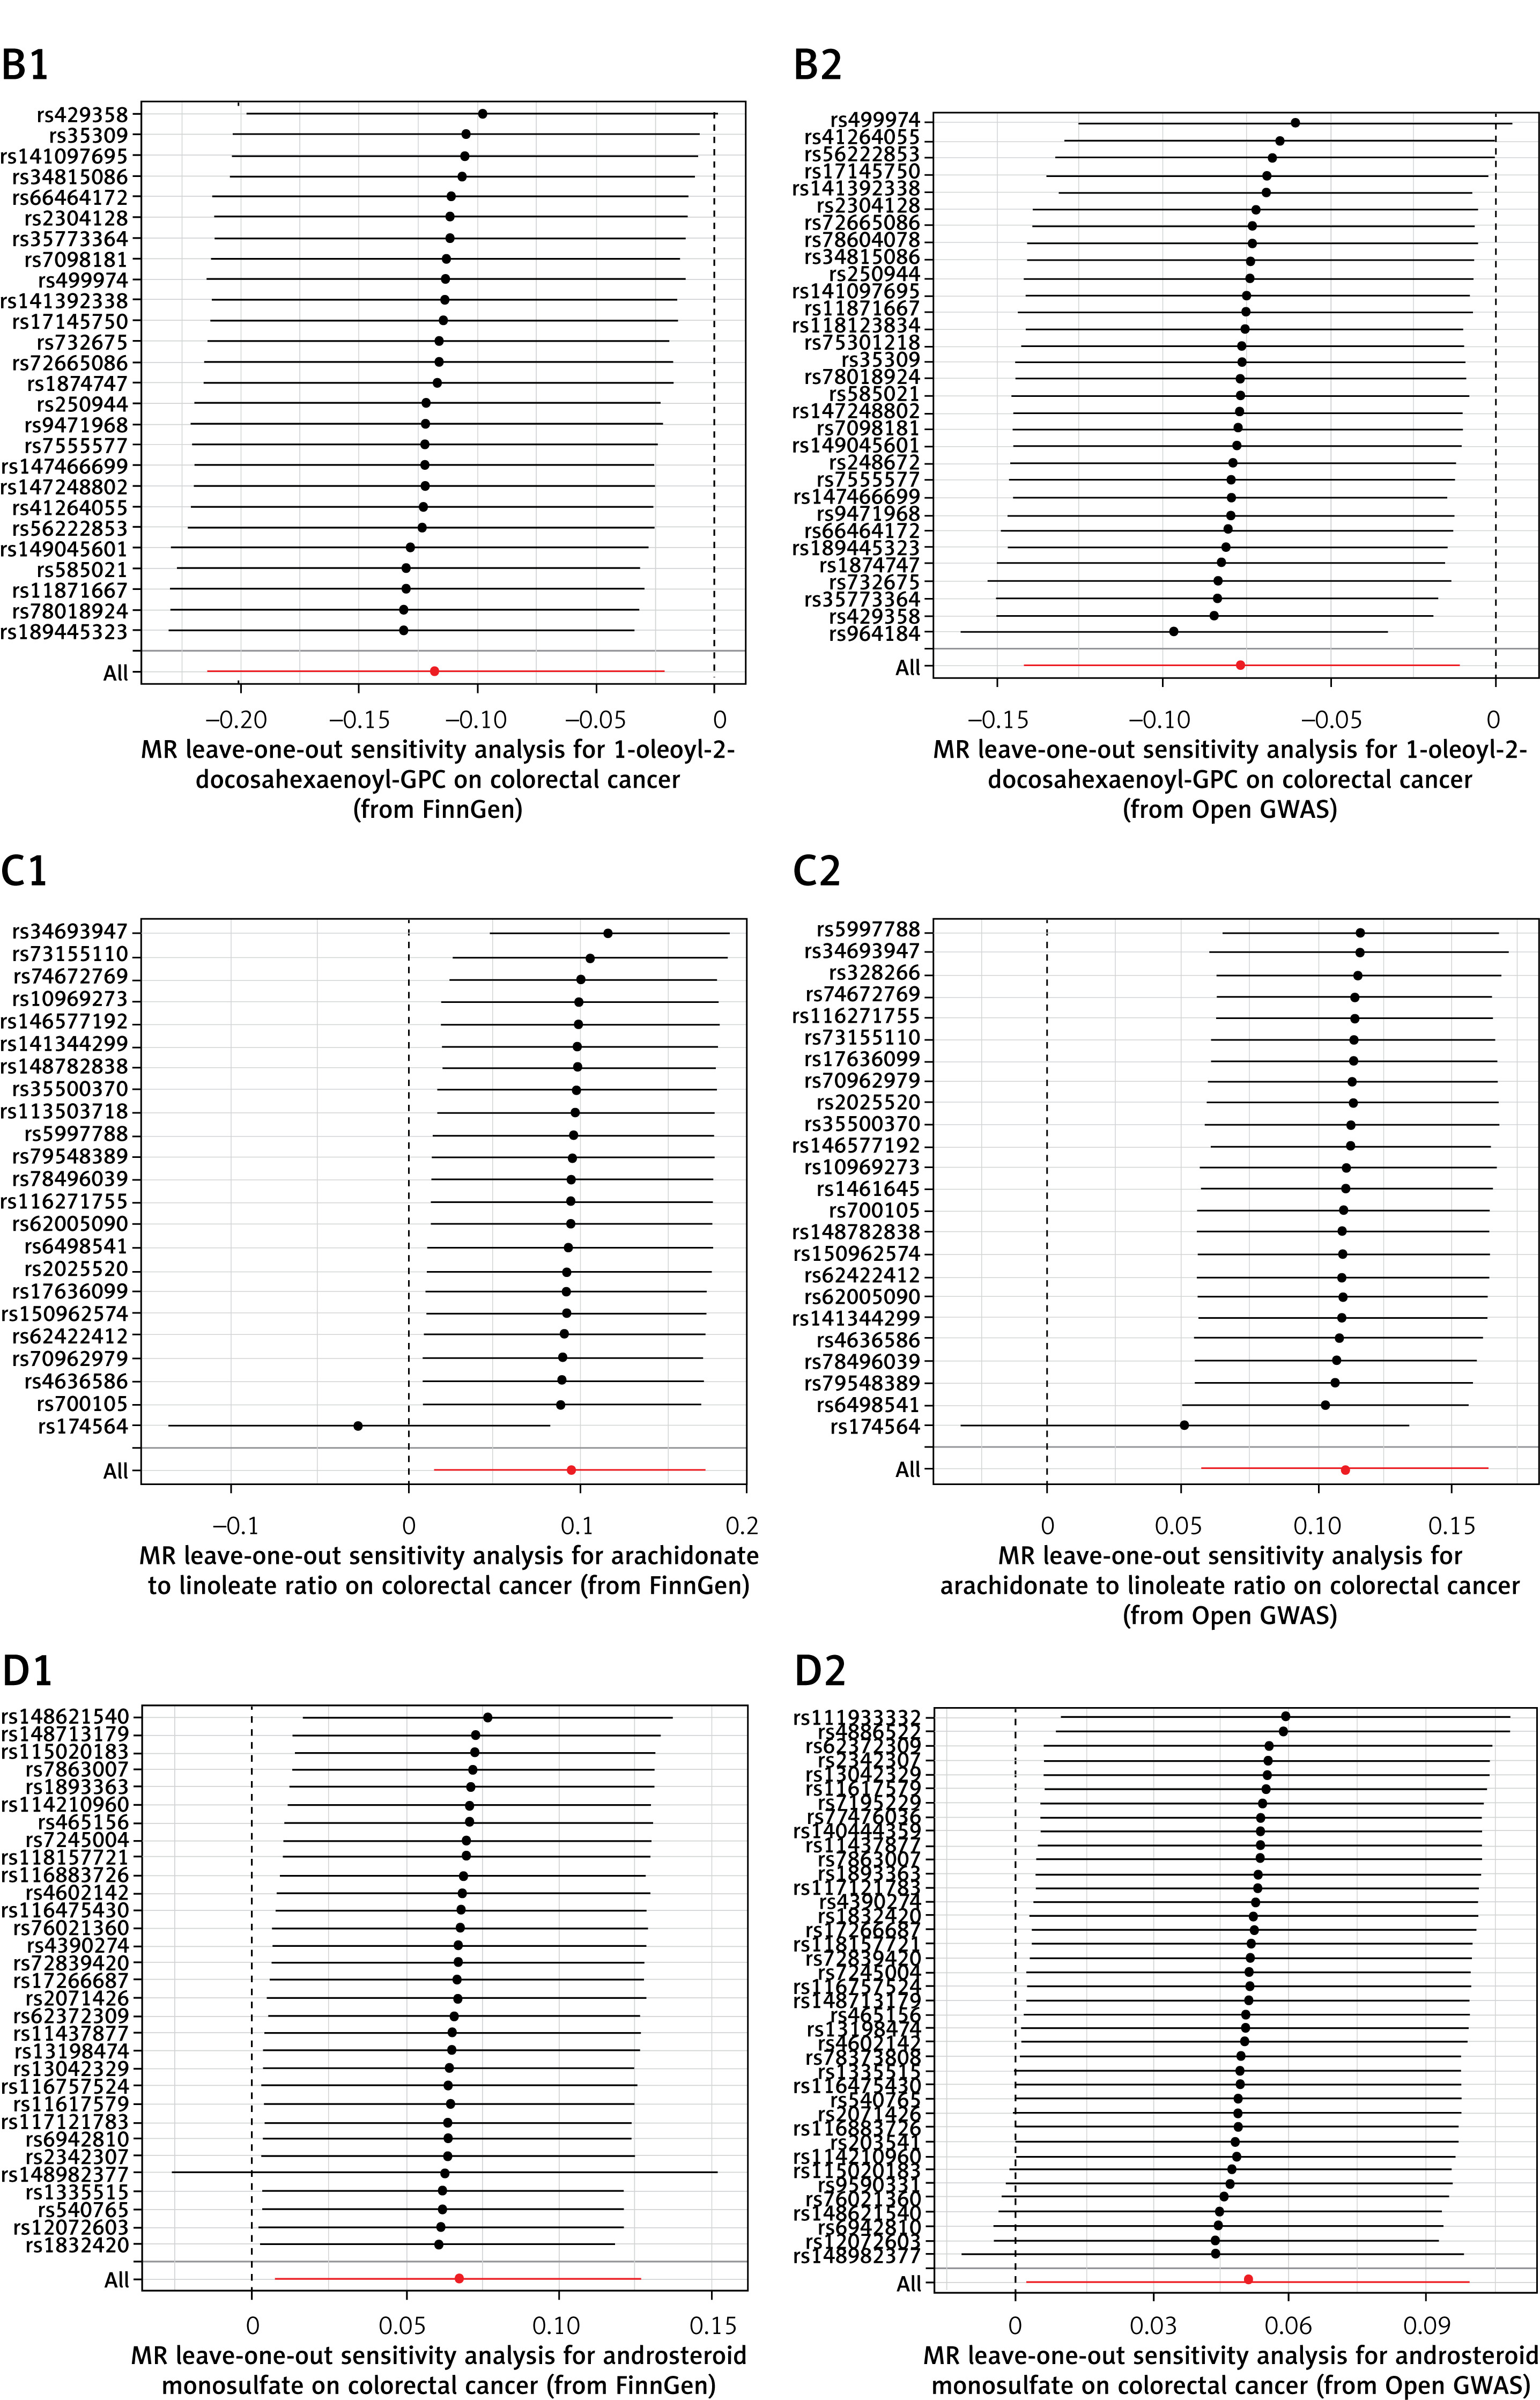
In conjunction with the previous MR analysis of the FinnGen database, we identified 4 overlapping metabolites and metabolite ratios associated with CRC risk. Carnitine to propionylcarnitine (C3) ratio, arachidonate to linoleate ratio, and androsterone sulfate were found to be positively correlated with CRC risk. In contrast, 1-oleoyl-2-docosahexaenoyl-GPC exhibited a negative correlation with CRC risk. The sensitivity analyses indicated that our results showed no significant heterogeneity or pleiotropy effects (Table II, Figure 4), and all P-values were less than 0.05 after the FDR correction. Forest plots illustrating these results can be seen in Figure 5. Additionally, the leave-one-out analysis confirmed the robustness and stability of the MR analysis (Figure 6). The funnel plots displayed a roughly symmetrical shape, indicating the absence of publication biases (Supplementary Figure S2).
Table II
Sensitivity analysis results of overlapped metabolites/ratios with respect to colorectal cancer
Figure 4
Scatter plots depicting association of overlapped metabolites/ratios and colorectal cancer risk. A1, A2 – carnitine to propionylcarnitine (C3) ratio; B1, B2 – 1-oleoyl-2-docosahexaenoyl-GPC; C1, C2 – arachidonate to linoleate ratio; D1, D2 – androsterone sulfate. Each of these points represents an instrumental variable. The vertical and horizontal lines at the center of the dot represent 95%CI. The slope of the colored line represents the size of the causal relationship
SNPs – single-nucleotide polymorphisms.
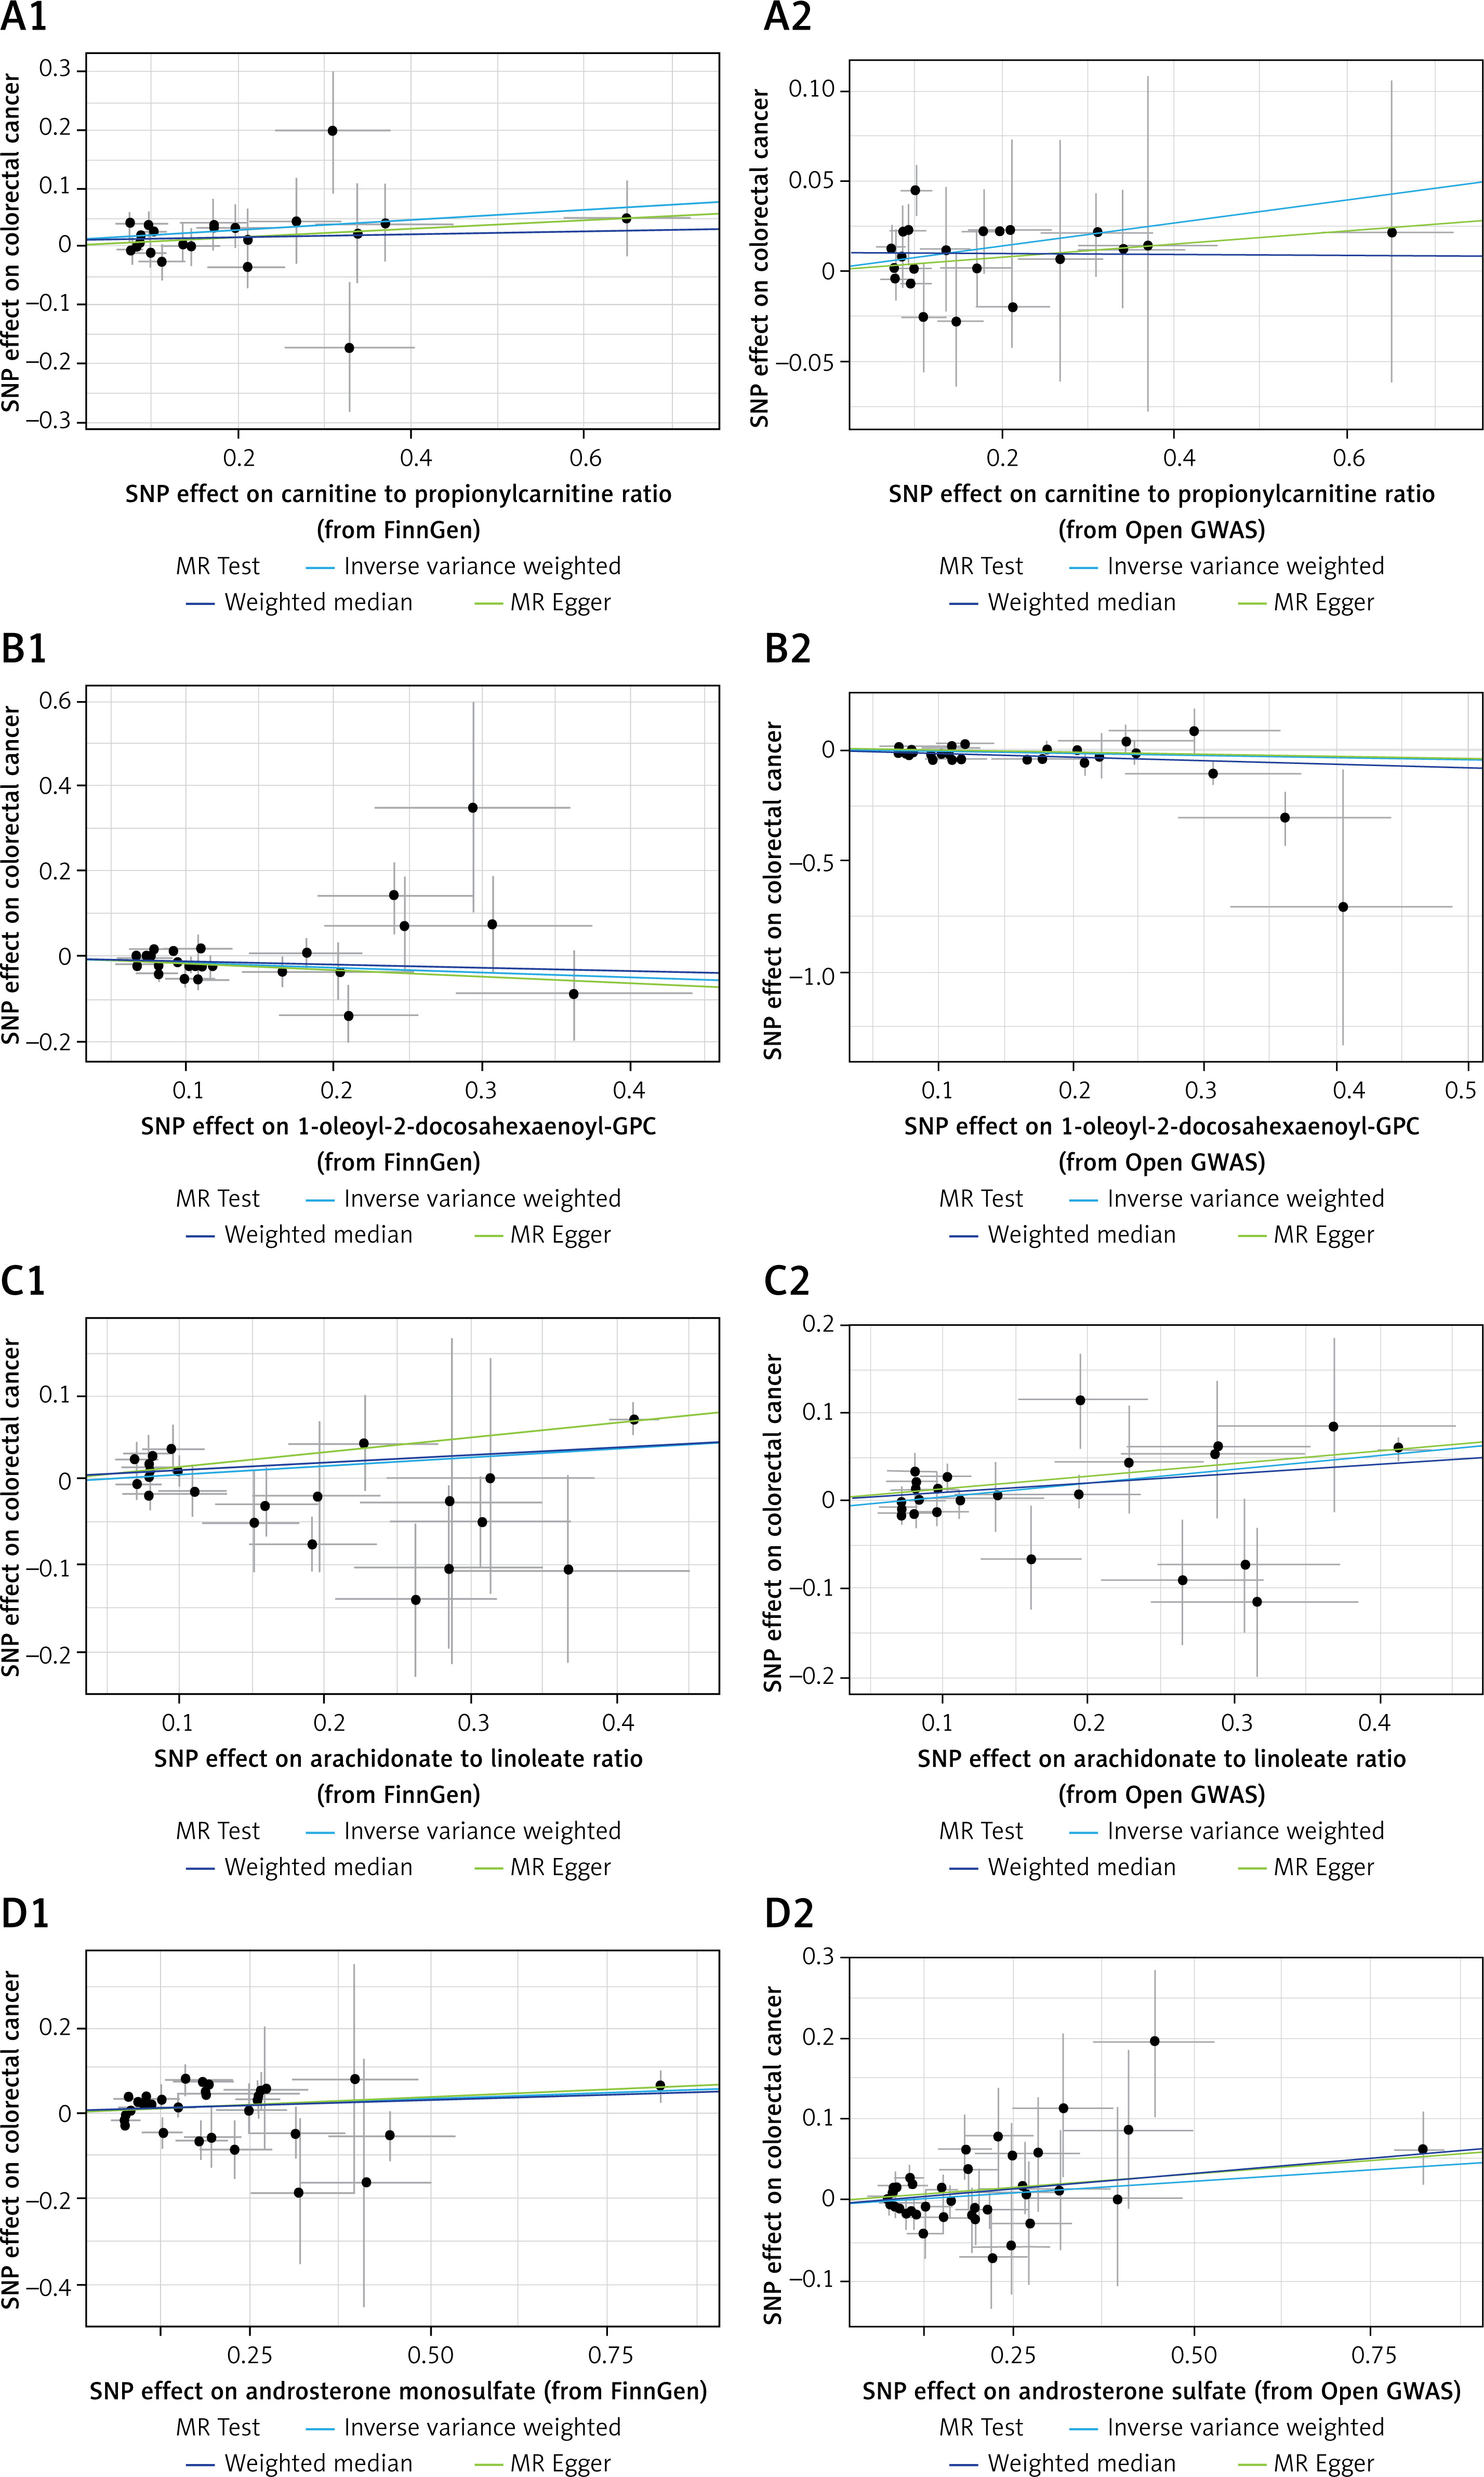
Figure 5
Forest plots for association of overlapped metabolites/ratios and colorectal cancer
SNPs – single-nucleotide polymorphisms, OR – odds ratio, CI – confidence interval, GWAS – genome-wide association study.
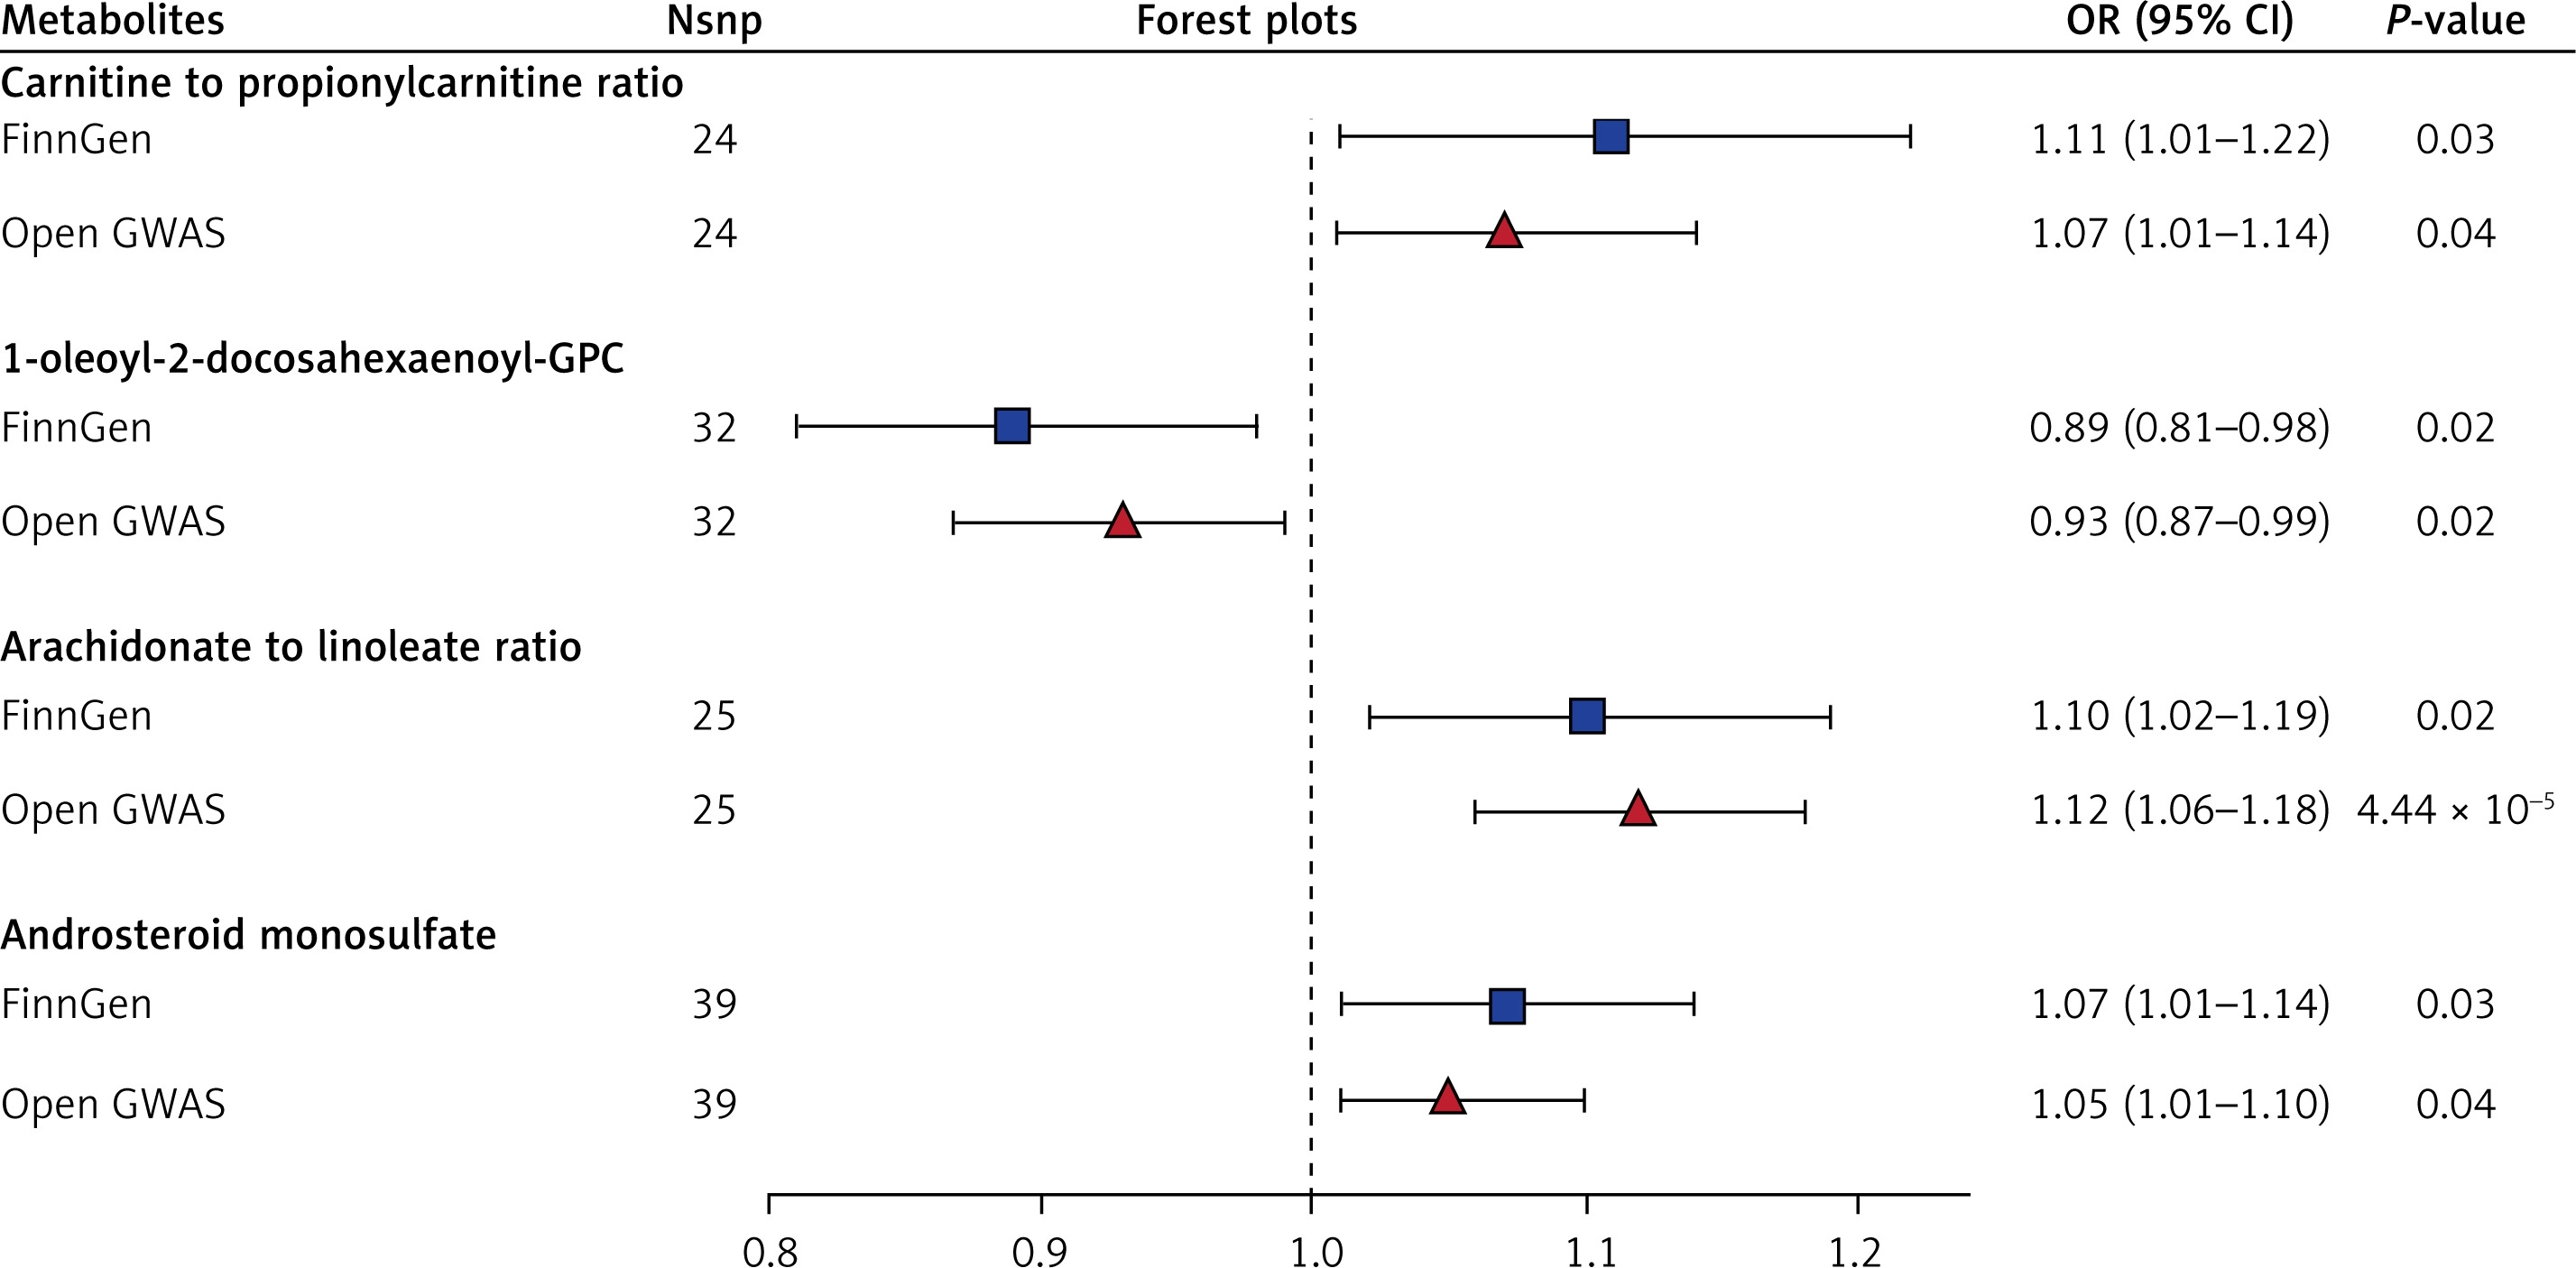
Figure 6
MR leave-one-out sensitivity analyses for overlapped metabolites/ratios and colorectal cancer. A1, A2 – carnitine to propionylcarnitine (C3) ratio B1, B2 – 1-oleoyl-2-docosahexaenoyl-GPC; C1, C2 – arachidonate to linoleate ratio; D1, D2 – androsterone sulfate. There is no statistically significant difference between the result of a single SNP and the total result
Discussion
We conducted a rigorous MR analysis of GWAS data from two separate databases to explore the causal relationships between 1400 blood metabolites and metabolite ratios and gastrointestinal tumor risk. In order to ensure the credibility of the results, we chose the intersection of the results of the two databases. The overlapping results from two authoritative databases indicated that 5-methyluridine and 1-dihomo-linolenylglycerol were positively correlated with GC risk, and sphingomyelin was negatively correlated with GC risk. Carnitine to propionylcarnitine (C3) ratio, arachidonate to linoleate ratio, and androsterone sulfate were positively correlated with CRC risk, and 1-oleoyl-2-docosahexaenoyl-GPC was negatively correlated with CRC risk.
Helicobacter pylori infection is recognized as a significant high-risk factor for GC [33]. Other risk factors for GC include family history, alcohol consumption, smoking, advanced age, and a high-salt diet [4]. For CRC, the main risk factors are family history, advanced age, smoking, alcohol consumption, obesity, long-term inflammatory bowel disease, a heavy intake of red meat, and an imbalanced intestinal microbiome [34, 35]. Although many risk factors associated with gastrointestinal tumors have been identified, the underlying mechanisms of their development remain complex and not fully understood. Gastrointestinal tumors often develop insidiously, with no obvious clinical symptoms in the early stages. As a result, many patients are diagnosed only at advanced stages of the disease [36]. Therefore, early diagnosis of gastrointestinal tumors is crucial in preventing further disease progression and improving patient survival. Identifying reliable serum markers can significantly facilitate the early diagnosis of gastrointestinal tumors. In recent years, the widespread use of metabolomics has prompted scientists to investigate the relationship between blood metabolites and tumor risk. However, the vast number of blood metabolites poses challenges, as many studies lack clinical validation or present conflicting results. Therefore, before more RCTs are conducted, this MR study can provide credible insights into the risk relationships between blood metabolites and gastrointestinal tumors, potentially identifying effective markers for early clinical diagnosis and treatment. Previously, Lu et al. examined the connection between 469 blood metabolites and the risk of gastrointestinal tumors [37], while Yun et al. focused on 486 blood metabolites in relation to colorectal cancer [38]. In contrast, our study investigated the relationship between 1,400 blood metabolites and metabolite ratios concerning gastrointestinal tumor risk, significantly broadening the scope of research. Additionally, unlike previous studies that relied on single databases, we integrated results from two databases, enhancing the credibility of our findings.
5-methyluridine, also known as m5U, is an integral part of mRNAs, rRNAs, tRNAs, and lncRNAs and affects their function, which plays a role in epi transcriptome variation [39, 40]. There are few studies on the relationship between m5U and tumors. Some studies have shown that m5U is related to the development of breast cancer, but the specific mechanism has not been reported [41]. m5U is the main chemical that modifies tRNA, which promotes protein synthesis [42]. The growth, invasion, and metastasis of tumor cells require a large number of proteins [43, 44]. Therefore, we speculated that the excessive modification of m5U could provide abundant essential proteins for gastrointestinal tumor cells, thus promoting the occurrence and development of tumors. Few studies have conducted in-depth research on 1-dihomo-linolenylglycerol, and its relationship with gastric cancer risk requires further experimental confirmation. Sphingomyelin is an indispensable substance for cells. It is closely related to lipid transport and affects cell proliferation [45]. Recent studies have shown that sphingomyelin can inhibit tumor development. For instance, Fhaner et al. found that metastatic CRC cells exhibit lower levels of sphingomyelin [46]. Similarly, Wang et al. reported that the most aggressive breast cancer cells have lower sphingomyelin levels compared to normal cells [47]. Additionally, sphingomyelin content in lung and esophageal cancer tissues has also been observed to decline [48, 49]. Furthermore, silencing the sphingomyelin synthase SGMS1 disrupts adhesion and junctions between renal collecting duct cells, transforming epithelial cells into mesenchymal cells [50]. Moreover, the activation of sphingomyelin biosynthesis through 2-hydroxyoleic acid has been shown to induce cell death in glioma cell lines [51]. Sphingomyelin also has the potential to enhance the anti-tumor effects of chemotherapeutic drugs that interfere with lipid metabolism. For example, alkyl-lysophospholipid tends to accumulate in micro-domains rich in sphingomyelin. Increasing sphingomyelin levels can therefore improve the bioavailability of these chemotherapeutic agents, subsequently enhancing their anti-tumor effects [52]. Sphingomyelin influences tumor cell proliferation through various biological processes, including cell cycle arrest, endoplasmic reticulum stress, autophagy, and sphingomyelin deposition. However, the specific mechanisms underlying these effects require further investigation.
Carnitine plays a vital role in energy metabolism, primarily by transporting fatty acids to the mitochondria for β-oxidation [53]. Increasing evidence suggests that carnitine may inhibit tumor development. For instance, Chang et al. discovered that carnitine can prevent mitochondrial damage and impede the progression of liver cancer [54]. Furthermore, it has been reported that inhibiting carnitine metabolism can promote the stem cell-like nature of liver cancer [55]. In contrast, there is limited research on the relationship between propionylcarnitine and tumors. Current findings suggest that propionylcarnitine may contribute to cardiovascular diseases through mechanisms such as insulin resistance, energy metabolism disorders, and inflammation [56]. These same factors can also promote tumor development, indicating that propionylcarnitine might act as a metabolite that supports tumor growth. Overall, carnitine and propionylcarnitine exhibit different effects on tumor occurrence. The combined influence of these two substances on tumor promotion, especially concerning gastrointestinal tumors, requires further investigation through RCTs. Arachidonate is catalyzed by cyclooxygenase (COX)-1 and COX-2 to produce prostaglandins and leukotrienes, which have been shown to induce tumor microenvironment remodeling and immunosuppression, thereby promoting the development of various tumors, including CRC [57]. Research has confirmed that prostaglandins can enhance the proliferation of CRC cells through the RAS-ERK and β-catenin signaling pathways [58, 59]. Linoleate is an essential unsaturated fatty acid for humans; however, excessive intake of linoleate has been associated with an increased risk of CRC [60, 61]. During the production of prostaglandin E2, linoleate interacts with free radicals produced by COX, contributing to CRC development [62]. The ratio of arachidonate to linoleate is expected to serve as a potential indicator for the clinical diagnosis of CRC, although more RCTs are needed to confirm this. Reports on androsterone sulfate are limited, and its physiological role remains largely unknown. The few existing studies indicate a close relationship to cardiovascular disease [63]. There are many similarities between the mechanisms of blood vessel formation and tumor development, suggesting that androsterone sulfate may emerge as a potential tumor marker. Given the mechanistic overlaps between cardiovascular diseases and tumors, androsterone sulfate might be a promising marker in tumor biology. Lastly, 1-oleoyl-2-docosahexaenoyl-GPC is a phospholipid, with no RCTs demonstrating an association with tumors. However, an MR study has confirmed that 1-oleoyl-2-docosahexaenoyl-GPC serves as a protective factor against thoracic aortic aneurysm [64]. Our study concluded that 1-oleoyl-2-docosahexaenoyl-GPC is also protective against CRC. Further research is needed to explore how 1-oleoyl-2-docosahexaenoyl-GPC exerts its protective effects.
This MR study has several notable advantages. First, unlike previous observational studies, MR studies can simulate RCTs and are not impacted by reverse causation or confounding factors. Second, our study was conducted and tested for heterogeneity, bias, and horizontal pleiotropy in strict accordance with the three main assumptions of MR studies, and the results obtained were plausible. Third, compared with previous MR studies with several hundred metabolites and disease causality, we included 1400 metabolites and metabolite ratios, which explored a wider range and uncovered more metabolites and ratios. Fourth, unlike earlier MR analyses that relied on single databases, we combined results from the two largest and most authoritative databases, enhancing the understanding of the relationship between 1,400 metabolites and metabolite ratios and the risk of gastrointestinal tumors. Lastly, we applied the FDR method to correct P-values, ensuring that our results are more rigorous.
However, there are some limitations to this study. Of note, the relaxation of the significance threshold for selecting IVs is common in MR studies, but in this case, due to the limited number of SNPs with genome-wide significance, it potentially violates the relevance assumption of MR analysis. While the study ensured that the F-values of all SNPs were greater than 10 to exclude weak IVs, the relaxed threshold may still compromise the robustness of the causal inferences. Furthermore, genetic variations and metabolic profiles can differ significantly across populations, and the identified metabolites may not have the same associations in non-European cohorts. Another limitation is the small number of metabolites that survived the rigorous screening process, which hindered meaningful metabolic pathway analysis using Metabo-Analyst 5.0. The inability to perform enrichment analysis limits the understanding of the biological mechanisms underlying the observed associations. Additionally, the sample size, while substantial, may still be insufficient to detect weaker associations or rare metabolic signals. Also, while MR studies are less susceptible to confounding and reverse causation compared to observational studies, they are not immune to horizontal pleiotropy, where genetic variants influence the outcome through pathways other than the exposure. Although the study employed multiple sensitivity analyses to address this issue, residual pleiotropy could still affect the results. From another viewpoint, the study’s focus on blood metabolites may not capture the full complexity of metabolic interactions within the tumor microenvironment. Tissue-specific metabolites or those derived from the gut microbiome could also play significant roles in gastrointestinal tumor development but were not addressed in this analysis. Furthermore, the study did not account for potential interactions between metabolites, such as synergistic or antagonistic effects, which could influence tumor risk. Lastly, the clinical utility of these metabolites remains to be established. Translating these biomarkers into diagnostic or prognostic tools will require extensive validation in independent cohorts and experimental studies to elucidate their functional roles in tumor biology.
In conclusion, this MR study is the first to investigate the causal relationship between 1400 blood metabolites and metabolite ratios and gastrointestinal tumor risk. The overlapping results of two authoritative databases show that 3 blood metabolites are associated with the risk of GC; 4 blood metabolites and ratios are associated with the risk of CRC. The results can guide early clinical diagnosis and treatment of gastrointestinal tumors.