Introduction
Stroke is a major cardiovascular (CV) event that can lead to brain tissue damage and functional disability, as well as death [1]. Due to these detrimental effects of stroke, evaluating stroke risk factors can be of high importance to prevent this potentially fatal CV disease (CVD) or determine its outcomes.
Sleep duration is recognised as a major factor for a healthier lifestyle and improved cardiac function [2]. In this context, sleeping patterns (i.e. short or long duration) have been closely linked to morbidity and mortality [3, 4], as well as with chronic cardiometabolic disease, including obesity, hypertension, diabetes, respiratory diseases, coronary heart disease and reduced renal function (CHD) [2, 5–9]. There are several parameters that can influence sleep duration, such as cultural, social, psychological, behavioural, pathophysiological and environmental factors [10, 11].
Considering the potential harmful effects of unfavourable sleep duration on public health, it is clinically important to establish whether a causal relationship exists between sleep duration and CVD. Recent studies showed that sleep duration may be a risk factor for CVD [12]. Both short (< 7 h) and long (> 8 h) sleep duration have been associated with a greater risk of myocardial infarction (MI) [12–14]. However, the National Health and Nutrition Examination Survey (NHANES), the Nurses’ Health Study (NHS) and the Monitoring Trends and Determinants on Cardiovascular Disease (MONICA) Augsburg cohort study reported inconsistent findings regarding the association between sleep duration and CHD risk [5, 15, 16]. A prospective study of 461,347 UK Biobank (UKB) individuals found that short and long sleep duration were associated with a 20% and 34% higher risk of incident MI, respectively, compared with sleeping 6–9 h, independent of individuals’ genetic predisposition to CHD [17].
With regards to stroke, epidemiological studies showed a significant association between long sleep duration and stroke risk [16, 18, 19]. In contrast, no significant relationship between sleep duration and stroke risk was observed in another prospective cohort study of 2,282 males [20]. Previous systematic reviews evaluated the links between sleep duration, CV outcomes and all-cause death [11, 12], reporting that both short and long duration of sleep were associated with a greater risk of total mortality and/or CVD morbidity, including CHD and stroke. However, the high heterogeneity between the studies was a limitation, making it difficult to draw reliable conclusions or support causal inference.
Given the controversial evidence on the potential role of sleep duration on CVD outcomes and its importance for public health, there is an unmet need to elucidate this link in terms of developing effective approaches (including drug therapy) for stroke prevention and management. Epidemiological studies provide only simple estimates of the associations between sleep duration and disease risk, and they are prone to bias. Therefore, Mendelian randomization (MR) studies can evaluate these relationships using large-scale genetic data, involving single nucleoid polymorphisms (SNPs) as proxies for lifetime exposure, to provide a more reliable indication of a causal role of sleep duration in stroke risk [21].
In the present study, a comprehensive systematic review and meta-analysis was conducted to examine the associations between sleep duration and the risk of total stroke based on data from prospective cohort studies. Second, an MR analysis was performed to assess the associations between sleep duration (< 7 vs. > 8 h) and different types of stroke, overcoming the limitations of epidemiological studies (i.e. residual bias, confounding factors and reverse causation) [22].
Material and methods
Cohort studies
Literature search and study selection
The meta-analysis was designed, conducted and reported according to the Meta-analysis Of Observational Studies in Epidemiology (MOOSE) guidelines [23] (the MOOSE checklist is provided in Supplementary Table SI). The primary exposure of interest was sleep duration, and stroke was the primary outcome. Prospective cohort studies published up to 31 October 2019 (without language restriction) were searched using the PubMed, Embase, and Scopus databases; the query search syntax is shown in Supplementary Table SII. When required, further searches were performed regarding the reference list of eligible articles, previous reviews or meta-analyses, as well as email correspondence with authors for additional data.
Study selection
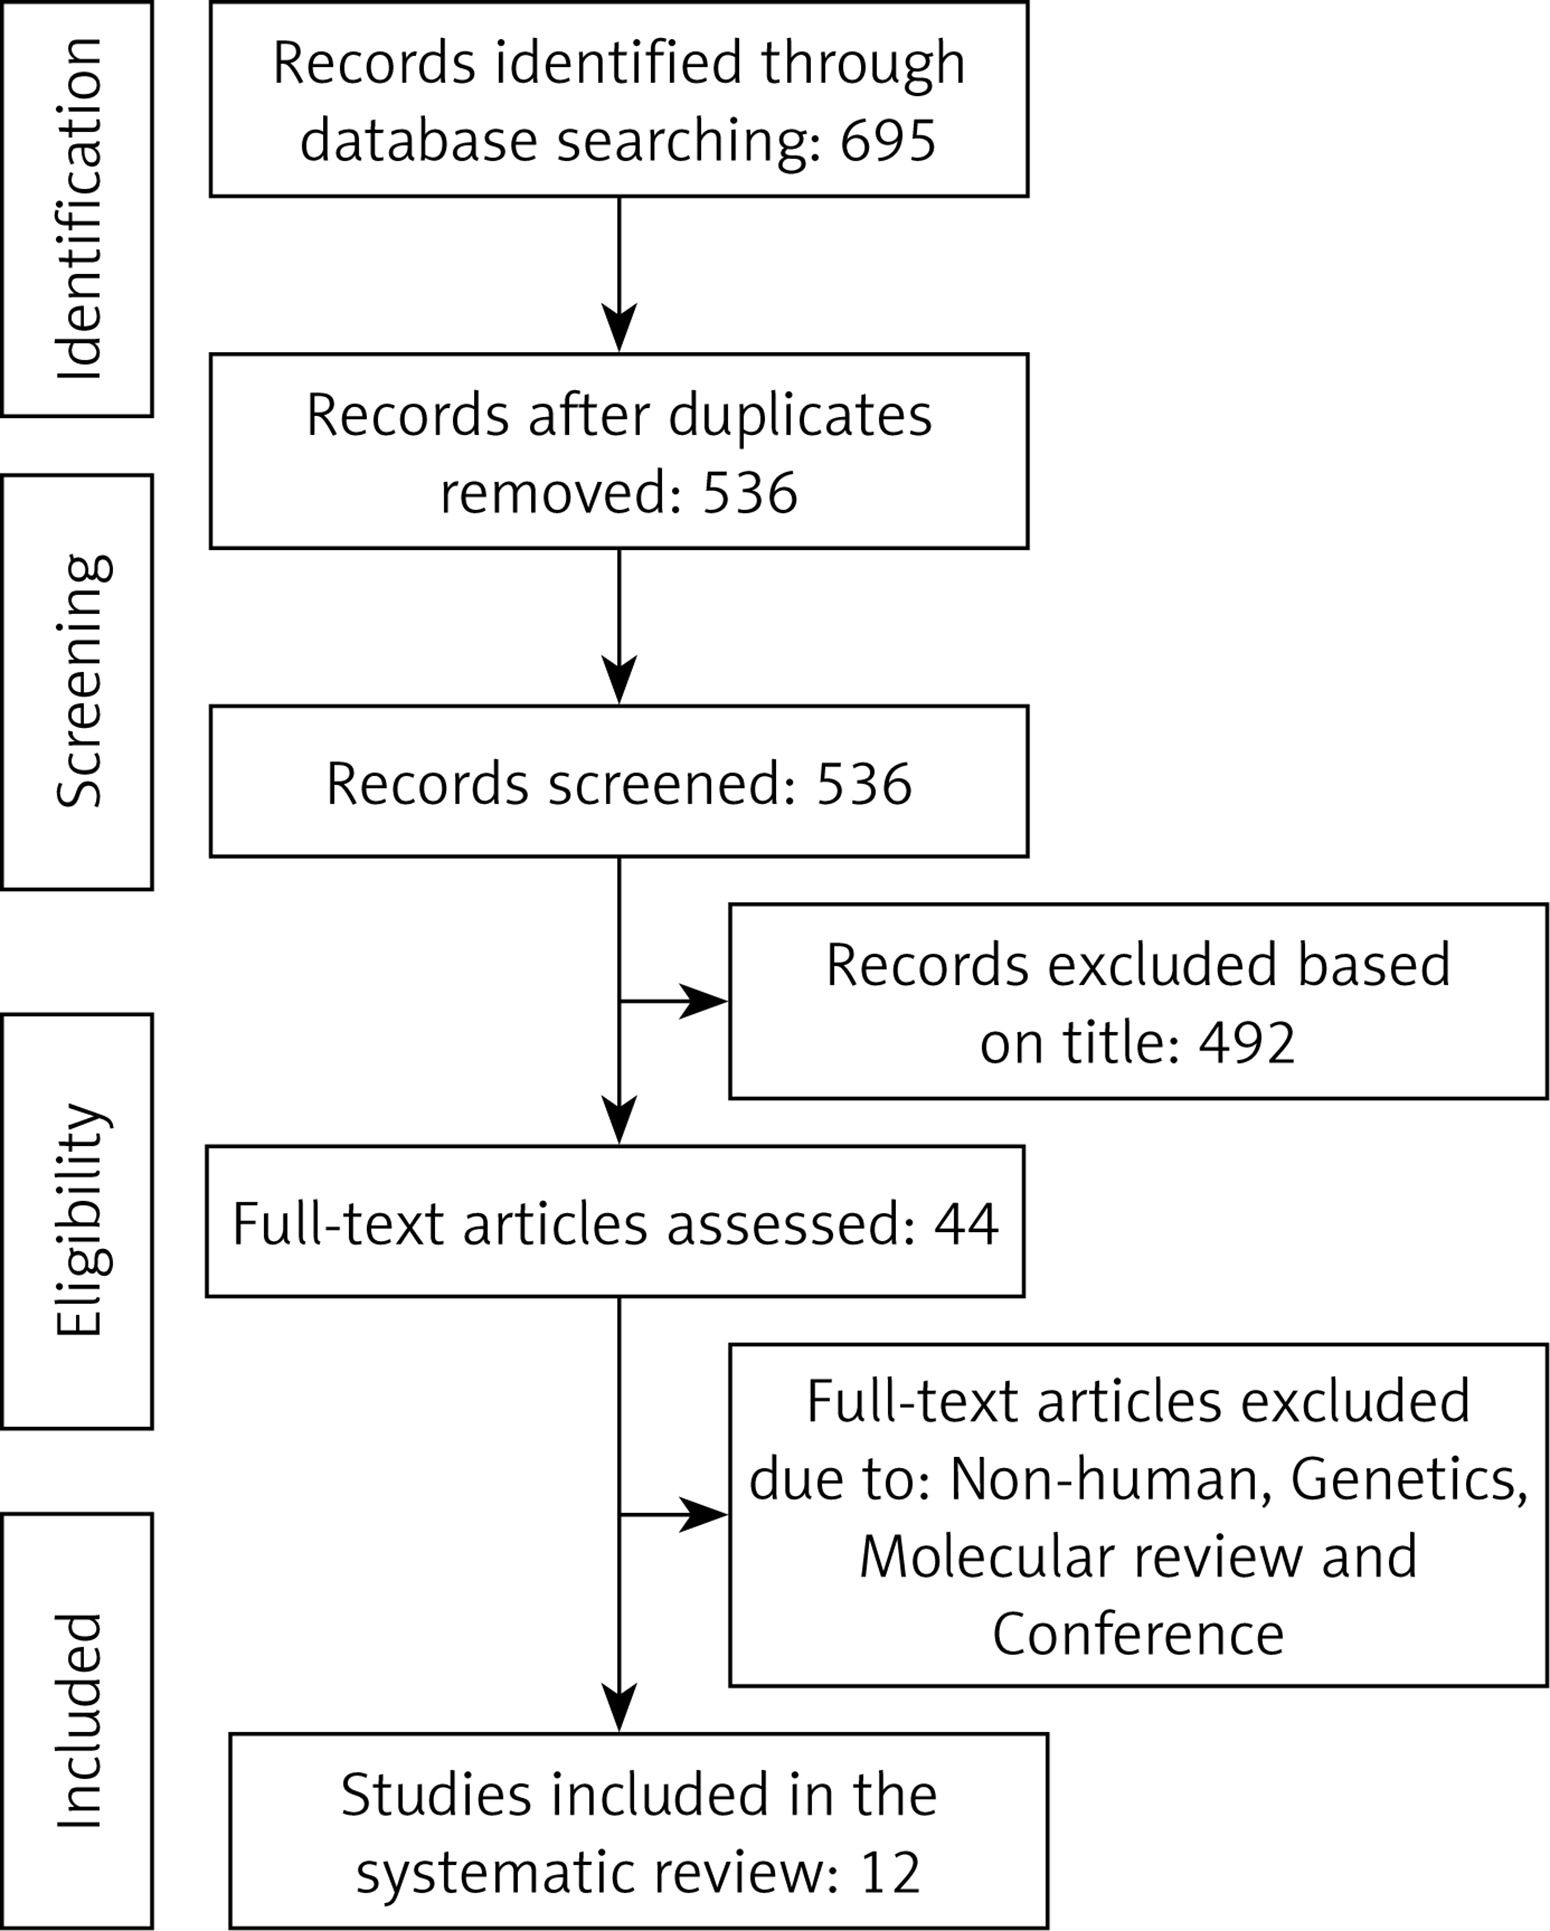
Predefined inclusion criteria (see below) were used to determine prospective cohort studies regarding the association between sleep duration and stroke risk. Duplicates were removed and then titles and abstracts were screened by two reviewers (MM and NS). To avoid bias, both reviewers were blinded to the names, qualifications or affiliations of the study authors. The overall agreement between both reviewers was excellent (kappa index: 0.91; p < 0.001), and a meeting was held to resolve any disagreements between reviewers prior to articles being retrieved (a flow chart outlining this process is presented in Figure 1).
We included studies if the following criteria were met: (1) the topic of interest was sleep duration; (2) the studies were population-based cohort studies which reported stroke risk data; (3) relative risk (RR), hazard ratio (HR) or odds ratio (OR) estimates with 95% confidence interval (CI) adjusted for multivariable factors were available or could be calculated.
We excluded studies if the following criteria were met: (1) narrative reviews, reviews, comments, opinion papers, methodological reports, editorials, letters, or any other publications lacking primary data and/or specific descriptions of the methods which were used; (2) not population-based cohort studies; (3) RR, HR or OR estimates with 95% CI were either not available or could not be calculated.
Data extraction and management
The full text of studies meeting the inclusion criteria were retrieved, and eligibility was determined via screening by two reviewers (MM and NS). An assessment of study quality was determined using the Newcastle-Ottawa Scale (NOS) (Supplementary Table SIII) [24]. Furthermore, sources of funding pertaining to each eligible study were investigated. Following an assessment of methodological quality, both reviewers (MM and NS) extracted data using a purpose-designed data extraction form. Using these data, the most important results from each study were summarized by each reviewer independently. Both summaries were then compared, and a third reviewer (MB) was then consulted to resolve any differences. Any necessary additional calculations regarding the study data were performed by the first reviewer (MM) and verified by the second reviewer (NS). Specific information which was extracted from each eligible study included: author, year and references, study name, proportion male, mean age, follow-up time (years), assessment of sleep duration, and main confounders (Table I).
Table I
Characteristics of prospective cohort studies included in the meta-analysis
| Author, year (citation number) | Country, region/cohort | Men (%) | Mean age | Follow-up time [years] | Assessment of sleep duration | Main confounders |
|---|---|---|---|---|---|---|
| Chen, 2008 [19] | Prospective cohort study, USA | 0 | Unclear | 7.5 | Interview questioning | Age, race, education, family income, employment status, depression, smoking, exercise, use of hormone therapy, prior cardiovascular disease, diabetes mellitus, hypertension, high cholesterol level requiring pills and body mass index |
| Hamazaki, 2011 [20] | Prospective cohort study, Japan | 100 | 44 | 14 | Self-administered questionnaire | Age, type of job, working hours, mental workload, body mass index, mean blood pressure, HbA1c, total cholesterol, current smoking habit, drinking habit, leisure-time physical activity, medication for hypertension, diabetes, hypercholesterolaemia |
| Helbig, 2015 [44] | Prospective cohort study, Germany | 50 | 48 | 14 | Interview questioning | Age, survey, education, physical activity, alcohol consumption, current smoking activity, body mass index, hypertension, diabetes and dyslipidaemia |
| Leng, 2015 [42] | Prospective cohort study, UK | 46 | 62 | 9.5 | Questionnaire | Age, sex, social class, education, marital status, smoking, alcohol intake, hypnotic drug use, family history of stroke, body mass index, physical activity, depression, systolic blood pressure, diastolic blood pressure, preexisting diabetes, myocardial infarction, cholesterol level and hypertension drug use |
| Magee, 2011 [46] | Prospective cohort study, Australia | 47 | 63 | Unclear | Self-reported questionnaire | Age, sex, country of birth, marital status, education, employment status, remoteness, body mass index, physical activity, smoking, alcohol and screen time |
| Qureshi, 1997 [16] | Prospective cohort study, USA | 36 | Unclear | 10 | Participants were interviewed | Age, sex, race, education, cigarette smoking, systolic blood pressure, serum cholesterol level, diabetes and body mass index |
| Petrov, 2014 [41] | Prospective cohort study, USA | 44 | 61 | 2 | Participants were questioned on sleep | Demographics, stroke risk factors, psychological symptoms, health behaviours and diet quality |
| Song, 2016 [40] | Prospective cohort study, China | 79 | 51 | 7.9 | Interviews, death certificates, discharge summaries and medical records | Age, sex, marital status, income, education level, smoking status, physical activity, family history of stroke, body mass index, blood pressure, blood glucose, total cholesterol, lipid-lowering drug use, hypoglycaemic drug use, history of myocardial infarction, snoring status, C-reactive protein and atrial fibrillation |
| Tu, 2012 [47] | Prospective cohort study, China | 0 | 60 | 4 | Participants were questioned on sleep | Age, education level, occupational status, night-shift work, annual income, menopausal status, marital status, number of live births, physical activity, passive smoking, tea consumption, energy intake, time spent watching TV and vitamin supplement use |
| Von Ruesten, 2012 [45] | Prospective cohort study, Germany | 39 | 49 | 8 | Participants were interviewed about their sleep | Age, sex, sleeping disorders, alcohol intake, smoking status, walking cycling sports, employment status, education, body mass index, waist-to-hip ratio, hypertension, high blood lipid, caffeinated beverages, satisfaction with life, satisfaction with health and intake of antidepressants |
| Amagai, 2010 [43] | Prospective cohort study, Japan | 39 | 55 | 10.7 | Interview for sleep duration | Age, systolic blood pressure, total cholesterol, body mass index, smoking habits and alcohol drinking habits |
| Westerlund, 2013 [48] | Prospective cohort study, Sweden | 35 | Unclear | 13 | Questionnaire | Age, sex, education, employment status, smoking, alcohol, snoring, work schedule, depressive symptoms, self-rated health, physical activity, body mass index, diabetes, lipid disturbance and hypertension |
Data synthesis and statistical analyses
For those studies which reported results from a variety of multivariable-adjusted models, only the model with the most confounding factors was incorporated into the meta-analysis. A random-effect model was employed to generate pooled RRs, 95% CI and P-values for heterogeneity. RRs comparing the highest and lowest categories were combined across studies to determine summary associations. The extent of heterogeneity across studies was examined using the I2 test [25–27]; an I2 > 50% with a two-sided p < 0.05 indicated significant heterogeneity [25–27].
Publication bias
To determine potential publication bias, Begg’s funnel plot asymmetry was investigated by visual inspection, and Begg’s rank correlation and Egger’s weighted regression tests were also used [28]. To adjust for the effects of publication bias, the Duval and Tweedie trim method was used [28]. Comprehensive Meta-Analysis (CMA) V3 software (Biostat, NJ) was used to conduct the meta-analysis [29].
Mendelian randomization
Study design
For our MR study, a two-sample MR study design was used, and the largest genome-wide association studies (GWAS) on sleep duration (objectively and subjectively measured) and interested outcomes were used to obtain summary statistics. We then applied methods to estimate the unbiased effect of sleep traits on the risk of different types of stroke, i.e. ischemic (IS), cardioembolic (CES), large artery (LAS), and small vessel (SVS).
Genetic instruments for sleep duration
Procedures pertaining to genotyping, quality control, and imputation which have been used in the UKB have been previously described [30]. From the largest GWAS, 78 SNPs were identified to be associated with sleep duration (self-reported) among individuals of European ancestry (n = 446,118) (Supplementary Table SIV) [31]. We hypothesized that the association between sleep duration and stroke risk might be non-linear; therefore, we also used data pertaining to 27 SNPs associated with short sleep (< 7 h; n = 106,192 cases/305,742 controls) and 8 SNPs related to long sleep (> 8 h; n = 34,184 cases/305,742 controls) in the two-sample MR analysis [31]. We used GWAS data (n = 85,205 participants) from the UKB for genetic variants known to be robustly associated with accelerometer-driven sleep trait data (nocturnal sleep duration), which were compared with causal estimates obtained by the genetic variants associated with self-reported sleep duration (Supplementary Table SIV). Data on this procedure have been published previously [32]. We identified proxy SNPs with a minimum linkage disequilibrium (LD) r2 = 0.8 if a SNP was unavailable for the outcome GWAS summary statistics. We restricted our genetic instrument to independent SNPs not in linkage disequilibrium (p = 0.0001) to minimize bias in effect estimates induced by correlation between SNPs. Herein, we refer to a set of SNPs which act as a proxy for sleep duration as “genetic instruments”.
Association of genetic instruments with outcome
We used the largest available extensively genotyped dataset, METASTROKE, a collaboration of the International Stroke Genetics Consortium, to determine genetic associations with different ischemic stroke types [33]. This dataset included GWAS data on 34,217 IS cases and 404,630 controls of European ancestry from across 15 studies, subtyped into SVS (n = 5,386), LAS (n = 4,373) and CES (n = 7,193) [33]. The majority of the IS cases involved brain imaging confirmation. Approximately 50% of the cases had IS subtype information (2,365 CES, 2,167 LAS and 1,894 SVS cases) based on the Trial of ORG 10172 in Acute Stroke Treatment (TOAST) classification [34]. Additional phenotype descriptions and details of individual studies included in the dataset are available elsewhere [33].
MR analysis
The effects of 5 instruments were combined using the inverse-variance weighted (IVW) method as implemented using the TwoSampleMR package within the R environment (version 3.4.2, R Core Team, 2017). Heterogeneity was assessed by the Q value for IVW. The potential effects of pleiotropic variants on the final effect estimate were addressed by performing a sensitivity analysis, including weighted median (WM) and MR-Egger tests [35]. To identify instruments which might drive the MR results, sensitivity analysis was conducted using the leave-one-out method. The WM estimate provides correct estimates if SNPs accounting for ≥ 50% of the weight are valid instruments. Variants were weighted using inverse variance, and bootstrapping was applied to estimate CIs [35]. MR-Egger analysis can define estimates even under the assumption that all SNPs are invalid instruments if the assumption of instrument strength independent of direct effect (InSIDE) is satisfied [35]. That said, the InSIDE assumption is not easy to verify. The P-value of the intercept term from the MR-Egger analysis was used to assess the average directional pleiotropy across genetic variants [35]. Causal estimates in MR-Egger are less precise than those obtained using IVW MR [36]. Indeed, due to its lower statistical power the analysis, using MR-Egger has a lower false-positive but a higher false-negative rate than IVW [37].
The Q′ heterogeneity statistic [38] and the MR pleiotropy residual sum and outlier (MR-PRESSO) test [38] were used to assess heterogeneity among individual genetic variant estimates. The Q′ statistic uses modified 2nd order weights that are derived from a Taylor series expansion and accounts for the uncertainty in both the numerator and denominator of the instrumental variable ratio [38]. The MR-PRESSO framework detects and removes effect estimates which are outliers by regressing the variant-outcome associations on variant-exposure associations. Then a global heterogeneity test was implemented, comparing the observed distance between residual sums of squares of all variants to the regression line with the distance expected under the null hypothesis of no pleiotropy [39]. In addition, we applied an MR-Robust Adjusted Profile Score (RAPS) to correct for pleiotropy using robust adjusted profile scores. RAPS can also provide an unbiased causal estimate in the presence of weak instruments. We considered all results which were causal estimates that agreed in direction and magnitude across MR methods, as well as passing nominal significance in the IVW MR analysis and which did not, after applying heterogeneity tests, show evidence of bias from horizontal pleiotropy. To assess the instrumental variable analysis “exclusion-restriction” assumption, we used Ensembl (http://useast.ensembl.org/index.html), which provides a database of SNP phenotypes.
Ethics
The present meta-analysis and MR analysis used published or publicly available summary data without involvement of participants or original data collection. Ethical approval for each of the studies included in these analyses can be found in the original publications (including informed consent from each participant). The study conforms to the ethical guidelines of the 1975 Declaration of Helsinki.
Results
Meta-analysis and systematic review
Of 44 eligible full articles, 12 articles with 594,632 participants met the inclusion criteria (Figure 1). The included studies were published between 1997 [16] and 2016 [40] and originated from different countries, including the United States of America (3 studies) [16, 19, 41], UK (1 study) [42], Japan (2 studies) [20, 43], Germany (2 studies) [44, 45], Australia (1 study) [46], China (2 studies) [40, 47] and Sweden (1 study) [48]. A total of 3 studies presented sex-specific results, one study involved only men [20] and 2 studies only women [19, 47]. The age of the participants ranged from 44 (20) to 63 years (46) and the follow-up duration from 2 (41) to 14 years [20, 44]. Basic characteristics of the 12 prospective cohort studies are shown in Table I.
Sleep duration and risk of stroke
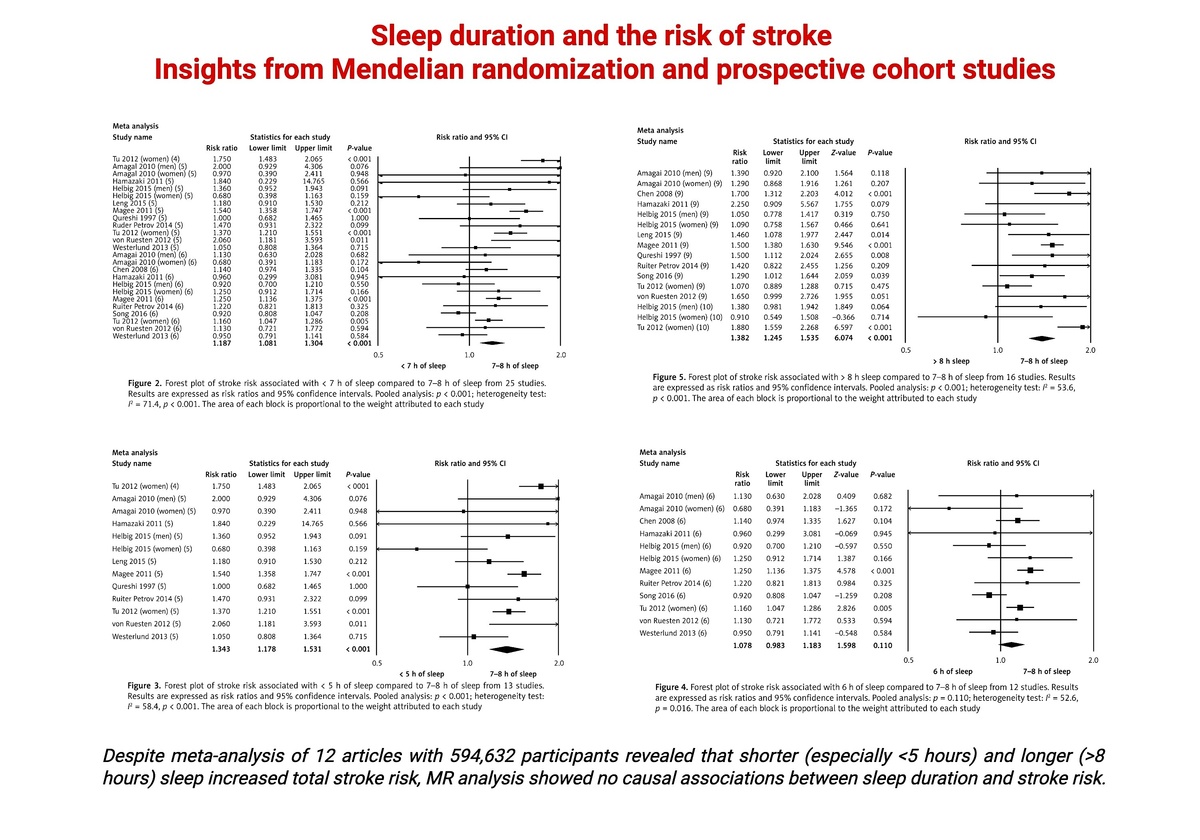
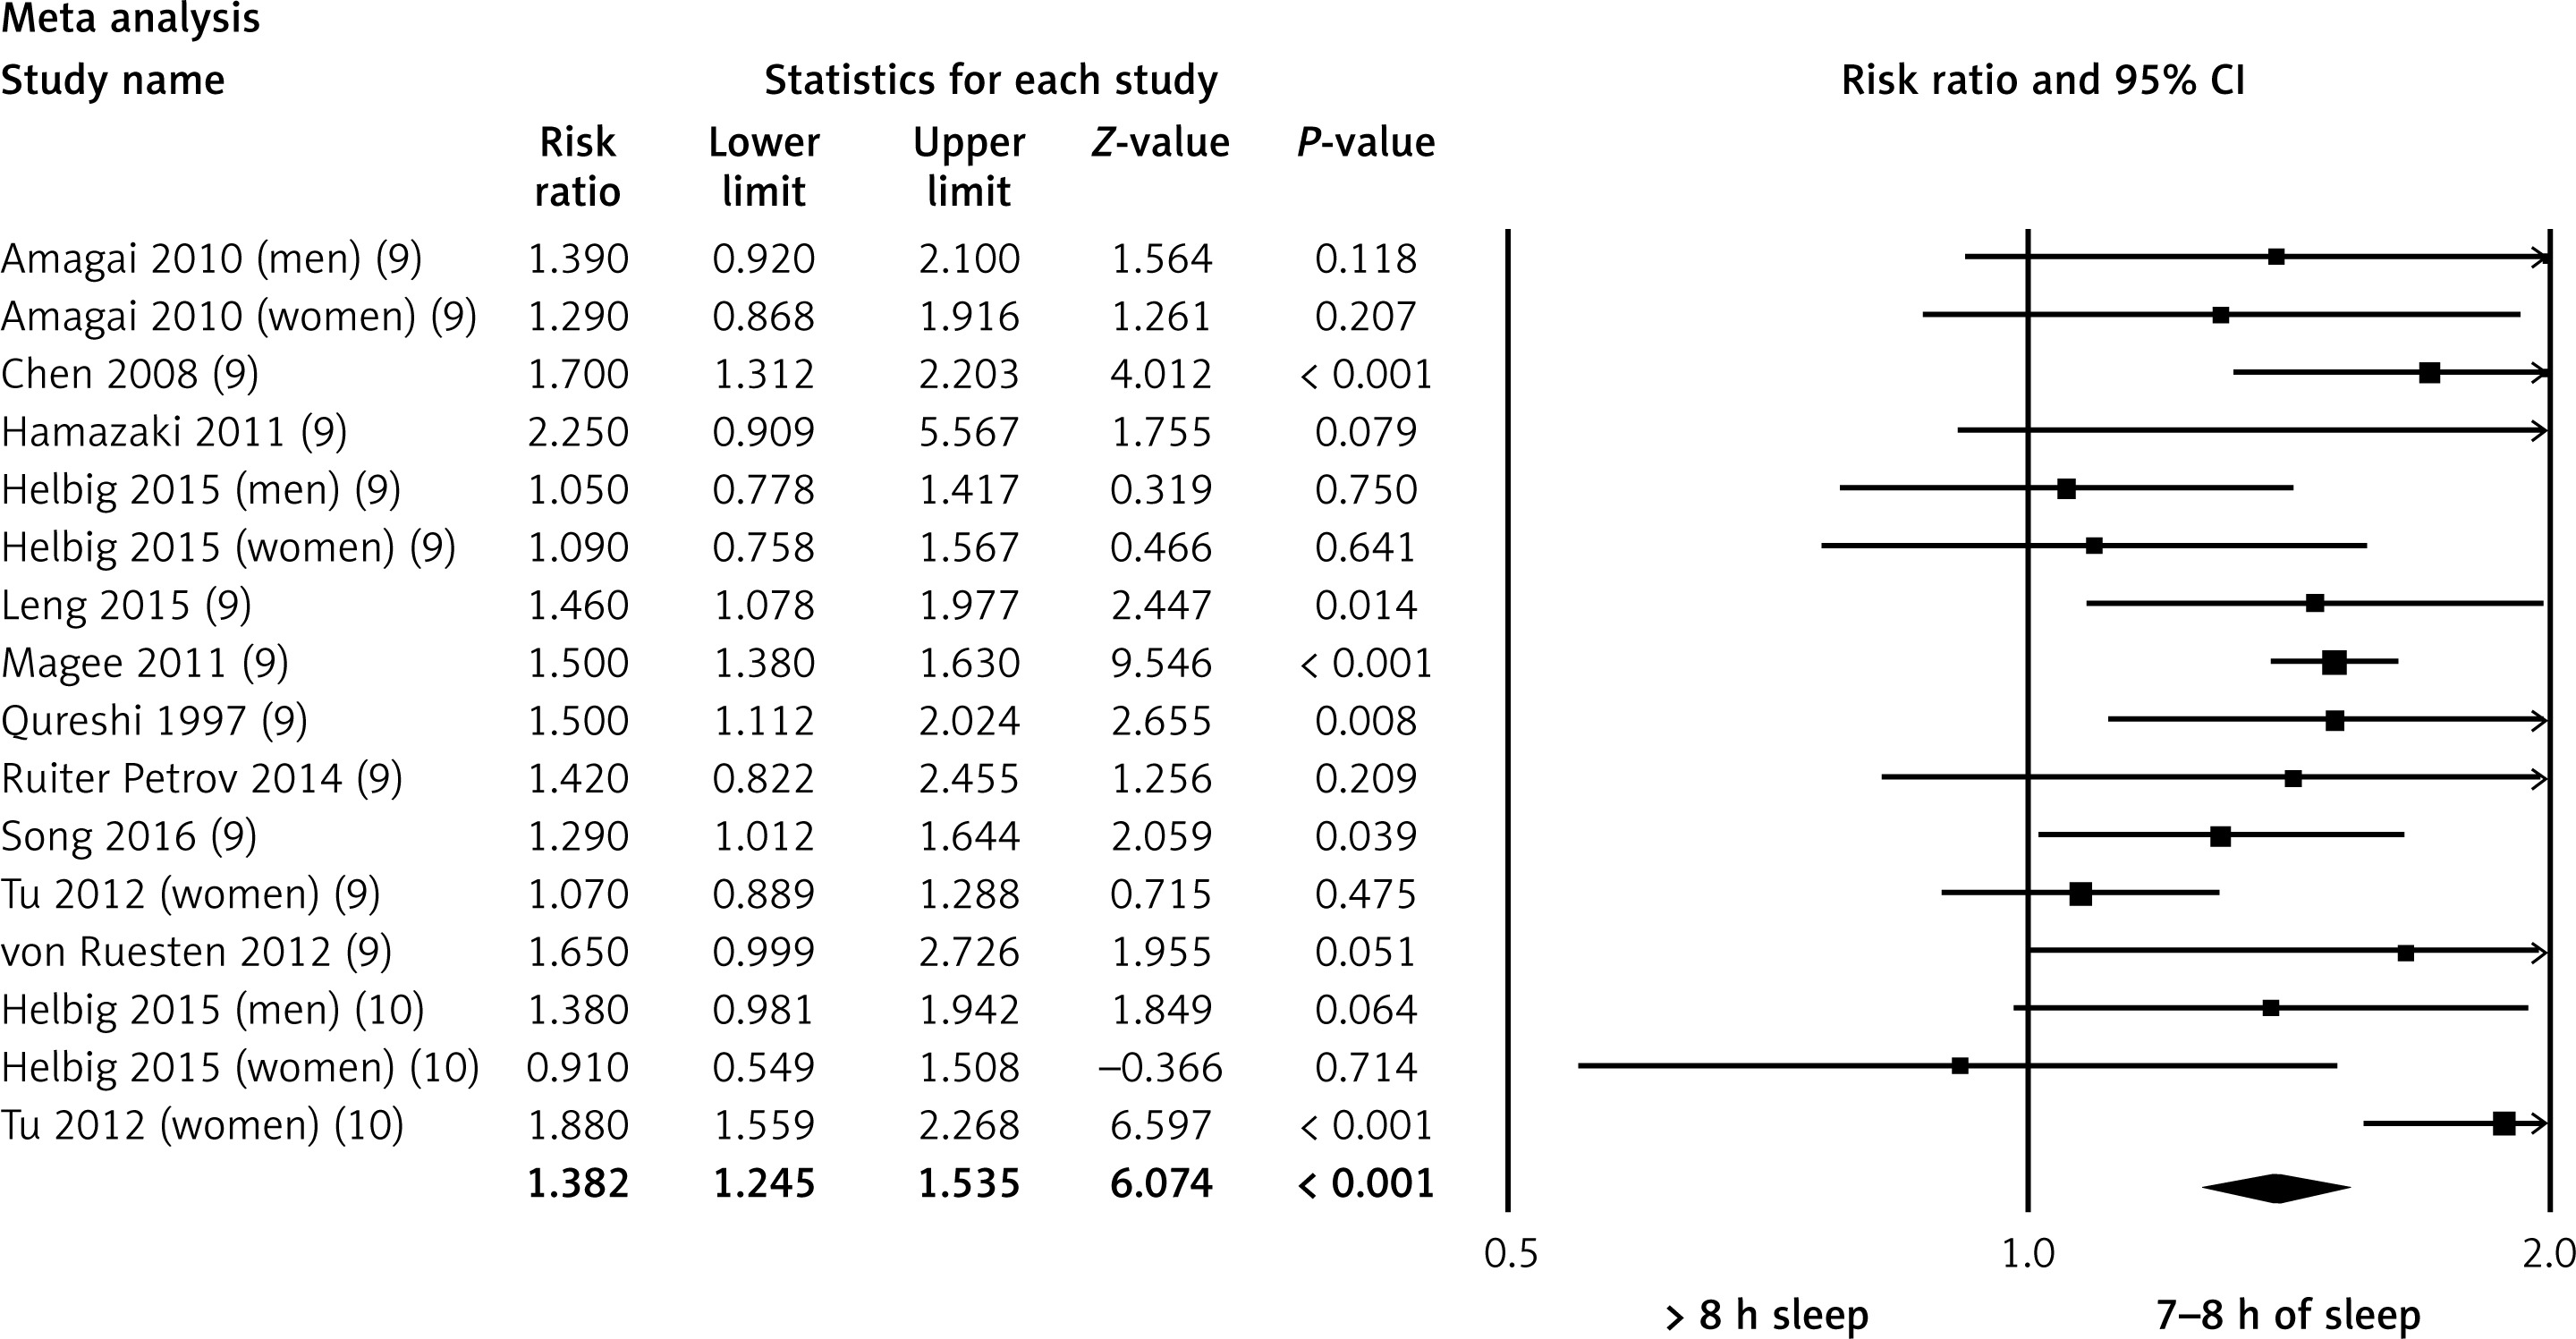
Compared with participants sleeping 7–8 h per night (reference group), individuals with < 7 h sleep had a significantly higher risk of stroke (RR = 1.18, 95% CI: 1.08–1.30, p < 0.001, n = 25 studies, Figure 2), but with a high level of heterogeneity (I2 = 71.4, p < 0.001). In gender analysis, stroke risk was non-significantly increased by 18% in men (RR = 1.18, 95% CI: 0.88–1.58, p = 0.263, n = 4 studies, I2 = 43.5, p = 0.150) and by 20% in women (RR = 1.20, 95% CI: 0.98–1.46, p = 0.064, n = 7 studies, I2 = 79.3, p < 0.001). We then pooled the risk of stroke for those with ≤ 5 h of sleep, who had a significantly greater stroke risk compared with the reference group (RR = 1.34, 95% CI: 1.17–1.53, p < 0.001, n = 13 studies, Figure 3), but again with a high level of heterogeneity (I2 = 58.4, p < 0.001). No association was observed for participants sleeping 6 h per night (compared with the reference group) (RR = 1.07, 95% CI: 0.98–1.18, p = 0.110, n = 12 studies, I2 = 52.6, p = 0.016, Figure 4). Longer sleep duration (i.e. > 8 h) was related to an increased stroke risk compared with 7–8 h sleep (RR = 1.38, 95% CI: 1.24–1.53, p < 0.001, n = 16 studies, I2 = 53.6, p < 0.001, Figure 5). In gender analysis, the risk was 22% in men (RR = 1.22, 95% CI: 1.00–1.49, p = 0.042, n = 3 studies, I2 = 0.0, p = 0.398) and 24% in women (RR = 1.24, 95% CI: 0.91–1.67, p = 0.159, n = 5 studies, I2 = 81.6, p < 0.001).
Figure 2
Forest plot of stroke risk associated with < 7 h of sleep compared to 7–8 h of sleep from 25 studies. Results are expressed as risk ratios and 95% confidence intervals. Pooled analysis: p < 0.001; heterogeneity test: I 2 = 71.4, p < 0.001. The area of each block is proportional to the weight attributed to each study
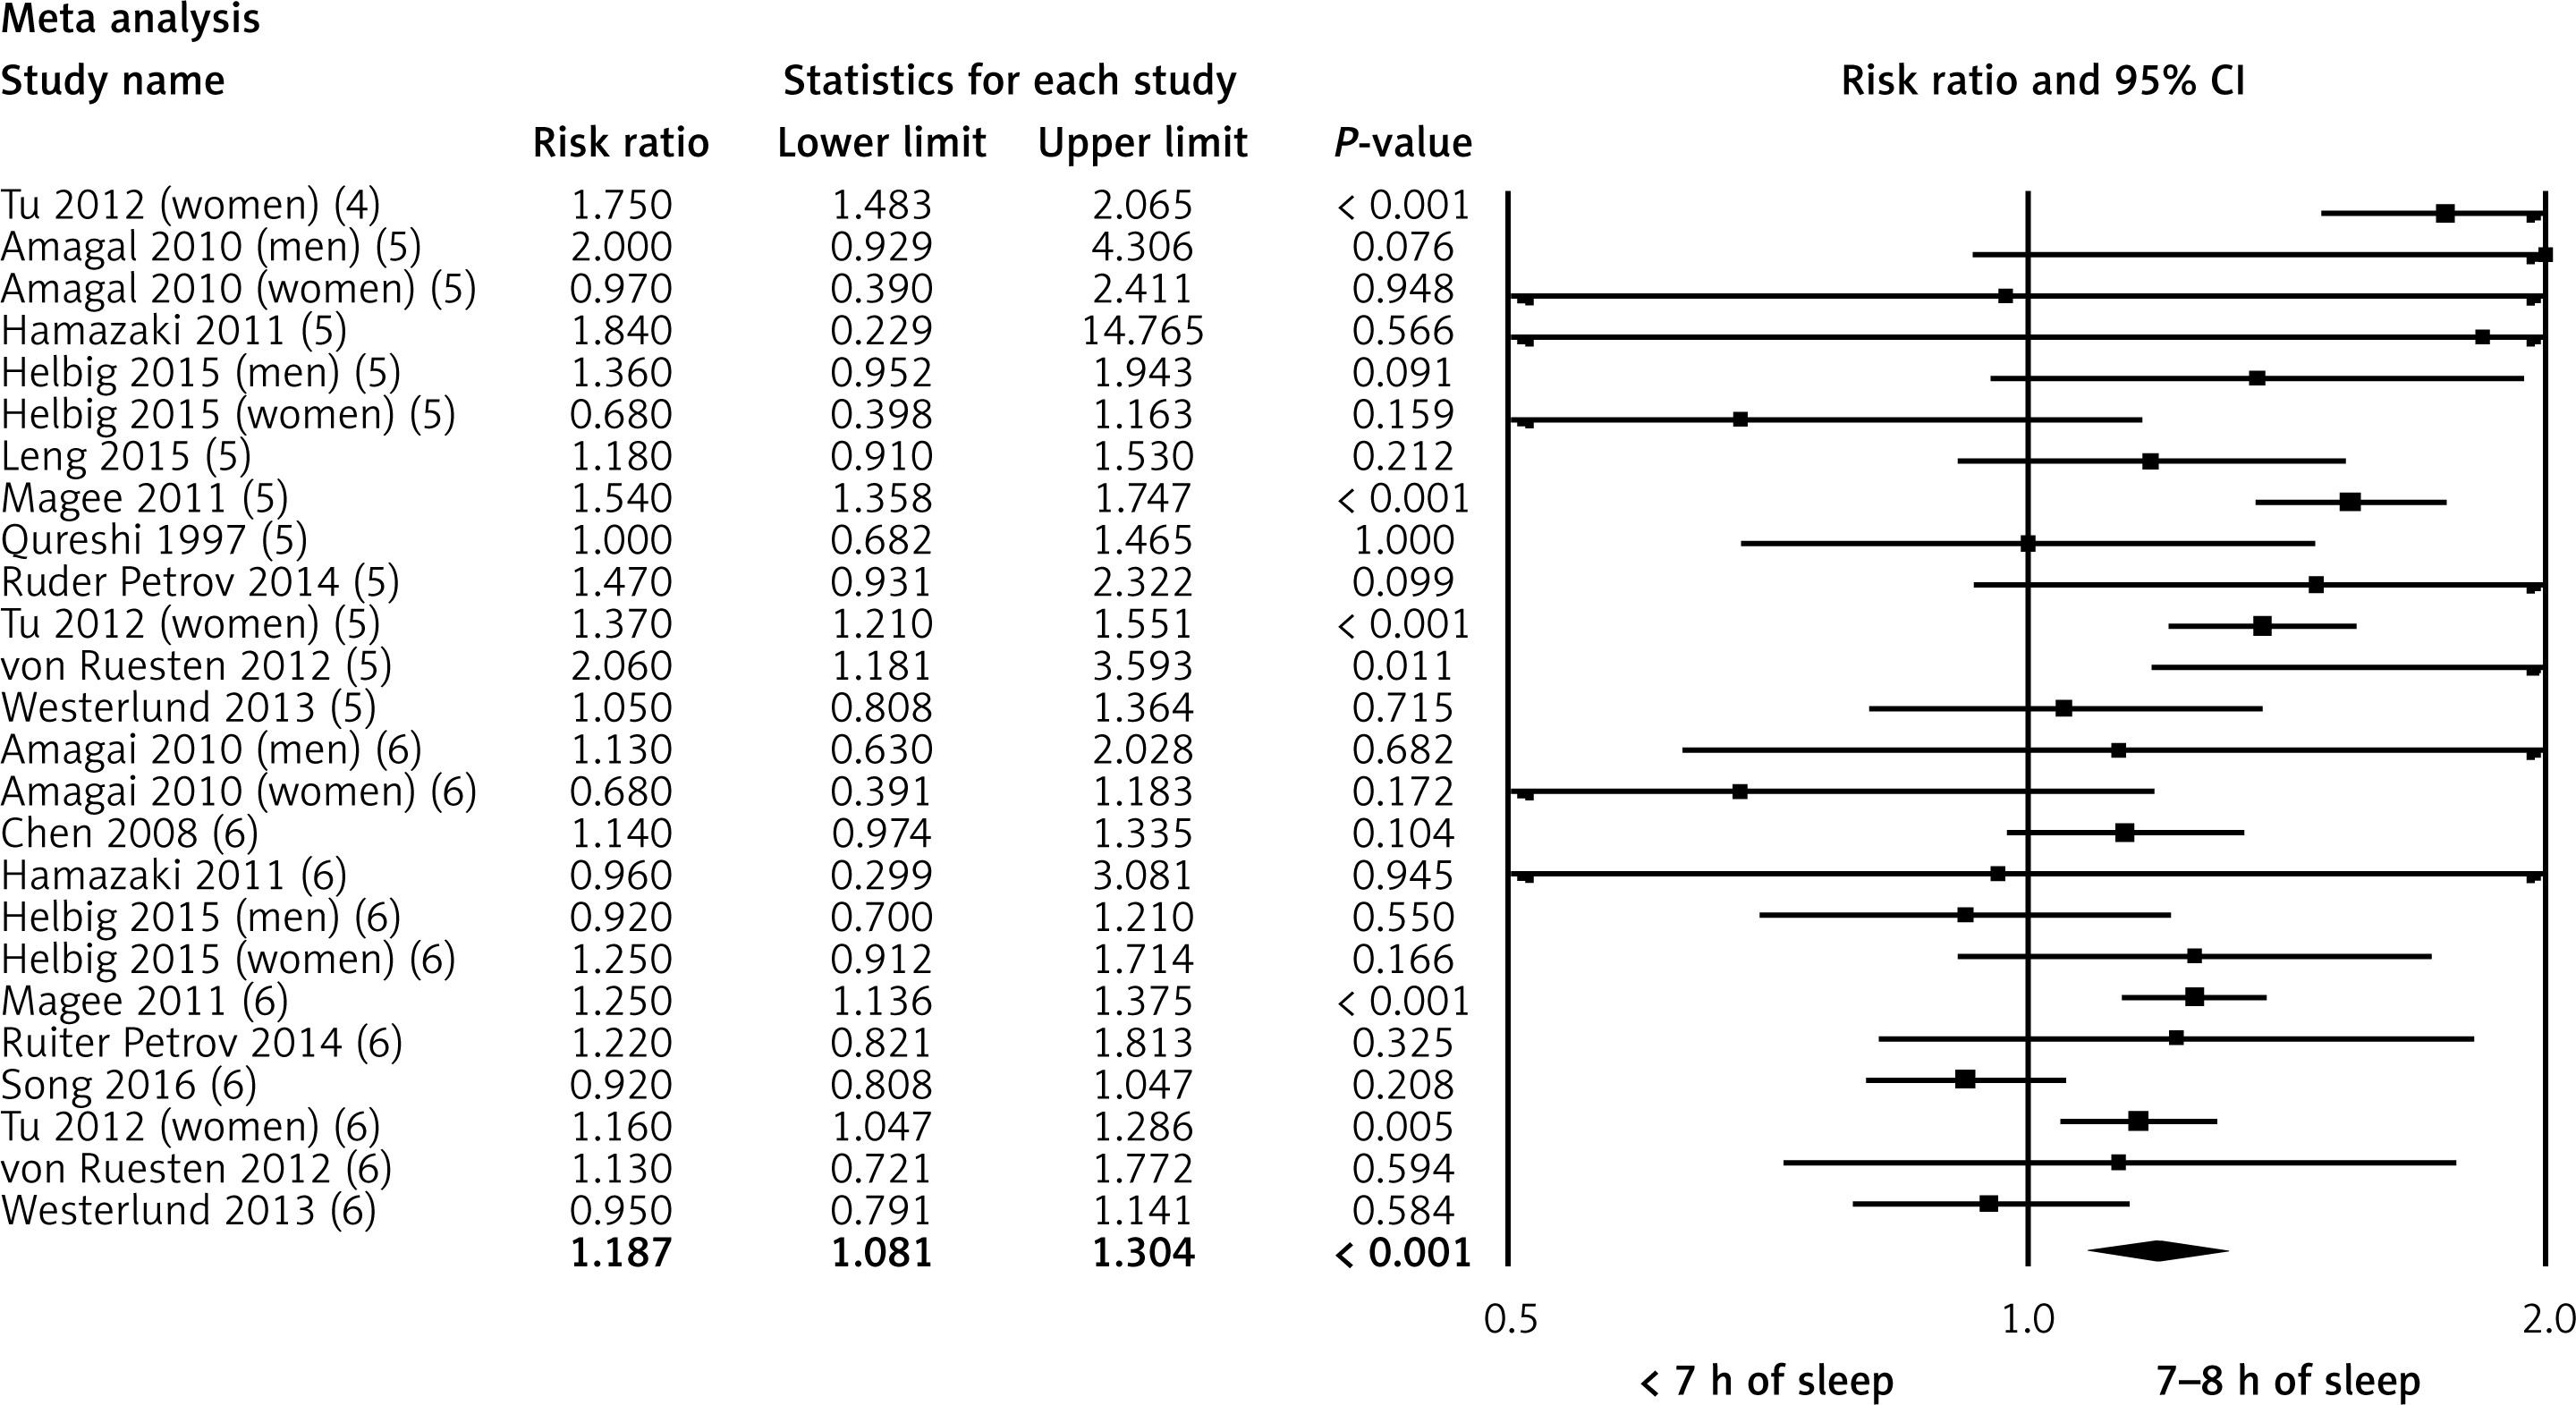
Figure 3
Forest plot of stroke risk associated with < 5 h of sleep compared to 7–8 h of sleep from 13 studies. Results are expressed as risk ratios and 95% confidence intervals. Pooled analysis: p < 0.001; heterogeneity test: I 2 = 58.4, p < 0.001. The area of each block is proportional to the weight attributed to each study
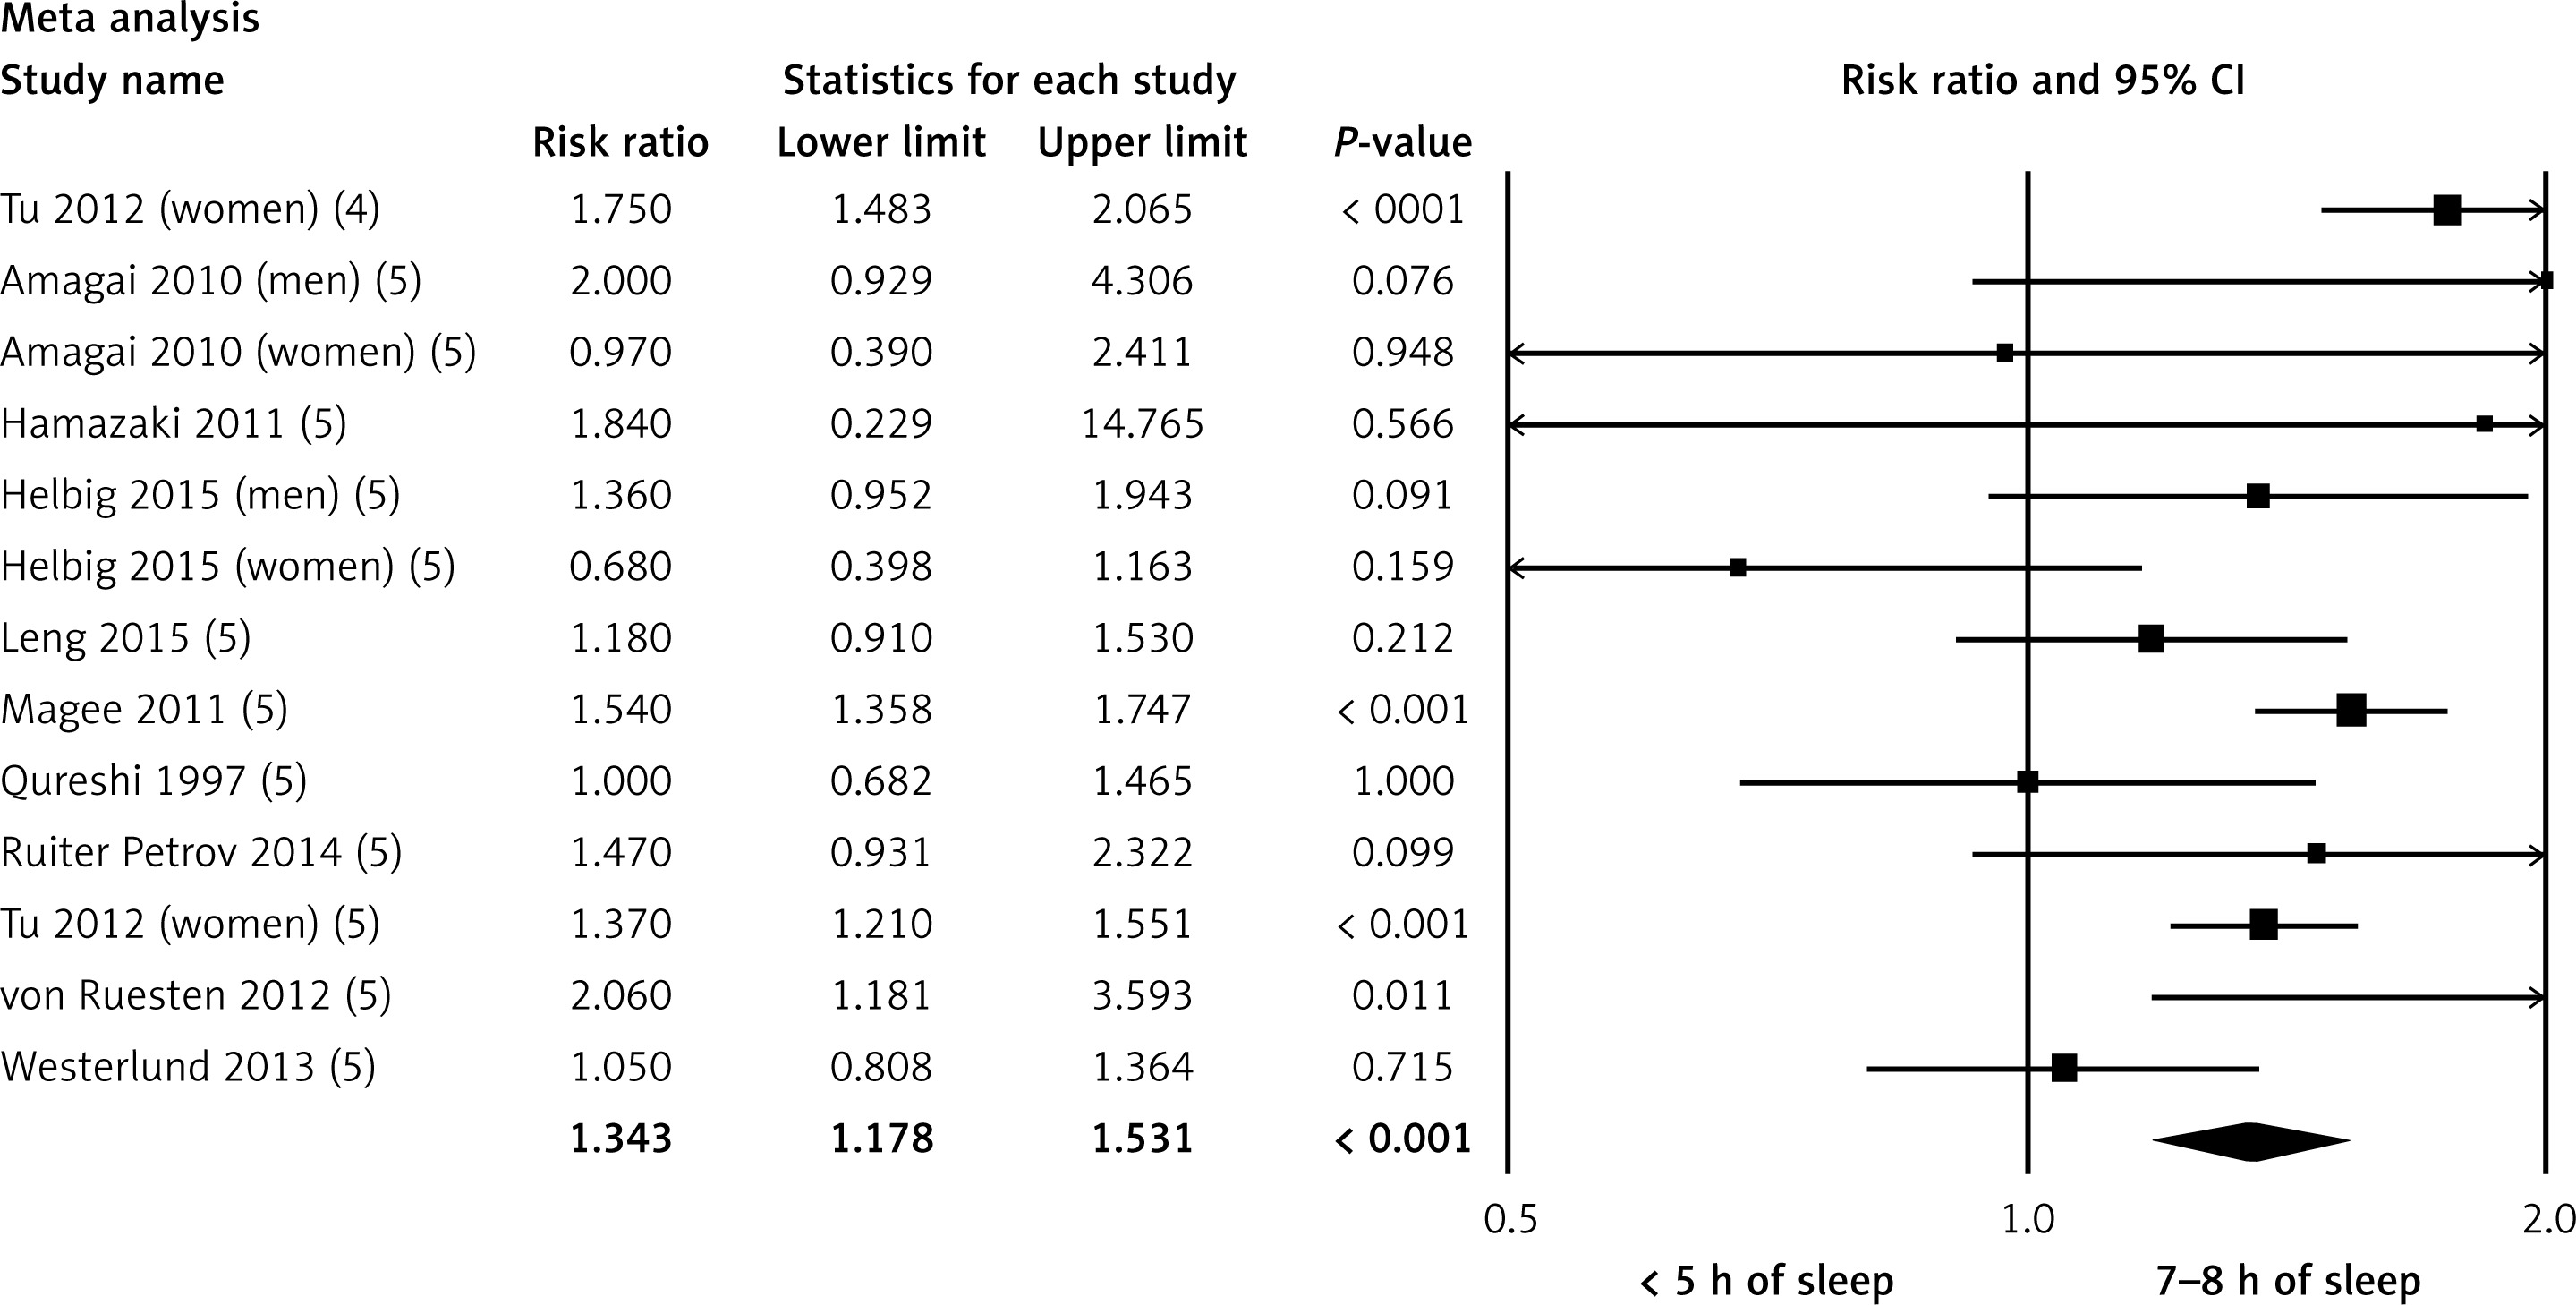
Figure 4
Forest plot of stroke risk associated with 6 h of sleep compared to 7–8 h of sleep from 12 studies. Results are expressed as risk ratios and 95% confidence intervals. Pooled analysis: p = 0.110; heterogeneity test: I 2 = 52.6, p = 0.016. The area of each block is proportional to the weight attributed to each study
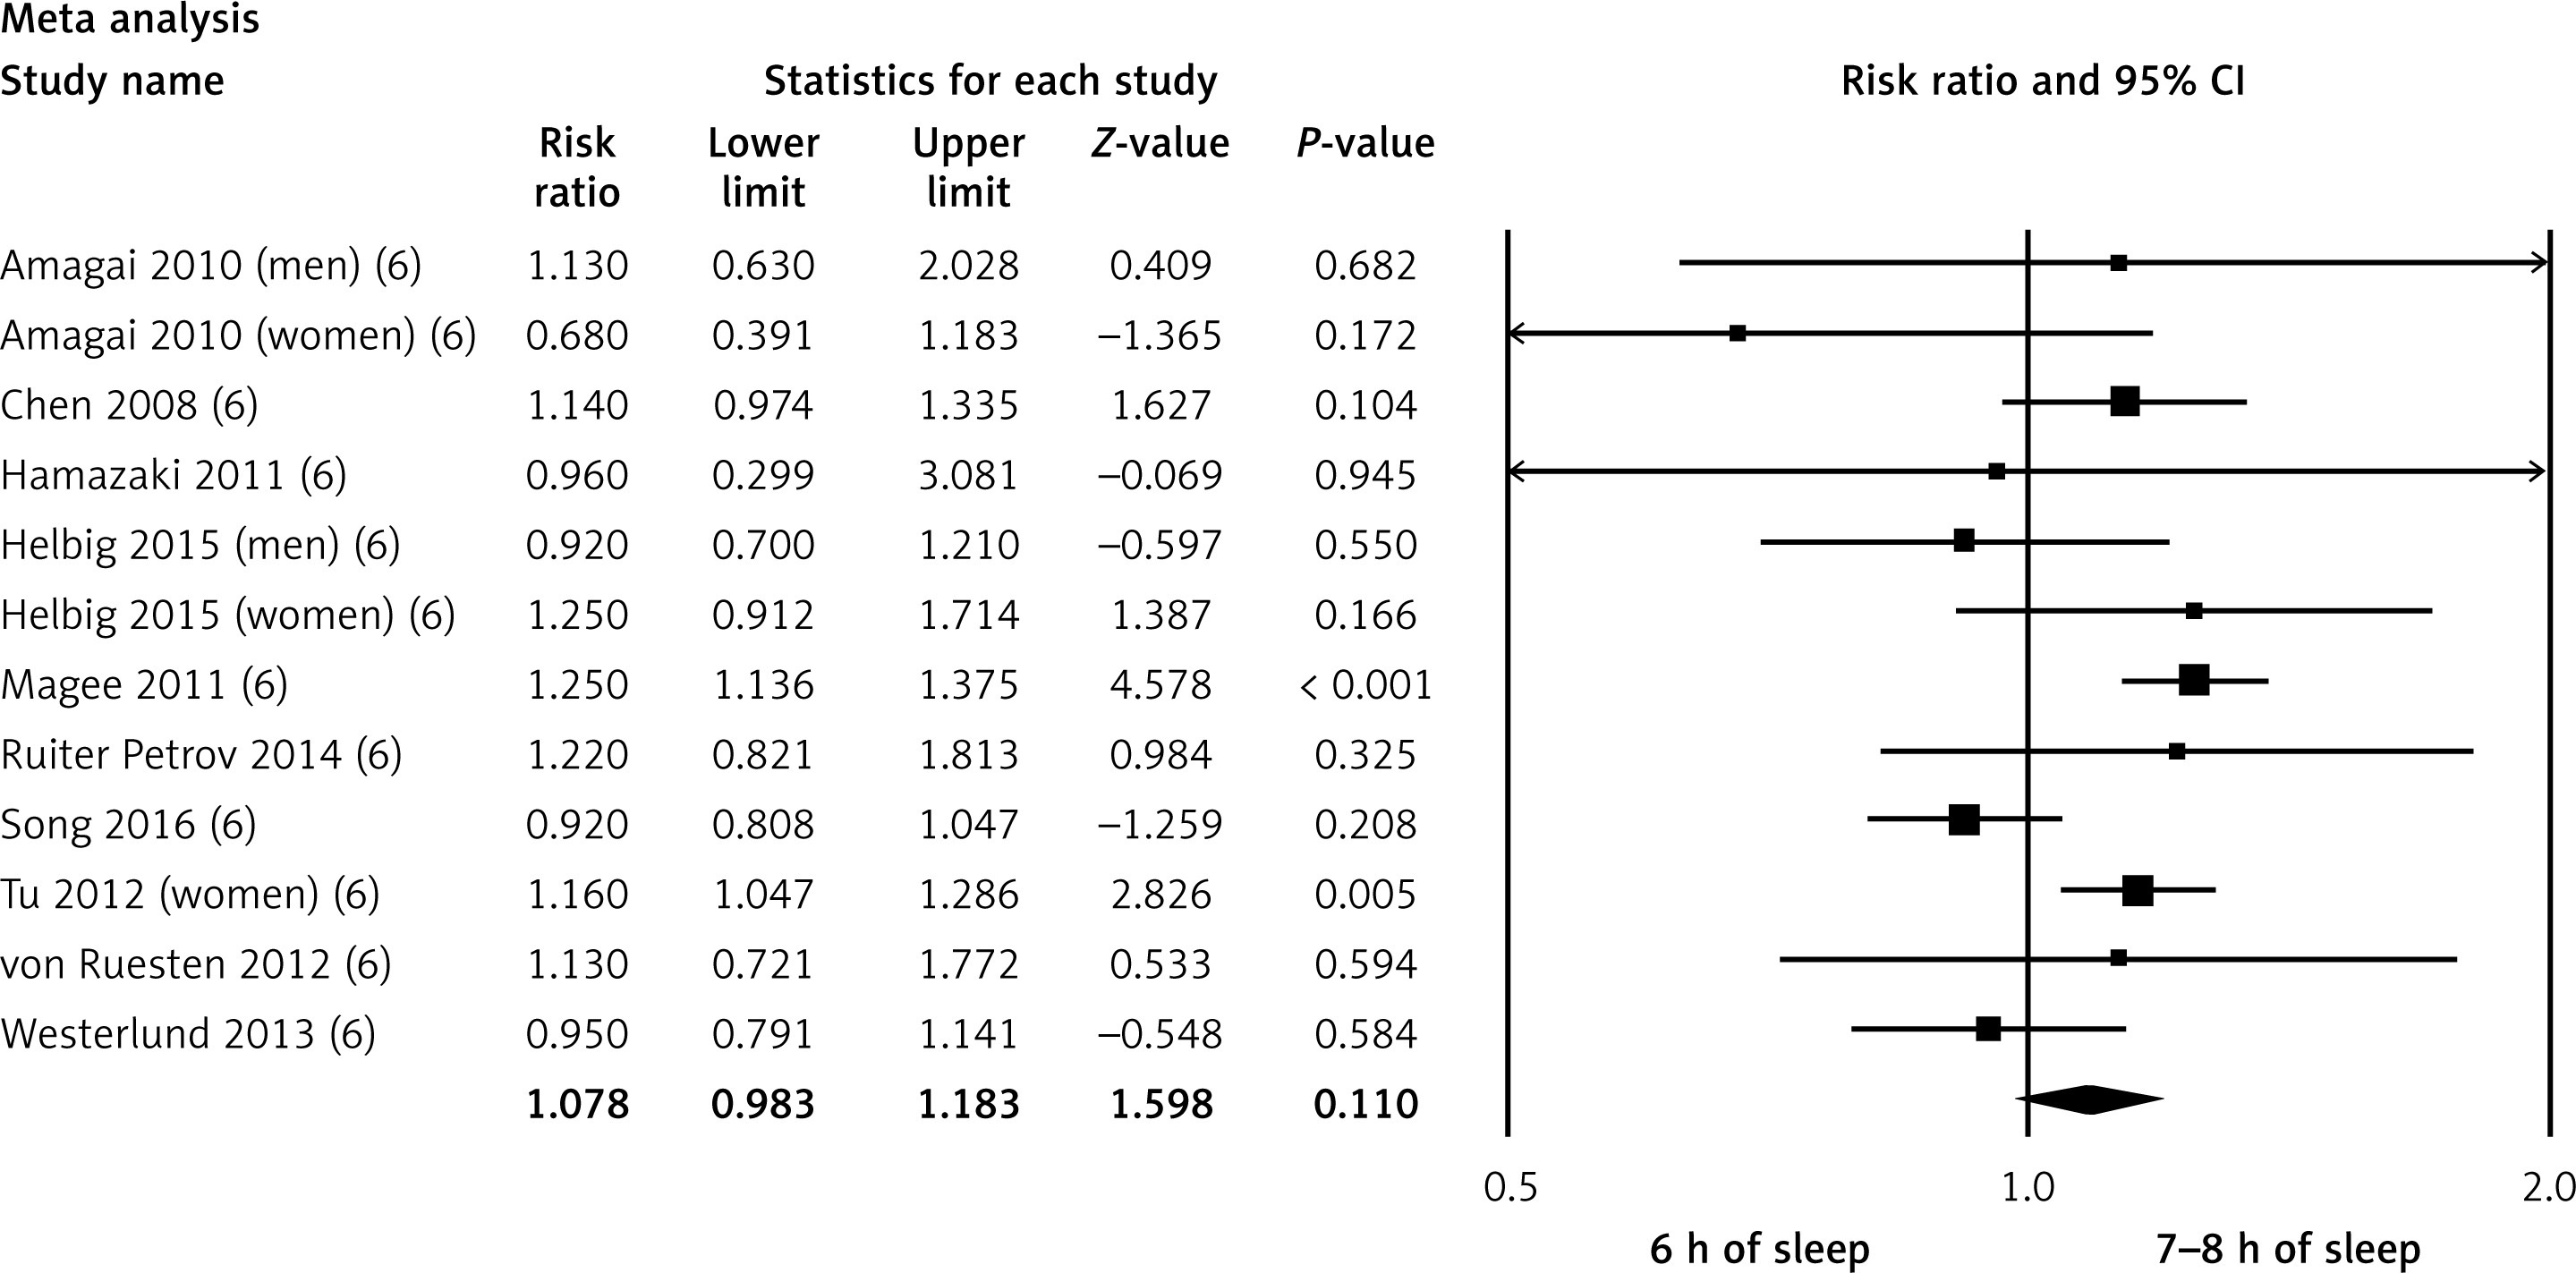
Figure 5
Forest plot of stroke risk associated with > 8 h sleep compared to 7–8 h of sleep from 16 studies. Results are expressed as risk ratios and 95% confidence intervals. Pooled analysis: p < 0.001; heterogeneity test: I 2 = 53.6, p < 0.001. The area of each block is proportional to the weight attributed to each study
Compared with the reference group, > 9 h of sleep was also significantly associated with increased stroke risk (RR = 1.35, 95% CI: 1.22–1.50, p < 0.001, n = 13 studies, I2 = 41.5, p = 0.043), whereas 10 h of sleep was not associated with stroke risk (RR = 1.40, 95% CI: 0.95–2.07, p = 0.082, n = 3 studies, I2 = 75.7, p = 0.016). It should be noted that in all the above comparisons, there was high heterogeneity between the studies.
Sensitivity analysis
In the leave-one-out sensitivity analyses, the pooled effect estimates remained similar for the effect of both shorter and longer (in comparison with the reference group) sleep duration (RR = 1.18, 95% CI: 1.08–1.30, and 1.38, 95% CI: 1.24–1.53, respectively). This confirms that the significant difference between the studied groups is the overall effect of all included studies.
Publication bias
Egger’s linear regression also supported the absence of any publication bias (intercept = 2.33, 95% CI = 1.77, –5.22, p = 0.450). Furthermore, Begg’s rank correlation test (Kendall’s tau with continuity correction = 0.412, z = 0.832, p = 0.452) was not indicative of publication bias.
Mendelian randomization
The list of all instrument-exposure associations for sleep duration (subjectively and objectively assessed) is shown in Supplementary Table SIV. The results, expressed as beta coefficients for sleep duration per one standard deviation (SD) increase in outcomes (i.e. stroke risk), are presented in Tables II–V. Self-reported sleep duration had no significant effect on the risk of IS (IVW: beta = –0.031, p = 0.747), CES (IVW: beta = –0.039, p = 0.849), LAS (IVW: beta = –0.246, p = 0.328) or SVS (IVW: beta = –0.102, p = 0.667) (Table II). The same pattern was observed for the accelerometer recorded sleep duration (for IS IVW: beta = 0.033, p = 0.739; for CES IVW: beta = –0.072, p = 0.713; for LAS IVW: beta = 0.109, p = 0.664 and for SVS IVW: beta = 0.367, p = 0.149) (Table III).
Table II
Results of Mendelian randomization analysis of associations between self-reported sleep duration and different types of stroke
Table III
Results of Mendelian randomization analysis of associations between accelerometer-derived sleep duration and different types of stroke
Table IV
Results of Mendelian Randomization analysis of associations between short sleep duration and different types of stroke
Table V
Results of Mendelian randomization analysis of associations between long sleep duration and different types of stroke
Short sleep duration also had no significant impact on the risk of different types of stroke (for IS IVW: beta = 0.343, p = 0.335, for CES IVW: beta = –0.384, p = 0.614, for LAS IVW: beta = 1.321, p = 0.156 and for SVS IVW: beta = –0.009, p = 0.990) (Table IV). Similar results were found for long sleep duration (for IS IVW: beta = –0.219, p = 0.805, for CES IVW: beta = 1.895, p = 0.279, for LAS IVW: beta = 2.126, p = 0.389 and for SVS IVW: beta = 1.369, p = 0.508) (Table V).
None of the IVW estimates showed any heterogeneity (Tables II–V). MR-PRESSO analysis also indicated no evidence of outliers for any of the estimates. Furthermore, the pleiotropy test, with a negligible intercept and non-significant P-value, also indicated a low likelihood of pleiotropy for all estimations (all p > 0.539, Tables II–V). The results of the MR-RAPS were consistent with the IVW estimates in almost all cases, highlighting again a low likelihood of pleiotropy. The results of the leave-one-out method demonstrated that the observed associations were not driven by single SNPs.
Discussion
In the present study, we performed a comprehensive systematic review and meta-analysis of the available prospective cohort studies, and an MR analysis to evaluate the potential effects of sleep duration on the risk of stroke in a causal model. By pooling prospective studies, we showed that shorter and longer sleep duration may be considered significant risk factors for stroke. However, these results were subject to substantial heterogeneity, thus minimizing their validity, and highlighting the need for further, more reliable, statistical analyses. In this context, the MR analysis showed no association between sleep duration and the risk of different types of stroke, with low levels of heterogeneity and pleiotropy.
Sleep duration is generally not regarded as a traditional risk factor for CVD, but previous studies reported a negative association between short and long sleep duration with CVD morbidity [48] and CVD risk factors [49]. Indeed, sleep duration and circadian rhythm disorders, as well as insomnia, have been associated with stroke [49, 50], with approximately half of stroke survivors potentially having insomnia [50].
Growing evidence suggests that short and long sleep duration may be linked to adverse health outcomes, including total mortality [3, 4], CVD events [4, 15, 18, 51], diabetes [52] and hypertension [7, 8]. The exact underlying mechanisms of a potential association between sleep duration and CVD have not been established yet. In this context, short sleep duration may increase leptin and ghrelin levels [53], leading to increased appetite and caloric intake and reduced energy expenditure, both of which may contribute to the development of obesity [54]. Increased cortisol secretion and changes in growth hormone metabolism have also been reported in relation to short sleep duration [55], as well as low-grade inflammation, which can predispose to CVD [55, 56]. Furthermore, epidemiological studies have shown that short sleep duration may be related to higher levels of haemoglobin A1C [56], total cholesterol, triglycerides and blood pressure [57], which are all CVD risk factors. Sleep disorders have also been suggested to affect the outcomes of CVD events [58–60].
Depressive symptoms, low socio-economic status, unemployment and low levels of physical activity have been linked to long sleep duration and may confound the relationship of sleep duration with morbidity and mortality [61, 62]. In this context, the observed harmful effects of longer sleep were confounded by depression or socioeconomic status [63].
One previous meta-analysis (n = 74 studies; 3,340,684 participants) reported no significant differences in stroke events in relation to self-reported sleep duration shorter or longer than 7 h, whereas a moderate increase in stroke mortality was observed in those sleeping ≥ 7 h [2]. A study in 2,282 males healthy aged 35–54 years found no significant association between any sleep duration and stroke risk during 14 years of follow-up, after adjustment for potential confounders, including traditional CVD risk factors and working status [20]. In contrast, another systemic review and meta-analysis of 15 prospective studies (n = 474,684 male and female individuals; follow-up 6.9–25 years) reported that both short and long sleep duration were significantly related to a greater risk of stroke [12].
Ikehara et al. performed a study which included 98,643 individuals (41,489 men and 57,145 women) aged 40 to 79 years and found that long sleep duration (≥ 10 h) was associated with a 1.5- to 2-fold increased mortality from total and ischemic stroke compared with 7 h of sleep [18]. In a 10-year follow-up of the NHANES cohort (n = 7844; aged ≥ 32 years), long (> 8 h) sleep duration was associated with a higher risk of stroke compared with the reference group (6 to 8 h of sleep) [16]. In another meta-analysis of 16 prospective studies, the lowest stroke risk was observed in those sleeping 7 h per night; of note, in cases of > 7 h sleep, total stroke risk was increased by 13% for every 1 h increase in sleep duration [63]. Furthermore, the Women’s Health Initiative Observational Study reported that long sleep duration was significantly associated with ischemic stroke among postmenopausal women [19]. In motor-impaired, right hemisphere stroke patients, sleep latencies were longer and sleep efficiency was worse in comparison to age-and sex-matched controls [64]. Furthermore, in a Taiwan administrative data study which included 21,438 participants with insomnia and 64,314 age- and sex-matched participants without insomnia, those with insomnia had a 54% increased risk of stroke [65].
The present findings should be extrapolated with caution, since our analysis has some limitations. In this context, we were unable to thoroughly evaluate individual-level confounding factors. Although we used different methods in our MR analysis, the possibility of horizontal pleiotropy cannot be excluded. Furthermore, a high level of heterogeneity was observed. Despite this, the present analysis has strengths, including the fact that the MR analysis reduced the risk of potential reverse causation, and genotypes were assumed to be randomly distributed with respect to confounders.
In conclusion, pooled data from prospective cohort studies showed that sleep duration may increase the risk of stroke, but the high level of heterogeneity observed between studies significantly minimizes the validity of these findings. Furthermore, the MR analysis revealed no associations between sleep duration and the risk of different ischemic stroke types, with a low level of heterogeneity and pleiotropy.