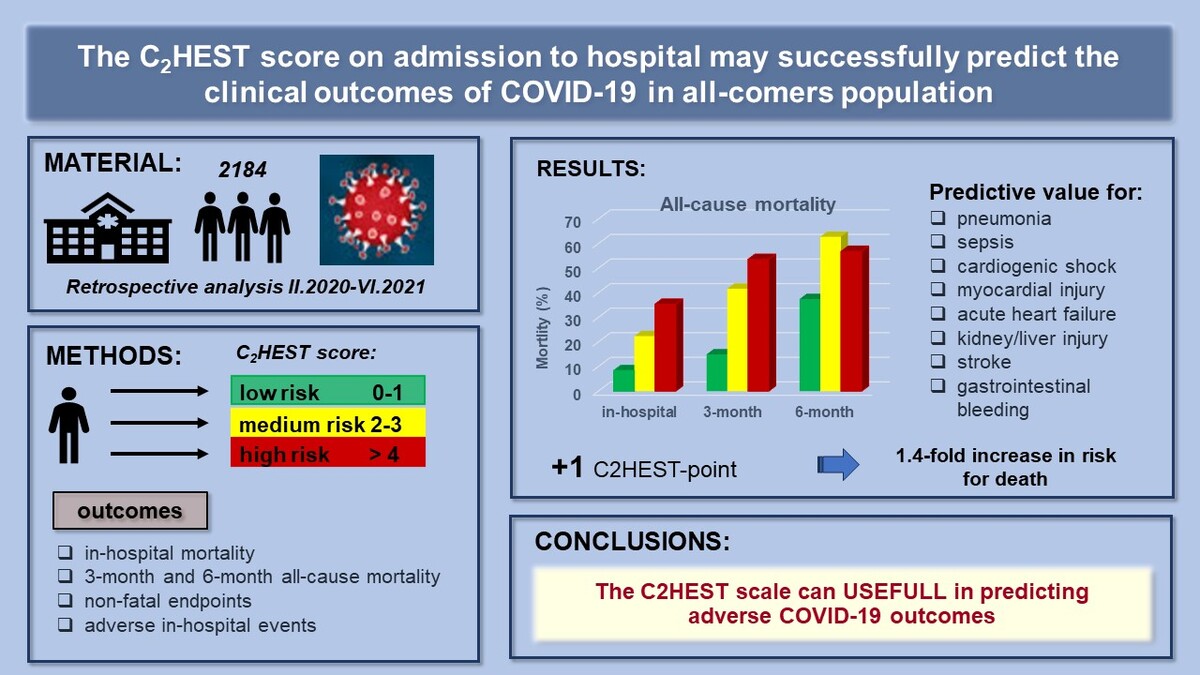
Introduction
Since the beginning of the SARS-CoV-2 pandemic, intensive efforts have been made to identify predictors of the COVID-19 clinical course [1, 2]. Numerous triage tools, including risk scores, could support decision-making by combining clinical assessment data to predict the risk of adverse outcomes. Early identification of COVID-19 patients at high risk of developing critical illness is of paramount importance, as it can inform appropriate management and optimize resource allocation. The initially published studies were designed to assist in making appropriate medical decisions; nevertheless, the first prognostic models were characterized by a relatively high risk of bias. Additionally, these models relied on an extensive set of clinical data, including laboratory parameters, physical examination findings, and imaging diagnostics. Consequently, their implementation in the dynamic settings of COVID-19(+) wards was rendered impractical due to their unwieldy complexity.
As far as the literature is concerned, the risk factors for severe COVID-19 or mortality have been demonstrated to include age, smoking, presence of comorbidities, such as heart failure, right ventricular dysfunction, pulmonary hypertension, chronic obstructive pulmonary disease (COPD), and diabetes [3, 4]. Despite the identification of numerous risk factors for disease progression, the clinical course of infection in individual patients remains uncertain. COVID-19 commonly manifests with inflammatory changes in the lungs, but a broad spectrum of organ complications, including cardiovascular events, appears to be caused by a “cytokine storm” [5, 6]. Elevated rates of thromboembolic events, myocardial injury (MI) and acute coronary syndromes (ACS), acute heart failure (HF), acute kidney injury (AKI), and acute liver dysfunction (ALD), and blood pressure fluctuations further complicate the in-hospital course of COVID-19 [7, 8].
Several years ago, a simple clinical score, C2HEST (C2: CAD (coronary artery disease)/COPD; H: hypertension; E: elderly [age ≥ 75]; S: systolic HF; T: thyroid disease) was introduced to predict incident atrial fibrillation (AF) with reasonably good discrimination and internal calibration. The C2HEST score algorithm found utility in cardiovascular medicine for risk stratification and, to some extent, outcome prediction. Associations between components of the C2HEST score and adverse outcomes have previously been established, particularly in subjects with heart failure with preserved ejection fraction (HFpEF) [9]. Nevertheless, the role of this score in predicting COVID-19 outcomes, encompassing both fatal and non-fatal events, has remained unexplored. Given that individual components of the C2HEST score reflect comorbidities, we assumed that C2HEST might hold promising predictive value for adverse clinical outcomes in COVID-19. Liang et al. were the first to demonstrate that the number of comorbidities predicted critical illness in hospitalized patients [10], which prompted us to investigate the predictive potential of the C2HEST score within the COVID-19 cohort.
Consequently, this study conducted a post-hoc analysis of the hospitalized COVID-19 patients as part of the COronavirus in LOwer Silesia (COLOS) study to assess the prognostic efficacy of the C2HEST score in predicting the outcomes, including mortality and non-fatal clinical events during hospitalization.
Material and methods
Study design and participants
We analyzed the medical records of individuals admitted to a medical university center for COVID-19 between February 2020 and June 2021. The study protocol for the COLOS study received approval from the Institutional Review Board and Ethics Committee at Wroclaw Medical University, Wroclaw, Poland (No: KB-444/2021). As the data collection was retrospective, written informed consent was not required.
All patients were admitted with COVID-19 symptoms and a positive SARS-CoV-2 test result, following the testing protocol outlined by the WHO (World Health Organization). Nasopharyngeal swab specimens were obtained from all patients, and the presence of SARS-CoV-2 RNA was determined by strictly adhering to the manufacturer’s instructions.
The analyzed data included demographic and clinical characteristics, respiratory support, smoking status, comorbidities, home medication, laboratory results, and the course of hospitalization. Adverse clinical events such as shock, pulmonary embolism (PE), deep vein thrombosis (DVT), MI, myocardial injury, acute HF, stroke/TIA, pneumonia, complete respiratory failure (RF), SIRS, sepsis, AKI, ALD, MODS, and bleeding were also recorded.
Follow-up and outcomes
Commencing on the day of hospital admission and concluding on the day of discharge or demise, the follow-up period encompassed the entire duration of hospitalization. After the initial analysis, additional information regarding patient deaths was obtained on the 90th and 180th days following the day of admission. Patient characteristics were derived from individual clinical records.
The evaluated outcomes included: in-hospital mortality, 3-month and 6-month all-cause mortality, and cessation of hospitalization not resulting from death (such as discharge to home, emergency transfer to another center due to deterioration, or transfer for rehabilitation). As secondary outcomes, the requirement for mechanical ventilation support, MI, shock, acute HF, PE, stroke, AKI, ALD, pneumonia, sepsis, SIRS, MODS, and incidence of bleeding were analyzed.
C2HEST score stratification
A cohort of 2184 subjects was included, and baseline patient characteristics were extracted from the dataset to compute the C2HEST score, consisting of six individual components: CAD (1 point), COPD (1 point), hypertension (1 point), elderly status (age ≥ 75 years, 2 points), systolic HF (2 points), and thyroid disease (1 point). It is essential to highlight that the criterion for CAD was satisfied by a positive history of MI or coronary revascularization (scored as 1 point). Furthermore, in subsequent sensitivity analyses, the term “thyroid disease” was more precisely defined as “hyperthyroidism” and “hypothyroidism”. Subsequently, subjects were stratified into one of three primary risk categories: low risk (0–1 points), medium risk (2–3 points), and high risk (≥ 4 points).
Statistical analysis
Descriptive data are presented as numbers with percentages for categorical variables, while numerical variables are expressed as the mean with standard deviation, range (minimum to maximum), and the count of non-missing values. An omnibus test was employed for categorical variables with more than 5 expected cases in each group, and the Fisher exact test was used for cases with fewer cell counts. Welch’s ANOVA was conducted for continuous variables due to unequal variances between risk strata, with the sample size considered large enough for the appropriateness of asymptotic results. Post-hoc analysis for continuous variables utilized the Games-Howell test with Tukey correction, and for categorical variables, the post-hoc test mirrored the omnibus test, but was performed in subgroups including the Bonferroni correction.
In-hospital mortality and all-cause mortality were treated as right-censored data, leading to a time-dependent ROC analysis with inverse probability of censoring weighting (IPCW) estimation for these variables. The C2HEST score was evaluated through the time-dependent area under the curve (AUC), and survival curve differences between risk strata were confirmed using the log-rank test. The proportional hazard assumption was assessed with the Grambsch-Therneau test. A Cox proportional hazard model was employed to analyze the hazard ratio (HR) for the C2HEST score, its components, and risk strata.
For secondary outcomes, a logistic regression model was employed due to their dichotomic nature. Classical ROC analysis was performed, and the AUC measure was used to evaluate predictive capabilities. The odds ratio (OR) served as the effect size for the influence of the C2HEST score, its components, and risk strata.
All statistical analyses were conducted using R version 4.0.4 with the packages time-ROC, pROC [11], survival [12], coin [13], and odds ratio [14]. A significance level of 0.05 was chosen for all statistical analyses.
Results
Baseline characteristics of the studied population and comorbidities
Subjects within the low-risk C2HEST stratum exhibited the youngest age, the lowest prevalence of cigarette smoking, and a lower burden of comorbidities. Notably, the prevalence of asthma did not exhibit significant differences between groups (Table I and Supplementary Table SI).
Table I
Baseline characteristics of the C2HEST risk-stratified study cohort
| Variables, units (N) | Low risk [0–1] | Medium risk [2–3] | High risk [> 4] | Omnibus p-value | P-value (for post-hoc analysis) |
|---|---|---|---|---|---|
| Mean ± SD Min.–max. (N) or n/N (% of risk category) | Mean ± SD Min.–max. (N) or n/N (% of risk category) | Mean ± SD Min.–max. (N) or n/N (% of risk category) | |||
| Demographics | |||||
| Age [years] (2184) | 51.1 ±15.9 17–74 (1418) | 75.6 ±11.7 29–100 (492) | 78.6 ±9.4 38–100 (274) | < 0.0001 | < 0.0001a, b 0.0003c |
| ≥ 65 years (2184) | 376/1418 (26.5%) | 419/492 (85.2%) | 252/274 (92%) | < 0.0001 | < 0.0001a, b 0.0259c |
| Male sex (2184) | 735/1418 (51.8%) | 208/492 (42.3%) | 139/274 (50.7%) | 0.0012 | 0.00095a, 1.0b, 0.088 c |
| BMI [kg/m2] (554) | 28.3 ±5.1 15.4–49.4 (397) | 29.3 ±5.6 18.6–47.8 (90) | 27.8 ±5.8 16.4–48.2 (67) | 0.210 | N/A |
| BMI < 18.5 kg/m2 (554) | 3/397 (0.8%) | 0/90 (0.0%) | 2/67 (3.0%) | 0.1882 | N/A |
| BMI ≥ 30 kg/m2 (554) | 132/397 (33.2%) | 38/90 (42.2%) | 21/67 (31.3%) | 0.1882 | N/A |
| Smoking never/previous/current (2180) | (1338/1418 (94.4%) 46/1418 (3.2%) 34.1418 (2.4%) | 431/489 (88.1%) 35/489 (7.2%) 23/489 (4.7%) | 218/273 (79.9%) 36/273 (13.2%) 19/273 (7.0%) | < 0.0001 | < 0.0001a, b, 0.0216 c |
| Co-morbidities | |||||
| Hypertension (2184) | 416/1418 (29.3%) | 357/492 (72.6%) | 249/274 (90.9%) | < 0.0001 | < 0.0001a, b, c |
| DM (2182) | 209/1418 (14.7%) | 146/419 (29.7%) | 118/273 (43.2%) | < 0.0001 | < 0.0001a, b, c |
| Dyslipidemia (826) | 289/418 (69.1%) | 174/233 (74.7%) | 148/175 (84.6%) | < 0.0005 | 0.48a, 0.0005b, 0.064c |
| AFib/AFL (2184) | 49/1418 (3.5%) | 106/492 (21.5%) | 135/274 (49.3%) | < 0.0001 | < 0.0001a, b, c |
| Past coronary revascularization (2184) | 6/1418 (0.42%) | 37/492 (7.5%) | 111/274 (40.5%) | < 0.0001 | < 0.0001a, b, c |
| Past MI (2184) | 11/1418 (0.8%) | 63/492 (12.8%) | 117/274 (42.7%) | < 0.0001 | < 0.0001a, b, c |
| HF (2184) | 0/1418 (0%) | 53/492 (10.8%) | 202/274 (73.7%) | < 0.0001 | < 0.0001a, b, c |
| Moderate or severe VHD/valve surgery (2184) | 13/1418 (0.9%) | 32/492 (6.5%) | 51/274 (18.6%) | < 0.0001 | < 0.0001a, b, c |
| PAD (2184) | 26/1418 (1.8%) | 31/492 (6.3%) | 43/274 (15.7%) | < 0.0001 | < 0.0001a, b, c |
| Past stroke/TIA (2184) | 47/1418 (3.3%) | 59/492 (12.0%) | 58/274 (21.2%) | < 0.0001 | < 0.0001a, b, 0.00312c |
| CKD (2184) | 70 /1418 (4.9%) | 70/492 (14.2%) | 91/274 (33.2%) | < 0.0001 | < 0.0001a, b, c |
| Hemodialysis (2184) | 19/1418 (1.3%) | 20/492 (4.1%) | 19/274 (7.0%) | < 0.0001 | < 0.0001a, b, 0.356 c |
| Asthma (2184) | 54/1418 (3.8%) | 20/492 (4.1%) | 11/274 (4.0%) | 0.962 | N/A |
| COPD (2184) | 6/1418 (0.4%) | 25/492 (5.1%) | 44/274 (16.1%) | < 0.0001 | < 0.0001a, b, c |
| Hypothyroidism (2184) | 76/1418 (5.4%) | 68/492 (13.8%) | 64/274 (23.4%) | < 0.0001 | < 0.0001a, b, 0.0035c |
| Hyper-thyroidism (2184) | 4/1418 (0.3%) | 10/492 (2.0%) | 7/274 (2.6%) | < 0.0001 | 0.0013a, 0.0015b, < 0.0001c |
Continuous variables are presented as mean ± SD, range (minimum–maximum), and number of non-missing values. Categorized variables are presented as a percentage. Information about the numbers with valid values can be found in the left column. N – valid measurements, n – number of patients, SD – standard deviation, BMI – body mass index, DM – diabetes mellitus, AF/AFL – atrial fibrillation/flutter, MI – myocardial infarction, HF – heart failure, PAD – peripheral artery disease, TIA – transient ischemic attack, CKD – chronic kidney disease, COPD – chronic obstructive pulmonary disease, VHD – valvular heart disease, N/A – not-applicable,
Upon admission, individuals in the low-risk stratum presented higher prevalence of cough and smell dysfunction. In contrast, those in the high-risk C2HEST stratum reported more frequent dyspnea. Furthermore, the high-risk stratum was further characterized by the highest pulse pressure and the lowest SpO2 (blood oxygen saturation) on room air without respiratory support. Physical examination findings in the high-risk group included more frequent pulmonary obturation as well as congestion and higher VES-13 score values (Supplementary Table SII).
Characteristics of in-hospital laboratory tests and treatment applied
Laboratory assays
Consistently, the high-risk C2HEST group exhibited the lowest hemoglobin and platelet counts throughout the whole observation period. Upon discharge, individuals in the high-risk stratum more commonly revealed lymphopenia and elevated neutrophil and leucocyte counts. Notably, in the low-risk C2HEST stratum, the CRP level decreased, whereas it increased in the high-risk group. Interestingly, no significant differences between the groups in IL-6 and ESR levels, both at baseline and discharge, were noted. Individuals in the higher-risk strata had higher D-dimer concentrations, a lower prothrombin rate, and a higher INR both on admission and discharge. Furthermore, baseline ferritin levels were lowest in the high-risk group on admission but increased at discharge, showing a rising trend unique to this stratum. Parameters of kidney function, including urea, creatinine, and eGFR, remained significantly worse in the high-risk C2HEST stratum throughout the hospitalization period, and total protein and albumin levels remained the lowest in this group. Troponin T and NT-proBNP levels were higher in the high-risk stratum throughout the observation period, and acute myocardial injury was more common in this group. On admission, the high-risk group exhibited the lowest vitamin D levels, as well as the highest TSH and lowest fT3 concentrations (Supplementary Table SIII).
Specific treatment applied during the hospitalization period
No significant differences were observed in the use of systemic corticosteroids, remdesivir, tocilizumab, or convalescent plasma between the different C2HEST risk strata. A notable distinction lay in the higher frequency of specific antimicrobial treatments administered to subjects in the high-risk C2HEST stratum (Supplementary Table SIV).
Supportive treatment applied during hospitalization
The need for oxygen supplementation, including high-flow nasal cannula and invasive ventilation, increased with the C2HEST score. Conversely, oxygenation parameters during the evaluation for advanced respiratory support decreased. Moreover, the requirement for urgent coronary angiography and revascularization increased with the C2HEST score. The use of catecholamines was notably more common in the high-risk group. Interestingly, no significant differences were noted regarding the need for de novo hemodialysis (Supplementary Table SV).
Outcomes
C2HEST score results and mortality
Out of the studied cohort of 2184 subjects, a total of 598 (27.4%) deaths, including 326 in-hospital deaths (15%), were reported during the entire observation period. In-hospital mortality at the 3rd and 6th month following hospital admission was highest in the high-risk stratum and lowest in the low-risk stratum (Table II).
Table II
Total and in-hospital all-cause mortality in the C2HEST risk strata
| Variables, units (N) | Low risk [0–1] | Medium risk [2–3] | High risk [> 4] | Omnibusp-value | P-value (for post-hoc analysis) |
|---|---|---|---|---|---|
| Mean ± SD Min.–max. (N) or n/N (% of risk category) | Mean ± SD Min.–max. (N) or n/N(% of risk category) | Mean ± SD Min.–max. (N) or n/N(% of risk category) | |||
| All-cause mortality rate | |||||
| In-hospital (2184) | 119/1418 (8.4%) | 110/492 (22.4%) | 97/274 (35.4%) | < 0.0001 | < 0.0001a,b, 0.0004c |
| 3-month (2088) | 201/1343 (15%) | 198/475 (41.7%) | 147/270 (53.6%) | < 0.0001 | < 0.0001a,b, 0.0031c |
| 6-month (1117) | 214/571 (37.5%) | 208/331 (62.8%) | 156/215 (56.9%) | < 0.0001 | < 0.0001a,b, 0.0713c |
Discriminatory performance of the C2HEST score for total and in-hospital all-cause mortality
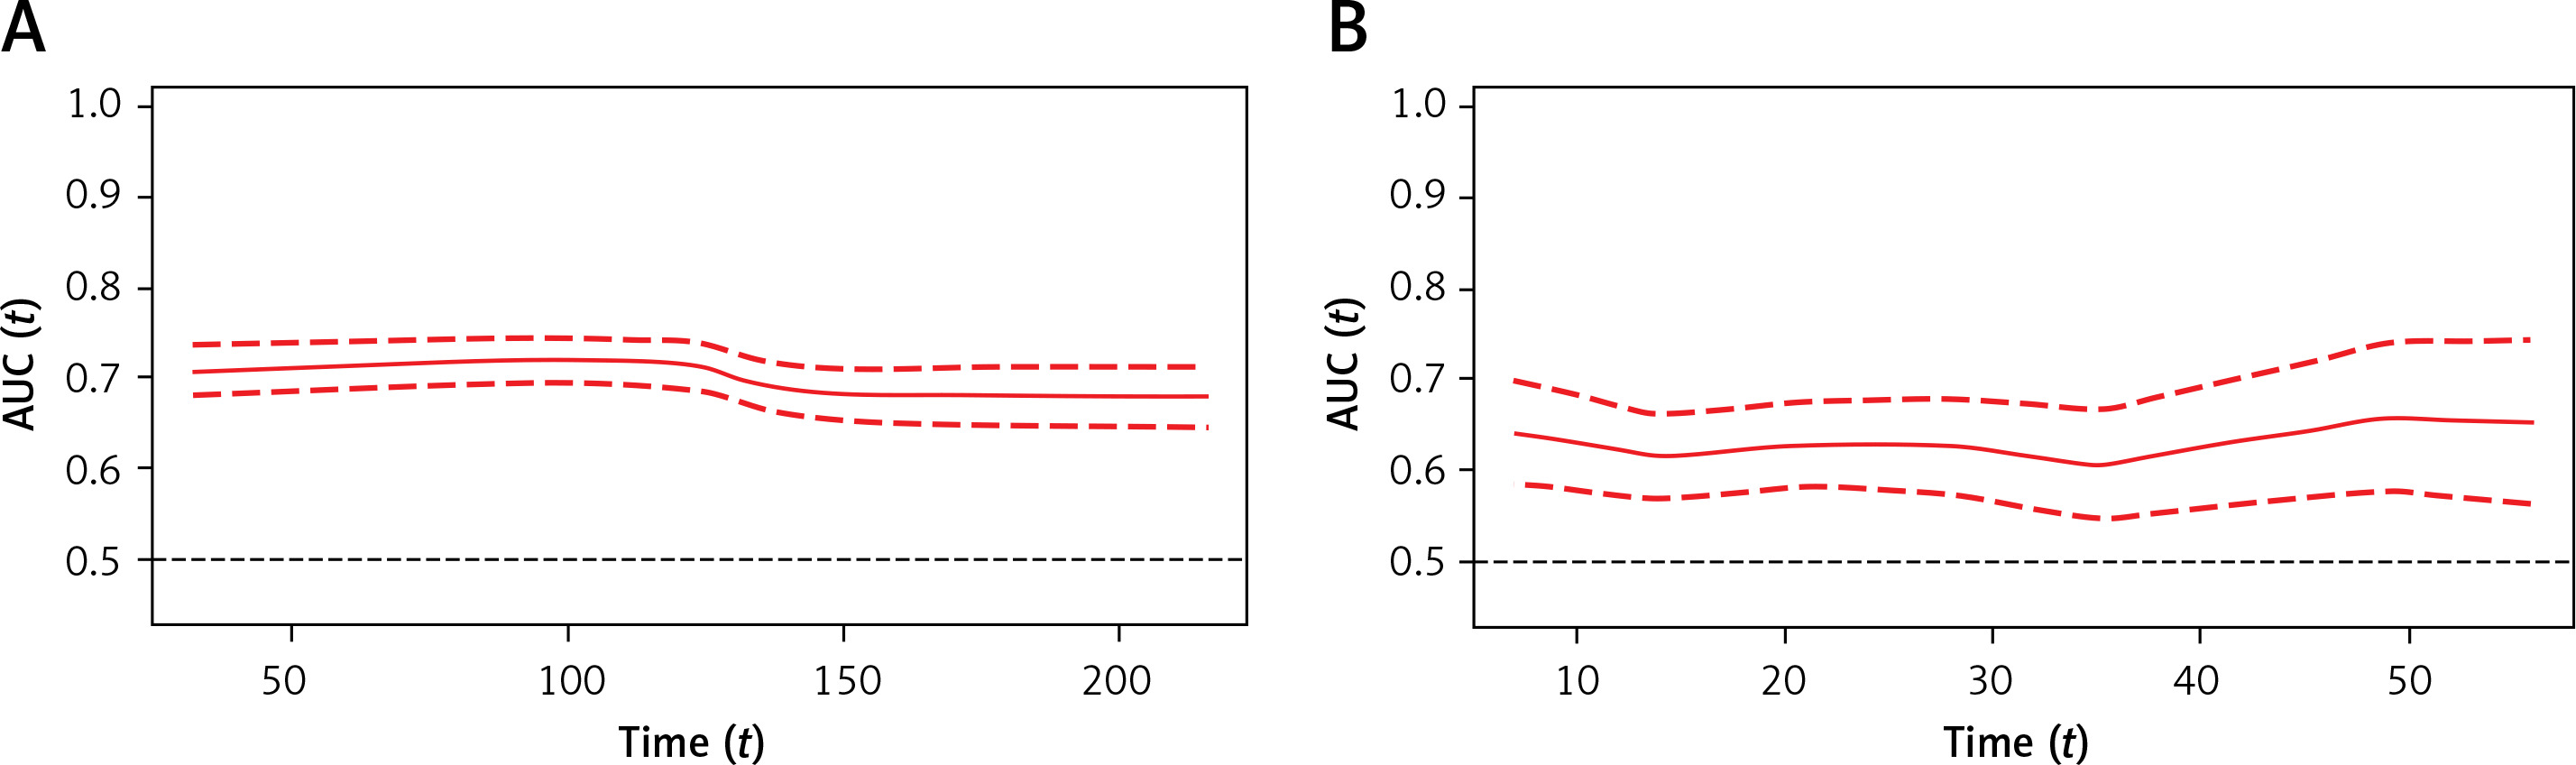
Time-dependent receiver operating characteristic (time-ROC) analysis demonstrated that the C2HEST score enabled the prediction of 1-month mortality with an AUC30 value of 70.7, maintaining a similar level for 3- and 6-month observations (AUC90 = 72.0 and AUC180 = 67, respectively) (Figure 1 A). The time-dependent AUC for predicting in-hospital deaths remained consistently above 60 throughout the whole hospitalization period, albeit lower than those calculated for total mortality (Figure 1 B). All the data were calculated for all-cause death without competing risk.
Figure 1
Time-dependent receiver operating characteristic (time-ROC) curves for the C2HEST score in predicting total (A) and in-hospital mortality (B) Time-dependent receiver operating characteristic (time-ROC) curves for the C2HEST score in predicting total (A) and in-hospital mortality (B)
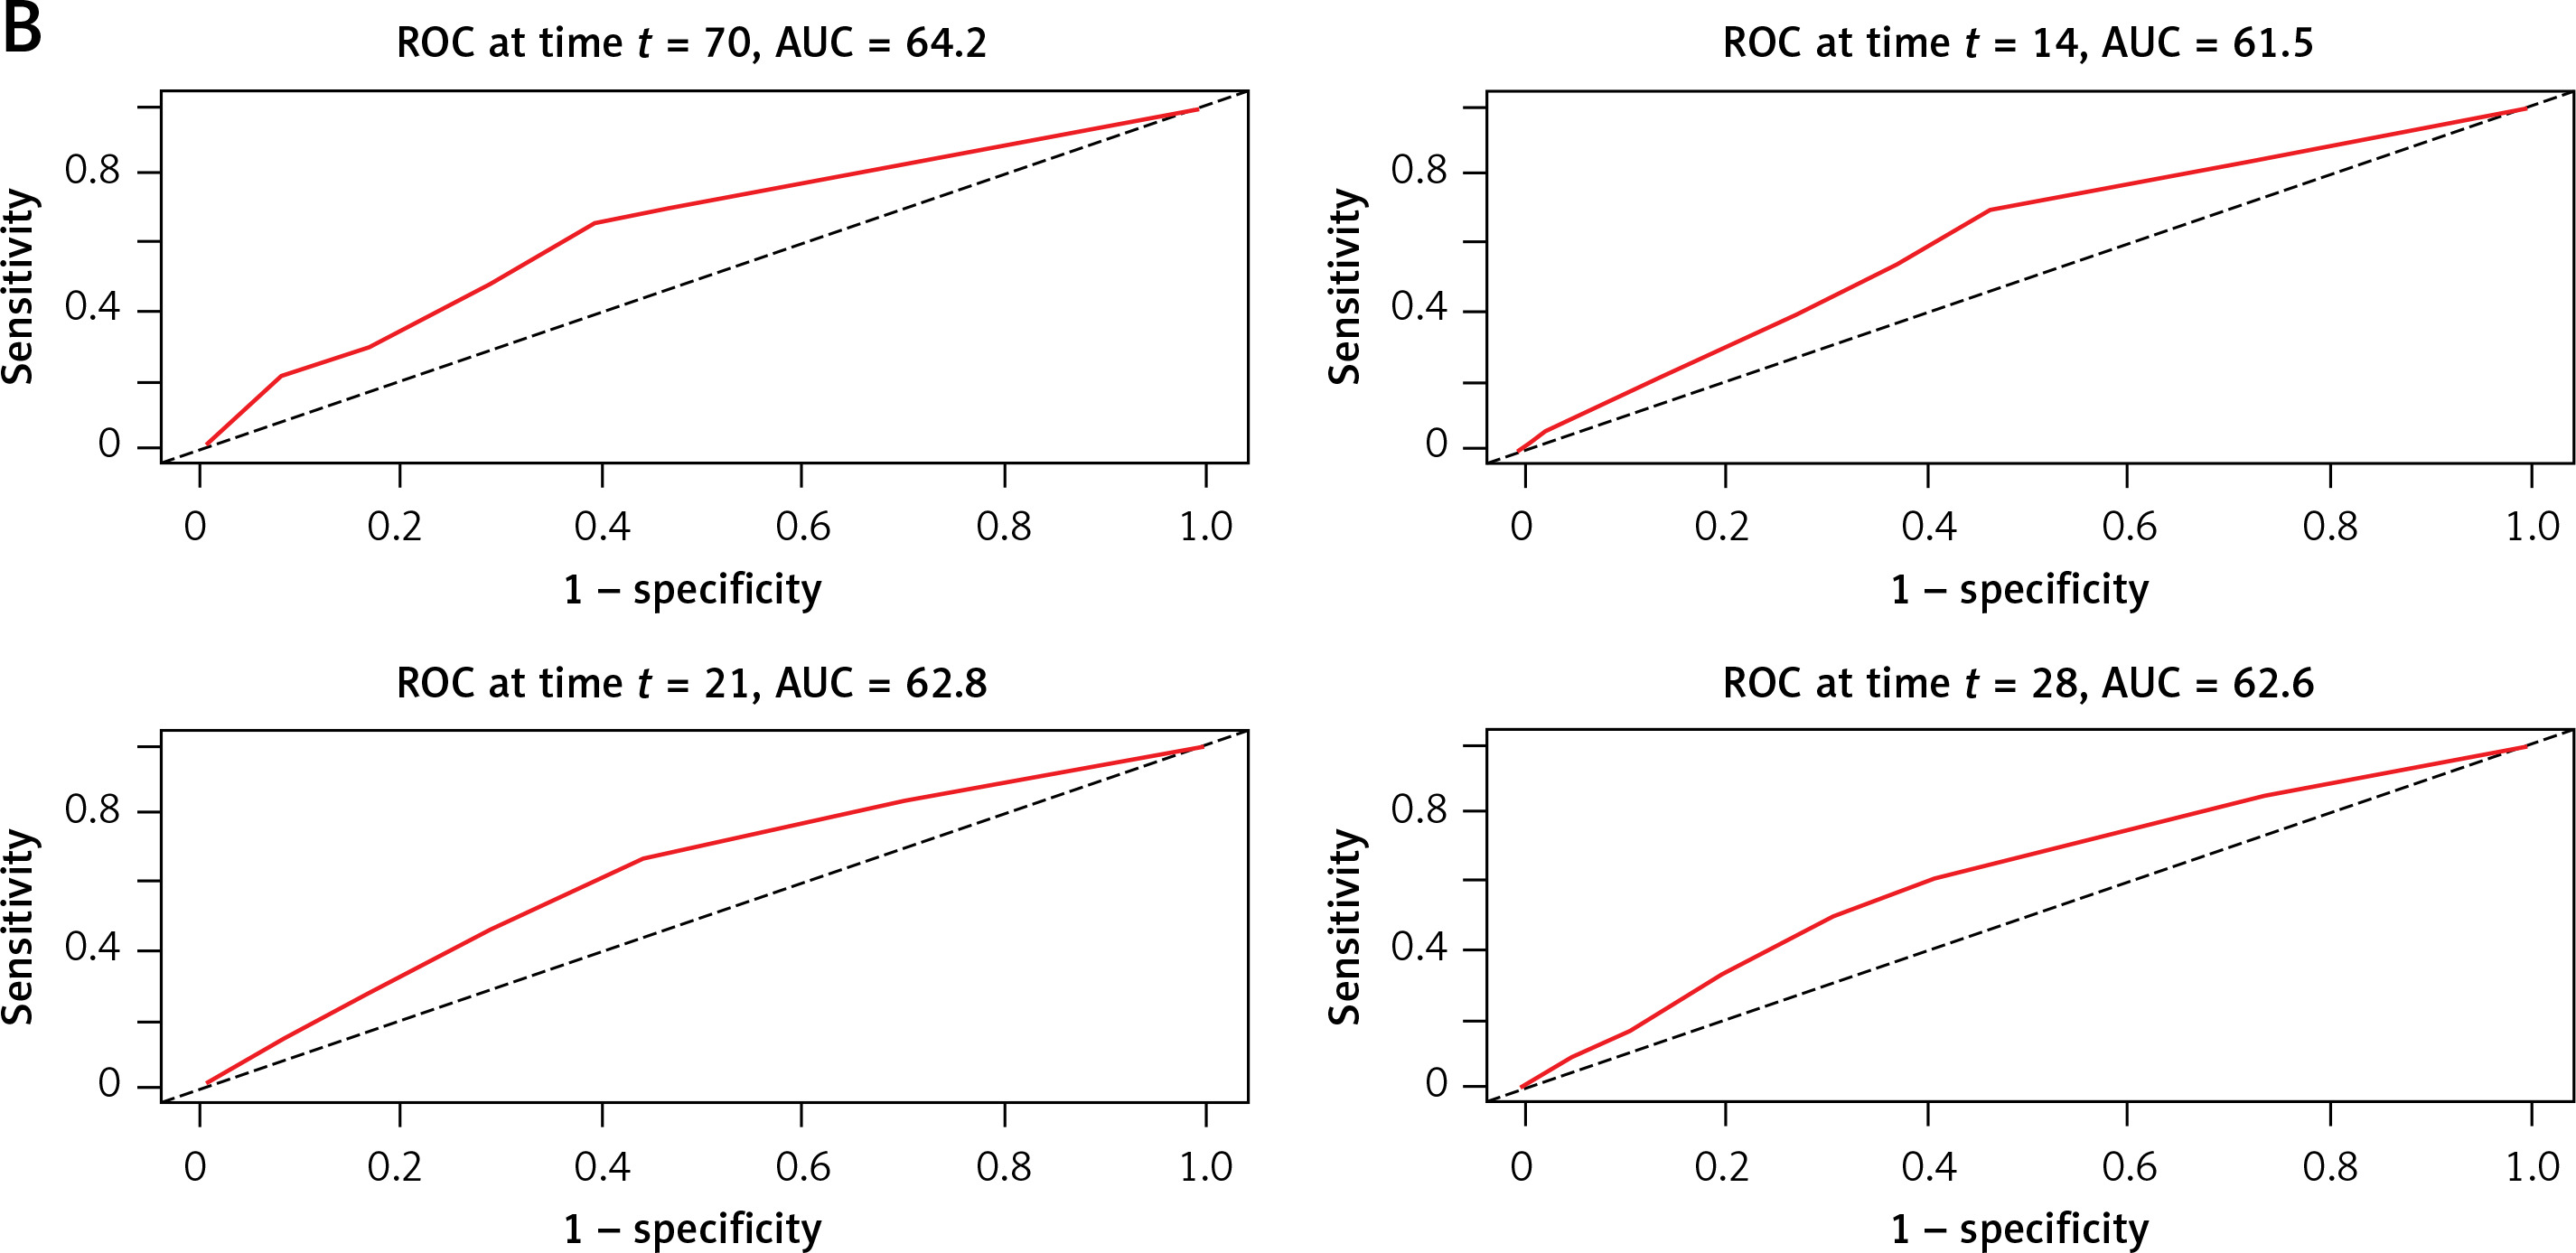
Similarly, the time-ROC analysis was performed to assess the predictive value of the C2HEST score for in-hospital (Figure 2 A) and all-cause (Figure 2 B) mortality at a particular time from admission to the hospital.
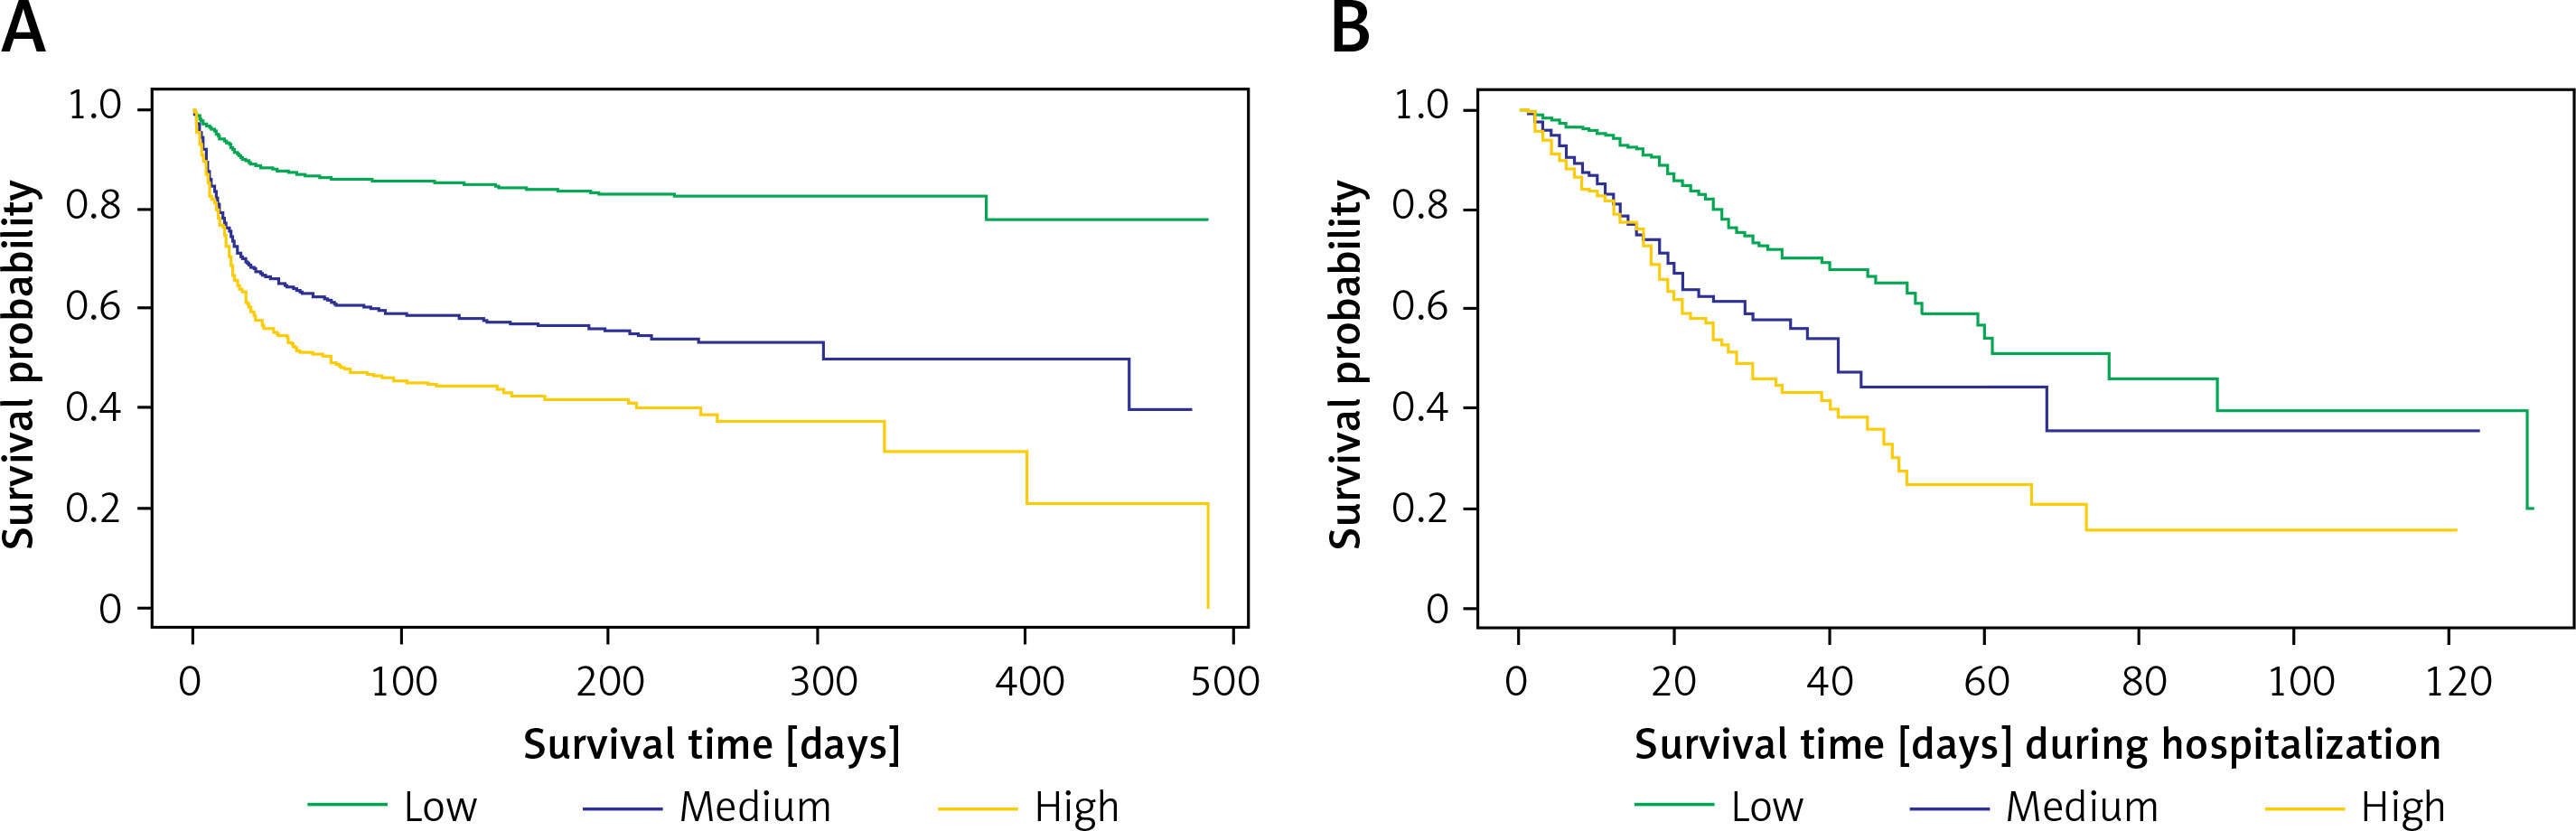
Survival probability for hospitalized COVID-19+ subjects
Kaplan-Meier survival curves, based on the original stratification (low/medium/high for 0–1/2–3/≥ 4 points, respectively), revealed a significant difference (p < 0.0001) in survival probability among risk strata (Figure 3 A). The estimated 6-month survival probability for high-risk subjects was 0.4, while for low-risk subjects it remained above 0.8 throughout the entire observation period. Notably, a similar analysis for in-hospital survival yielded comparable results (Figure 3 B).
Risk-strata matching analysis
To ascertain the optimal risk stratification for differences in Kaplan-Meier survival curves, a comprehensive analysis of all possible C2HEST intervals was performed. The log-rank test statistics revealed that the highest value was achieved for the primary risk categories: 0–1 (low), 2–3 (medium), and ≥ 4 (high) points. This analysis was reiterated for in-hospital mortality, yielding consistent results (Supplementary Tables SVI and SVII).
Effect of C2HEST risk stratification on COVID-19 survival
Two Cox models were analyzed to evaluate the effect of C2HEST score stratification on COVID-19 mortality. The overall model, considering the uncategorized C2HEST score, demonstrated that an increase of one point in the C2HEST score raised the total death intensity by approximately 40% (HR = 1.399, 95% CI: 1346–1453, p < 0.0001). Transitioning from the low to the medium category increased death intensity 3.4-fold, and from the low- to the high-risk group, the hazard ratio was 5.1. A similar analysis for in-hospital deaths showed an increase by one point in the C2HEST score raising the in-hospital death intensity by 1.27-fold. Transitioning from the low to the medium category increased in-hospital death intensity by 2.3-fold, and from the low- to the high-risk group resulted in a HR of 2.96 (Table III). Associations of individual C2HEST score components with mortality are detailed in Supplementary Table SVIII. The Cox proportional hazard model for all-cause death and logistic regression models for other outcomes revealed that CAD and age exhibited the highest prognostic value for in-hospital mortality (Supplementary Tables SVIII and SIX).
Table III
Total all-cause and in-hospital death for C2HEST risk stratification
Associations of C2HEST score with other non-fatal outcomes
Detailed results of the associations of the C2HEST score with other non-fatal outcomes are presented in Supplementary Tables SIV, SV, SX and Supplementary Figure S1. The high-risk-C2HEST-stratum was associated with a higher prevalence of shock (an increase by one point raised the risk by 14% (ORlow vs. high = 1.64, 95% CI: 1.07–2.46, p = 0.0182). The strongest association was also observed for cardiogenic shock (ORoverall = 1.63, 95% CI: 1.38–1.92, p < 0.000 and ORlow vs. high = 10.85, 95% CI: 4.47–28.88, p < 0.001). Myocardial injury, acute HF, and the need for coronarography and revascularization increased with the C2HEST score (for MI: the ORoverall = 1.41, 95% CI: 1.17–1.70, p = 0.0002 while ORlow vs. high = 5.301, 95% CI: 1.93–14.52, p = 0.0009). An increase by one point in the C2HEST score raised the risk for myocardial injury by 36.7% (ORlow vs high = 4.18, 95% CI: 2.95–5.94, p < 0.0001), and for the onset of acute HF 2.03-fold (ORlow vs. high = 35.56, 95% CI: 15.50–82.27, p < 0.0001). A similar tendency was observed for the occurrence of in-hospital stroke/TIA (ORoverall = 1.24, 95% CI: 1.07–1.44, p < 0.001 and ORlow vs. high = 2.04, 95% CI = 0.78–4.73, p < 0.0001). The high-risk subjects had a 2-fold greater risk of developing complete RI compared to the low-risk ones (the ORoverall = 1.19, 95% CI: 1.05–1.36, p = 0.0083). Pneumonia was also more frequent in the high-risk stratum, and an increase by one point in the C2HEST score resulted in a higher risk for pneumonia (ORoverall = 1.28, 95% CI: 1.21–1.36, p < 0.001 and ORlow vs. high = 2.28, 95% CI = 1.74–3.01, p < 0.0001). An increase by one point in the C2HEST increased the risk for sepsis by 36% (ORlow vs. high= 3.37, 95% CI: 1.31–10.23, p = 0.01). The development of AKI and ALD was more common in higher C2HEST risk strata (for AKI: the ORoverall = 1.31, 95% CI: 1.23–1.41, p < 0.0001, ORlow vs. high = 1.86, 95% CI: 2.74–4.56, p < 0.0001; for ALD: ORoverall = 1.26, 95% CI: 1.11–1.42, p = 0.0003, ORlow vs. high = 2.40, 95% CI: 1.21–4.50, p = 0.0084). Also, a higher C2HEST score was associated with a higher incidence of total and gastrointestinal bleeding and a longer duration of hospitalization. An increase by one point in the C2HEST score raised the risk of upper gastrointestinal bleeding by 31% (the ORlow vs. high = 3.80, 95% CI: 1.62–8.58, p = 0.0015) (Supplementary Table SX). The summarized discriminatory performance of the C2HEST score on the clinical events is presented in Supplementary Table SXI.
Sensitivity analysis
Results of the sensitivity analysis are summarized in Supplementary Tables SXII and SXIII. Modification of the C2HEST score definition, such as replacing “thyroid disease” with “lack of hypothyroidism” and adjusting the age cutoff to “> 65 years,” led to a significant increase in predictive value for various endpoints, including all-cause mortality (HRoverall = 1.44, 95% CI: 1.38–1.49, p < 0.0001 and HRlow vs. high = 6.65, 95% CI: 5.16–8.58, p < 0.0001). A one-point increase in the modified C2HEST score raised the risk for in-hospital death by 1.54-fold, whereas subjects from the modified high-risk stratum are at an 8.1-higher risk of in-hospital death. The modified C2HEST score demonstrated improved prognostic value for acute HF (ORoverall = 1.99, 95% CI: 1.75–2.28, p < 0.0001 and ORlow vs. high = 36.73, 95% CI: 11.3–224.52, p < 0.0001), MI (ORoverall = 1.49, 95% CI: 1.23–1.82, p < 0.0001 and ORlow vs .high = 10.83, 95% CI: 3.223–65.45, p < 0.0001), pneumonia (ORoverall = 1.29, 95% CI: 1.23–1.36, p < 0.0001 and ORlow vs. high = 3.04, 95% CI: 2.48–3.74, p < 0.0001), and AKI (ORoverall = 1.35, 95% CI: 1.26–1.45, p < 0.0001 and OR low vs. high = 4.51, 95% CI: 3.11–6.68, p < 0.0001). The ROC curves for the modified C2HEST score (C2HEST-COLOS) are presented in Supplementary Figure S2. The area under the receiver operating curves determined for individual predictors ranged from 0.622 for pneumonia to 0.865 for acute heart failure.
Discussion
This is the first study to demonstrate the usefulness and performance of the C2HEST score in predicting adverse COVID-19 outcomes in the hospitalized all-comers population, including death, cardiovascular complications, pneumonia, the need for mechanical ventilation, acute liver and kidney injury, or gastrointestinal bleeding. Our results show that the C2HEST score, when analyzed both categorically and continuously, has a potent predictive ability for adverse outcomes. The C2HEST score is well recognized among clinical practitioners in cardiovascular and internal medicine. Its simplicity and ease of obtaining the variables constituting its components indicate a potentially wide range of practical applications. Appropriately triaging individuals who are initially at higher risk for complications, particularly cardiovascular ones, and/or poor outcomes is crucial in decision-making processes, especially in situations with limited resources.
Notably, the C2HEST score did not correlate with the prediction of SIRS, MODS, and deep vein thrombosis. Despite this fact, it maintained a high level of discrimination in predicting all-cause in-hospital mortality, post-hospital total mortality, as well as numerous adverse clinical events.
Despite the growing body of literature on COVID-19 outcomes, predicting mortality remains a difficult challenge. The initial management of individuals hospitalized with COVID-19 involves assessing the risk of adverse outcomes and the need for life-saving intervention. This assessment helps in making informed decisions regarding hospital admission and inpatient referrals. Therefore, the use of an appropriate clinical score upon hospital admission to predict which COVID-19 patients will develop critical illness is crucial and may significantly impact future outcomes. So far, several score systems have been introduced to predict adverse COVID-19 outcomes, including the PRIEST score [15], Brescia COVID Severity Scale (BRCSS) [16], COVID-Gram Risk Score [10], and VACO index [17]. Nevertheless, most of them derive from extensive clinical data, including laboratory parameters, physical examination findings, or imaging diagnostics data, which makes them extremely complex and less practical for everyday clinical use. Hence, simple, validated risk-scoring systems with at least moderate predictive value are still lacking. The age of patients has consistently emerged as a strong predictor of COVID-19 mortality [18–20], and it is among the most robust indicators of poor outcomes. Previous studies have also examined individual comorbid conditions such as CAD, COPD, diabetes, and hypertension [6, 21, 22] as potential risk factors for a severe course of COVID-19. Liang et al. were the first to demonstrate that considering the count of multimorbidity may provide better predictive value than analyzing a single disease one by one [10]. This rationale led to the implementation of the C2HEST score for predicting the severity of COVID-19 in individuals. In our study, the analysis of the univariate Cox proportional hazard model for all-cause mortality and the competing risk regression model for non-fatal clinical events confirmed the strongest predictive value for age and CAD when analyzed as individual components of the C2HEST score. The modification of the C2HEST score in the COLOS study, which included the substitution of “thyroid disease” with “lack of hypothyroidism” and a more liberal cutoff point for age (> 65 instead of the initial > 75 years), increased its predictive value for in-hospital mortality and most adverse clinical events. We suggest that such a straightforward modification of the score, as presented in this study, should be considered in the risk stratification of hospitalized COVID-19 patients.
Interestingly, both the C2HEST and C2HEST-COLOS scores demonstrated higher prognostic value for adverse non-fatal cardiovascular events, including MI/myocardial injury and HF, as well as stroke, compared to SIRS, sepsis, or septic shock. Since the components of this score primarily consist of cardiovascular risk factors and cardiovascular disorders, its prognostic value for events attributed to inflammation or coagulopathies may be underestimated. This highlights potential limitations of the C2HEST score, necessitating additional clinical risk assessments, including laboratory parameters for inflammation and coagulation. It is worth noting that statistically significant differences in specific comparisons between the moderate- and severe-risk strata were less frequent. Therefore, the utility of the C2HEST score in predicting the risk of clinical events such as MI, stroke, sepsis, and ALD during COVID-19 is primarily attributable to differences between the low-risk vs. other risk groups. Furthermore, statistical analysis revealed relatively high 3- and 6-month mortality rates in the low-risk group. Notably, these rates remain significantly lower in the low-risk group than the moderate- and high-risk groups, which is the basis for the usefulness of the C2HEST score This observation may be explained by the initial selection of patients upon hospital admission, where individuals with mild illness were treated on an outpatient basis, leading to a relatively high overall mortality rate among hospitalized COVID-19 patients. Nonetheless, the simplicity and prognostic value of the C2HEST score for predicting all-cause mortality and various adverse events may justify its validity for risk assessment.
According to the results of our study, using the C2HEST score to triage patients upon hospital admission based on multimorbidity enables the prediction of both mortality and clinically significant non-fatal adverse events. Given the unpredictable nature of the disease progression and the sudden onset of complications, clinicians may find surprising the need for urgent admission to the intensive care unit or the development of acute organ dysfunction. Our study illustrates that the C2HEST score could serve as a straightforward and valuable tool for clinicians to predict the outcomes of hospitalized COVID-19 patients, facilitating diagnostic and therapeutic decision-making. Individuals categorized into the high-risk C2HEST stratum could benefit from more intensive monitoring. The score could facilitate decisions regarding early transfers to specialized ICU units and the implementation of preventive strategies, potentially averting advanced organ damage.
Additionally, in the CAD cohort, the C2HEST score had predictive value for acute heart failure and hypovolemic shock. However, in the non-CAD cohort, it enabled the prediction of cardiovascular disorders (such as cardiogenic shock, myocardial injury, MI, acute HF episodes, stroke, or TIA), all types of bleeding, acute AKI, and ALD, along with complications of infection such as pneumonia and sepsis [23]. Notably, the C2HEST score’s predictive ability in the HF cohort failed to demonstrate discriminatory performance for mortality and other clinical adverse outcomes during hospitalization. This could be attributed to the fact that HF itself is a strong risk factor for poor COVID-19 outcomes when hospitalization is required. Conversely, in the non-HF cohort, the C2HEST score exhibited significantly better performance in predicting in-hospital and 6-month mortality, as well as other non-fatal clinical outcomes, including cardiovascular events (myocardial injury, acute HF, MI, cardiogenic shock), pneumonia, sepsis, and AKI [24].
Diabetes mellitus, in addition to HF and CAD, is an independent risk factor for a more severe course and higher mortality of COVID-19, as demonstrated in multiple studies [25–27]. In the diabetic cohort, a 1.82-fold higher mortality rate was observed when compared to patients with normal glycemia levels. Interestingly, the mortality risk significantly increased across higher C2HEST strata, irrespective of the presence of glucose metabolism abnormalities [28]. Information on risk factors such as diabetes or smoking, which are not included in the C2HEST score, could also be easily obtained from patients upon admission. We believe that incorporating these factors into the assessment of disease risk could be highly valuable and improve the accuracy of risk estimation in COVID-19 patients.
In summary, we conclude that the C2HEST score may be a valuable tool for predicting adverse COVID-19 outcomes in hospitalized all-comers. Furthermore, the simplicity of the C2HEST score should be considered as its advantage.
We acknowledge several limitations in this study. First, our results are based on data from an analysis of hospitalized cases at a single center, which may affect the validity of our conclusions regarding other cohorts. Second, the data collection period was 2021–2022, i.e., before the dominance of the Omicron variant, which has altered our understanding of the disease, its severity, and its course. Third, this study analyzed the entire cohort of COVID-19 patients, and, like other medical scales assessing the risk of morbidity and mortality, its applicability may be limited in certain circumstances, such as in a subpopulation with a specific comorbid condition. Fourth, we do not have information about the vaccination status of patients before their admission to the hospital.
In conclusion, we have demonstrated the usefulness and performance of the C2HEST score in predicting adverse COVID-19 outcomes in hospitalized individuals. The simplicity of this score, which can be calculated based on comorbidities, may meet medical needs in risk-stratifying COVID-19 patients admitted to the hospital. Early identification of individuals at high risk of developing critical illness is crucial and may facilitate appropriate management and optimize resource utilization. Consequently, it could provide an essential foundation for supporting appropriate triage of COVID-19-positive patients upon admission, followed by an adequate diagnostic and therapeutic decision.