Introduction
Breast cancer ranks as the most frequently diagnosed malignancy among women worldwide, representing approximately 31% of all new cancer cases. Its progression occurs through a complex, multistep process influenced by various interacting factors [1].
Accordingly, four subtypes of breast cancer are widely accepted: luminal A, luminal B, HER2-positive, and triple-negative. The characteristics of these four subtypes are presented in Table I. Luminal cancers predominantly express low molecular weight cytokeratins (CK7, CK8, CK18, etc.) and are distinguished into three groups based on IHC: luminal A, luminal B, and HER2 [2]. Triple-negative breast cancer (TNBC), characterized by a lack of ER, PR, and HER2 expression, represents one of the most aggressive subtypes [3]. TNBC includes transcriptional subtypes such as BL1, BL2, mesenchymal (M), and luminal androgen receptor (LAR), all defined by significant molecular heterogeneity [4, 5].
Table I
Breast cancer subtypes [2]
While chemotherapy remains the primary treatment for TNBC, resistance frequently develops due to intrinsic or acquired mutations, leading to relapse and poor outcomes [6]. The emergence of chemo-resistant cells, which contributes to metastasis and recurrence, is strongly associated with metabolic remodeling [7]. Given their metabolic plasticity, TNBC cells exploit multiple pathways for survival, supporting their growth, metastasis, and therapy resistance [8, 9]. Understanding metabolic reprogramming is essential, as it plays a central role in regulating ferroptosis – a non-apoptotic form of cell death. Ferroptosis is influenced by cellular lipid metabolism, iron homeostasis, and antioxidant capacity, all of which are reprogrammed in cancer cells and represent promising therapeutic targets, particularly in TNBC [9].
Ferroptosis is distinct from apoptosis and necrosis in that it is driven by the accumulation of lipid-based reactive oxygen species (ROS), which results in membrane disruption and subsequent cell death [10].
Defining dependable biomarkers and actionable targets is essential to translate ferroptosis-related mechanisms into clinical strategies for TNBC. Recent studies emphasize the association of certain biomarkers with either susceptibility or resistance to ferroptosis in this cancer subtype [11].
Ferroptosis is a regulated form of cell death influenced by glutathione peroxidase 4 (GPX4), glutathione (GSH) metabolism, System Xc–, and amino acid availability, all of which are altered in TNBC [12]. GPX4, a key antioxidant enzyme, protects lipid membranes from oxidative damage; its function depends on GSH and selenium [13, 14]. ACSL4, by activating long-chain PUFAs, sensitizes membranes to ferroptosis. Its expression correlates with increased susceptibility to ferroptotic death, while its inhibition may offer cytoprotection [15, 16].
The mitochondrial isoform BCAT2 regulates sulfur amino acid metabolism and suppresses ferroptosis. It plays a role in system Xc inhibitor-induced ferroptosis and modulates pathways involving sulfasalazine and sorafenib [17, 18].
Given these insights, the present study aims to explore the relationship between ferroptosis and metabolic reprogramming in TNBC. Specifically, we investigate the expression of GPX4, ACSL4, and BCAT2 in TNBC tissues to evaluate their potential roles in therapy resistance and to identify novel targets that may enhance ferroptotic sensitivity in this aggressive cancer subtype.
Material and methods
In this study, 100 formalin-fixed, paraffin-embedded (FFPE) tissues were used and gene expression analysis of GPX4, ACSL4, and BCAT2 molecules active in ferroptosis was performed for these tissues. The tissues were divided into two groups: tissues of TNBC patients constituted Group I, and breast tissues of healthy individuals in the control group constituted Group II.
Study population
Tissues from those who had breast cancer and TNBC as a molecular subtype made up Group I (n = 60), whereas breast tissues from healthy people made up Group II (n = 40). Within the scope of the study, tissues from patients diagnosed with breast cancer who applied to Mersin University Faculty of Medicine, Department of General Surgery between 2015 and 2024 and healthy individuals who constituted the control group were used.
The patient group included adult women aged 18 years and older with a pathologically confirmed diagnosis of breast cancer and an additional molecular subtype of TNBC. The control group consisted of adult women aged 18 years and older without a pathologically confirmed diagnosis of breast cancer. Breast cancer patients without TNBC molecular subtype, tissues from individuals with a diagnosis other than TNBC, and individuals under 18 years of age were excluded.
Data collection
Demographic data such as age, gender, lateralization, immunohistochemical findings (ER, PR, HER2, Ki67), tumor size, histological grade, lymph node metastasis status, and tumor type were recorded and their relationships were examined.
Sampling of paraffinized tissues was performed at the Department of Pathology, Mersin University Faculty of Medicine. In addition to tumor type, histological grade, tumor size, and lymph node metastasis status, the patients’ clinical and demographic characteristics, such as age, gender, lateralization, and immunohistochemical findings, including ER, PR, HER2, and Ki67 results, were assessed, and the associations between these parameters were examined. Age was categorized into two groups: 50 years and younger, and over 50 years. An Olympus BX53 microscope was used for the initial diagnosis, and histopathological evaluations were conducted as follows: ER and PR positivity was defined by nuclear staining in ≥ 1% of tumor cells, while negativity was defined by nuclear staining in less than 1%. There were three more staining intensity classifications: mild, moderate, and strong. HER2 scoring was assessed according to ASCO-CAP guidelines, categorized as negative (0/+), equivocal (++), or positive (+++) [19]. Ki67 proliferative index ≤ 14 was classified as low proliferative activity and > 14 as high proliferative activity [20]. Tumor sizes were divided into three categories: < 2 cm, 2–5 cm, and > 5 cm. Lymphovascular invasion, perineural invasion, and lymph node involvement were classified as negative, positive, or unknown.
A 4 µm thick section was taken from the paraffin block with a microtome knife. Depending on the tissue size, 3–5 sheets for large tissues and 8–10 sheets for small tissues were sectioned.
Molecular analysis: Expression levels of GPX4, ACSL4 and BCAT2 molecules were determined using the RT-PCR array procedure. The paraffin layer was removed by deparaffinization and transferred to sterile Eppendorf tubes.
Synthesizing cDNA: cDNA was synthesized using the High Capacity cDNA Reverse Transcription Kit (Thermo Fisher Scientific, USA; Cat. No: 4368814) after RNA extraction using the innuPREP FFPE Total RNA Kit (Analytik Jena, Germany; PN: 845-KS-2050050). The following heat cycler parameters were used in the procedure for creating cDNA from RNA extracted from FFPE tissue samples: 10 min at 25°C, 120 min at 37°C, 5 s at 85°C, and 1 min at 4°C.
Analysis of gene expression was then performed. Together with the cDNA samples and forward and reverse primers made especially for the target genes being studied, the TaqMan Gene Expression Master Mix (Applied Biosystems, USA; PN: 4371135) was used. Using the Roche LightCycler 480 II system (Roche Diagnostics, Germany), the procedure was carried out according to the following thermal protocol: an amplification phase comprising 40 cycles of 95°C for 15 s and 60°C for 60 s, followed by a cooling phase at 40°C for 30 s. The incubation phase lasted 50°C for 2 min, and the activation phase lasted 95°C for 10 min.
The reference gene used for normalization was the housekeeping gene beta-actin (ACTB). Following the completion of the experimental procedures, the 2–ΔΔCt technique was used to calculate the relative gene expression levels. The statistical significance of these results was then examined. The concentration and purity of RNA were evaluated using the NanoDrop ND-1000 spectrophotometer (Thermo Fisher Scientific, USA), producing acceptable A260/A280 ratios ranging from 1.8 to 2.0. Table II shows the gene-specific primers that were used.
Statistical analysis
The statistical analysis was performed using IBM SPSS Statistics 22.0. The Kolmogorov-Smirnov normality test was applied to the variables and it was found that the data were not normally distributed. The Mann-Whitney U test, a non-parametric test, was applied for pairwise comparisons. Spearman correlation analysis was used to assess the relationships between the scales and other variables. In this study, a p-value of less than 0.05 was considered statistically significant.
Results
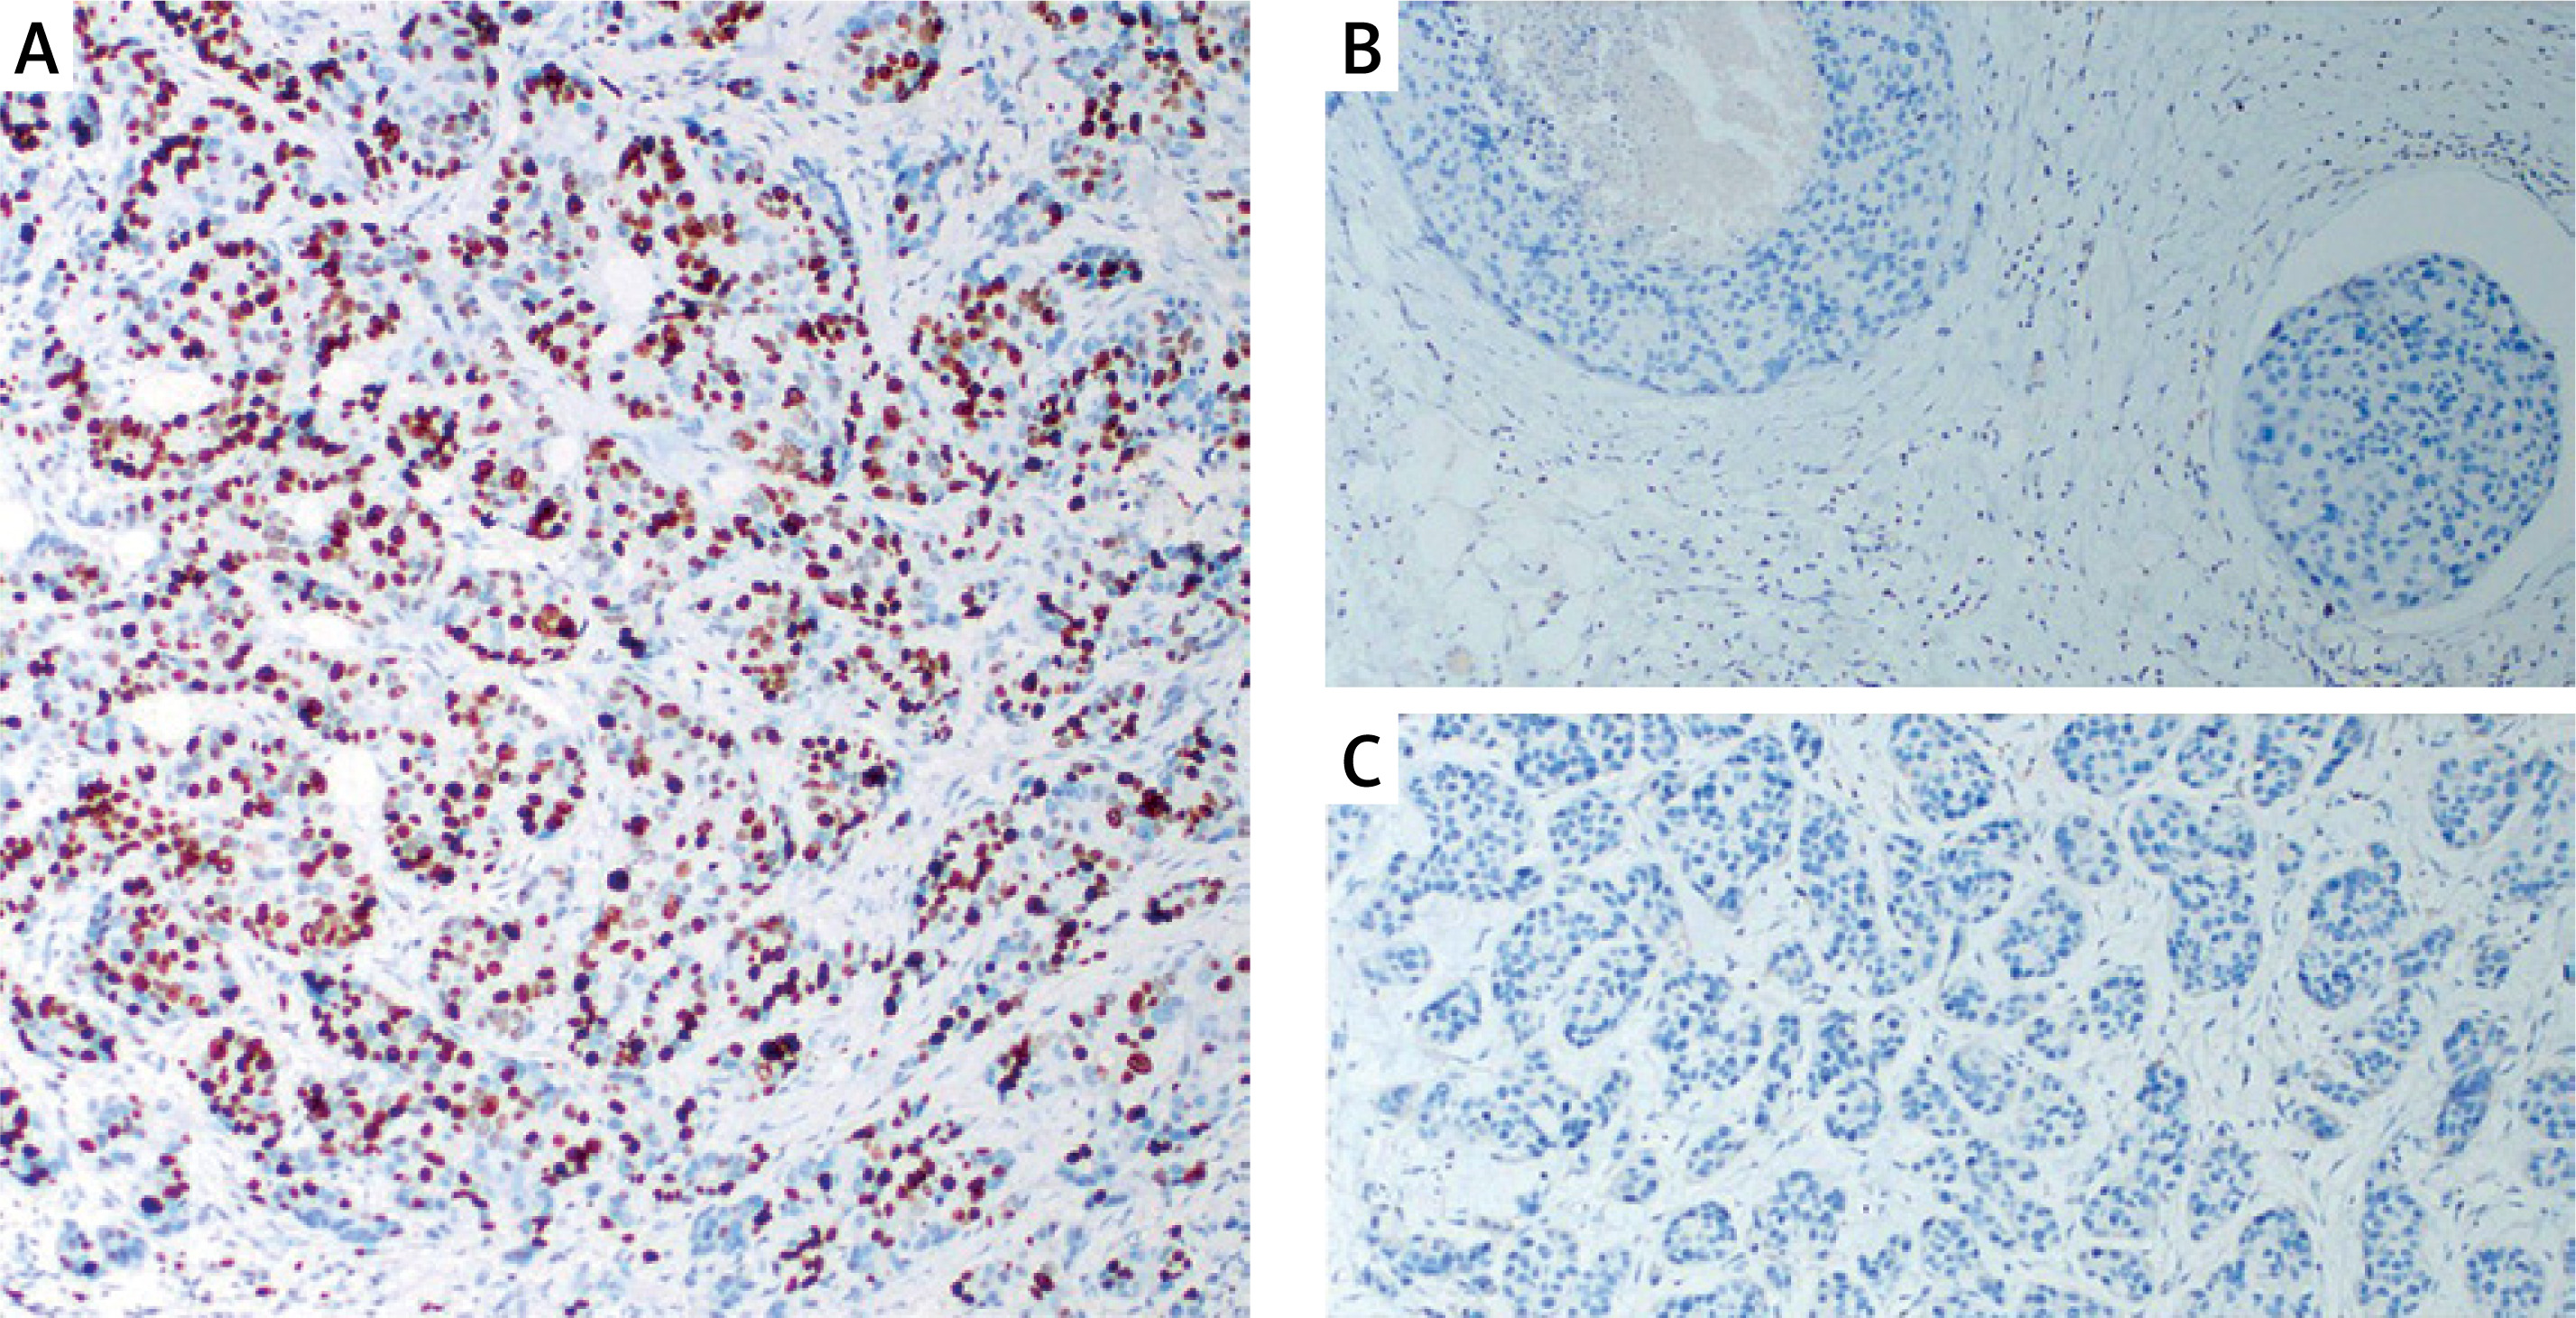
Forty healthy women with a mean age of 40.10 ±11.284 years and 60 women patients with a mean age of 49.77 ±11.725 years were included in this study. Typical IHC staining images of paraffinized tissues are shown in Figure 1.
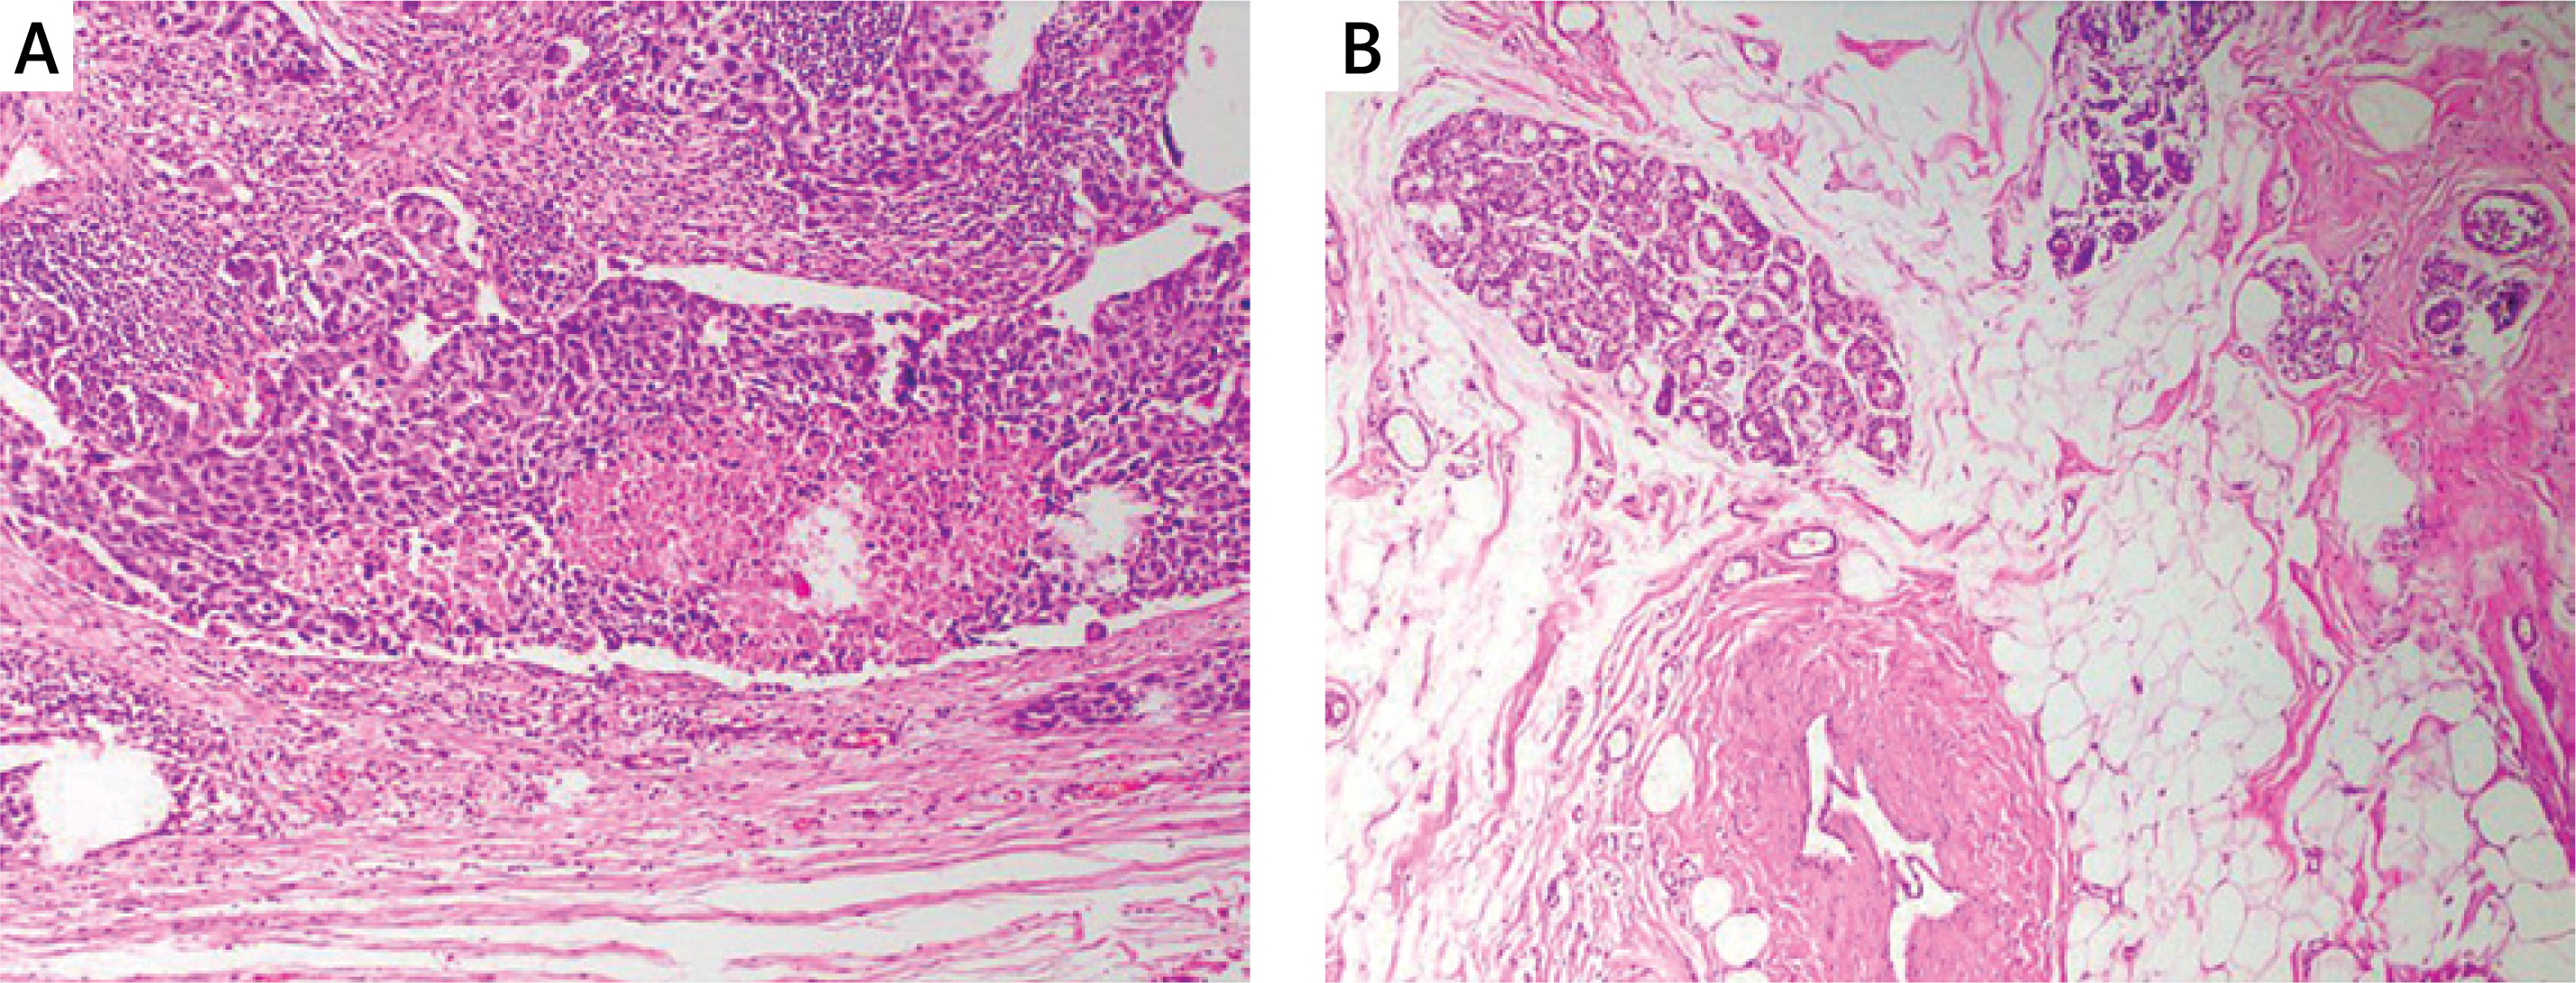
Tissue samples of ER, PR, and HER2 negative patients included in the study are shown in Figure 2. The materials of the cases included 17 tru-cut biopsies and 43 resections. The histopathologic diagnosis of invasive carcinoma (IDCC) was invasive carcinoma (IDC) with medullary pattern, and 95% of the cases had a Ki67 index as high proliferative activity.
Patient demographics and clinical data: 50% (n = 30) of patients were aged ≤ 50 years, 50% (n = 30) > 50 years. Sample types: 71.7% resections (n = 43), 28.3% tru-cuts (n = 17). Tumor sizes: ≤ 2 cm (16.7%, n = 10), 2–5 cm (75%, n = 45), > 5 cm (8.3%, n = 5). Grade: 95% were Grade 3 (n = 57), 5% Grade 2 (n = 3). Ki-67: 95% Luminal B (n = 57), 5% Luminal A (n = 3). Lymphovascular invasion: negative (56.7%, n = 34), positive (25%, n = 15), unknown (18.3%, n = 11). Perineural invasion: absent in 75% (n = 45), positive (8.3%, n = 5), unknown (16.7%, n = 10). Lymph node involvement: negative (18.3%, n = 11), positive (66.7%, n = 40), unknown (15%, n = 9). Full histopathologic data are presented in Table III.
Table III
Histopathologic data of the cases
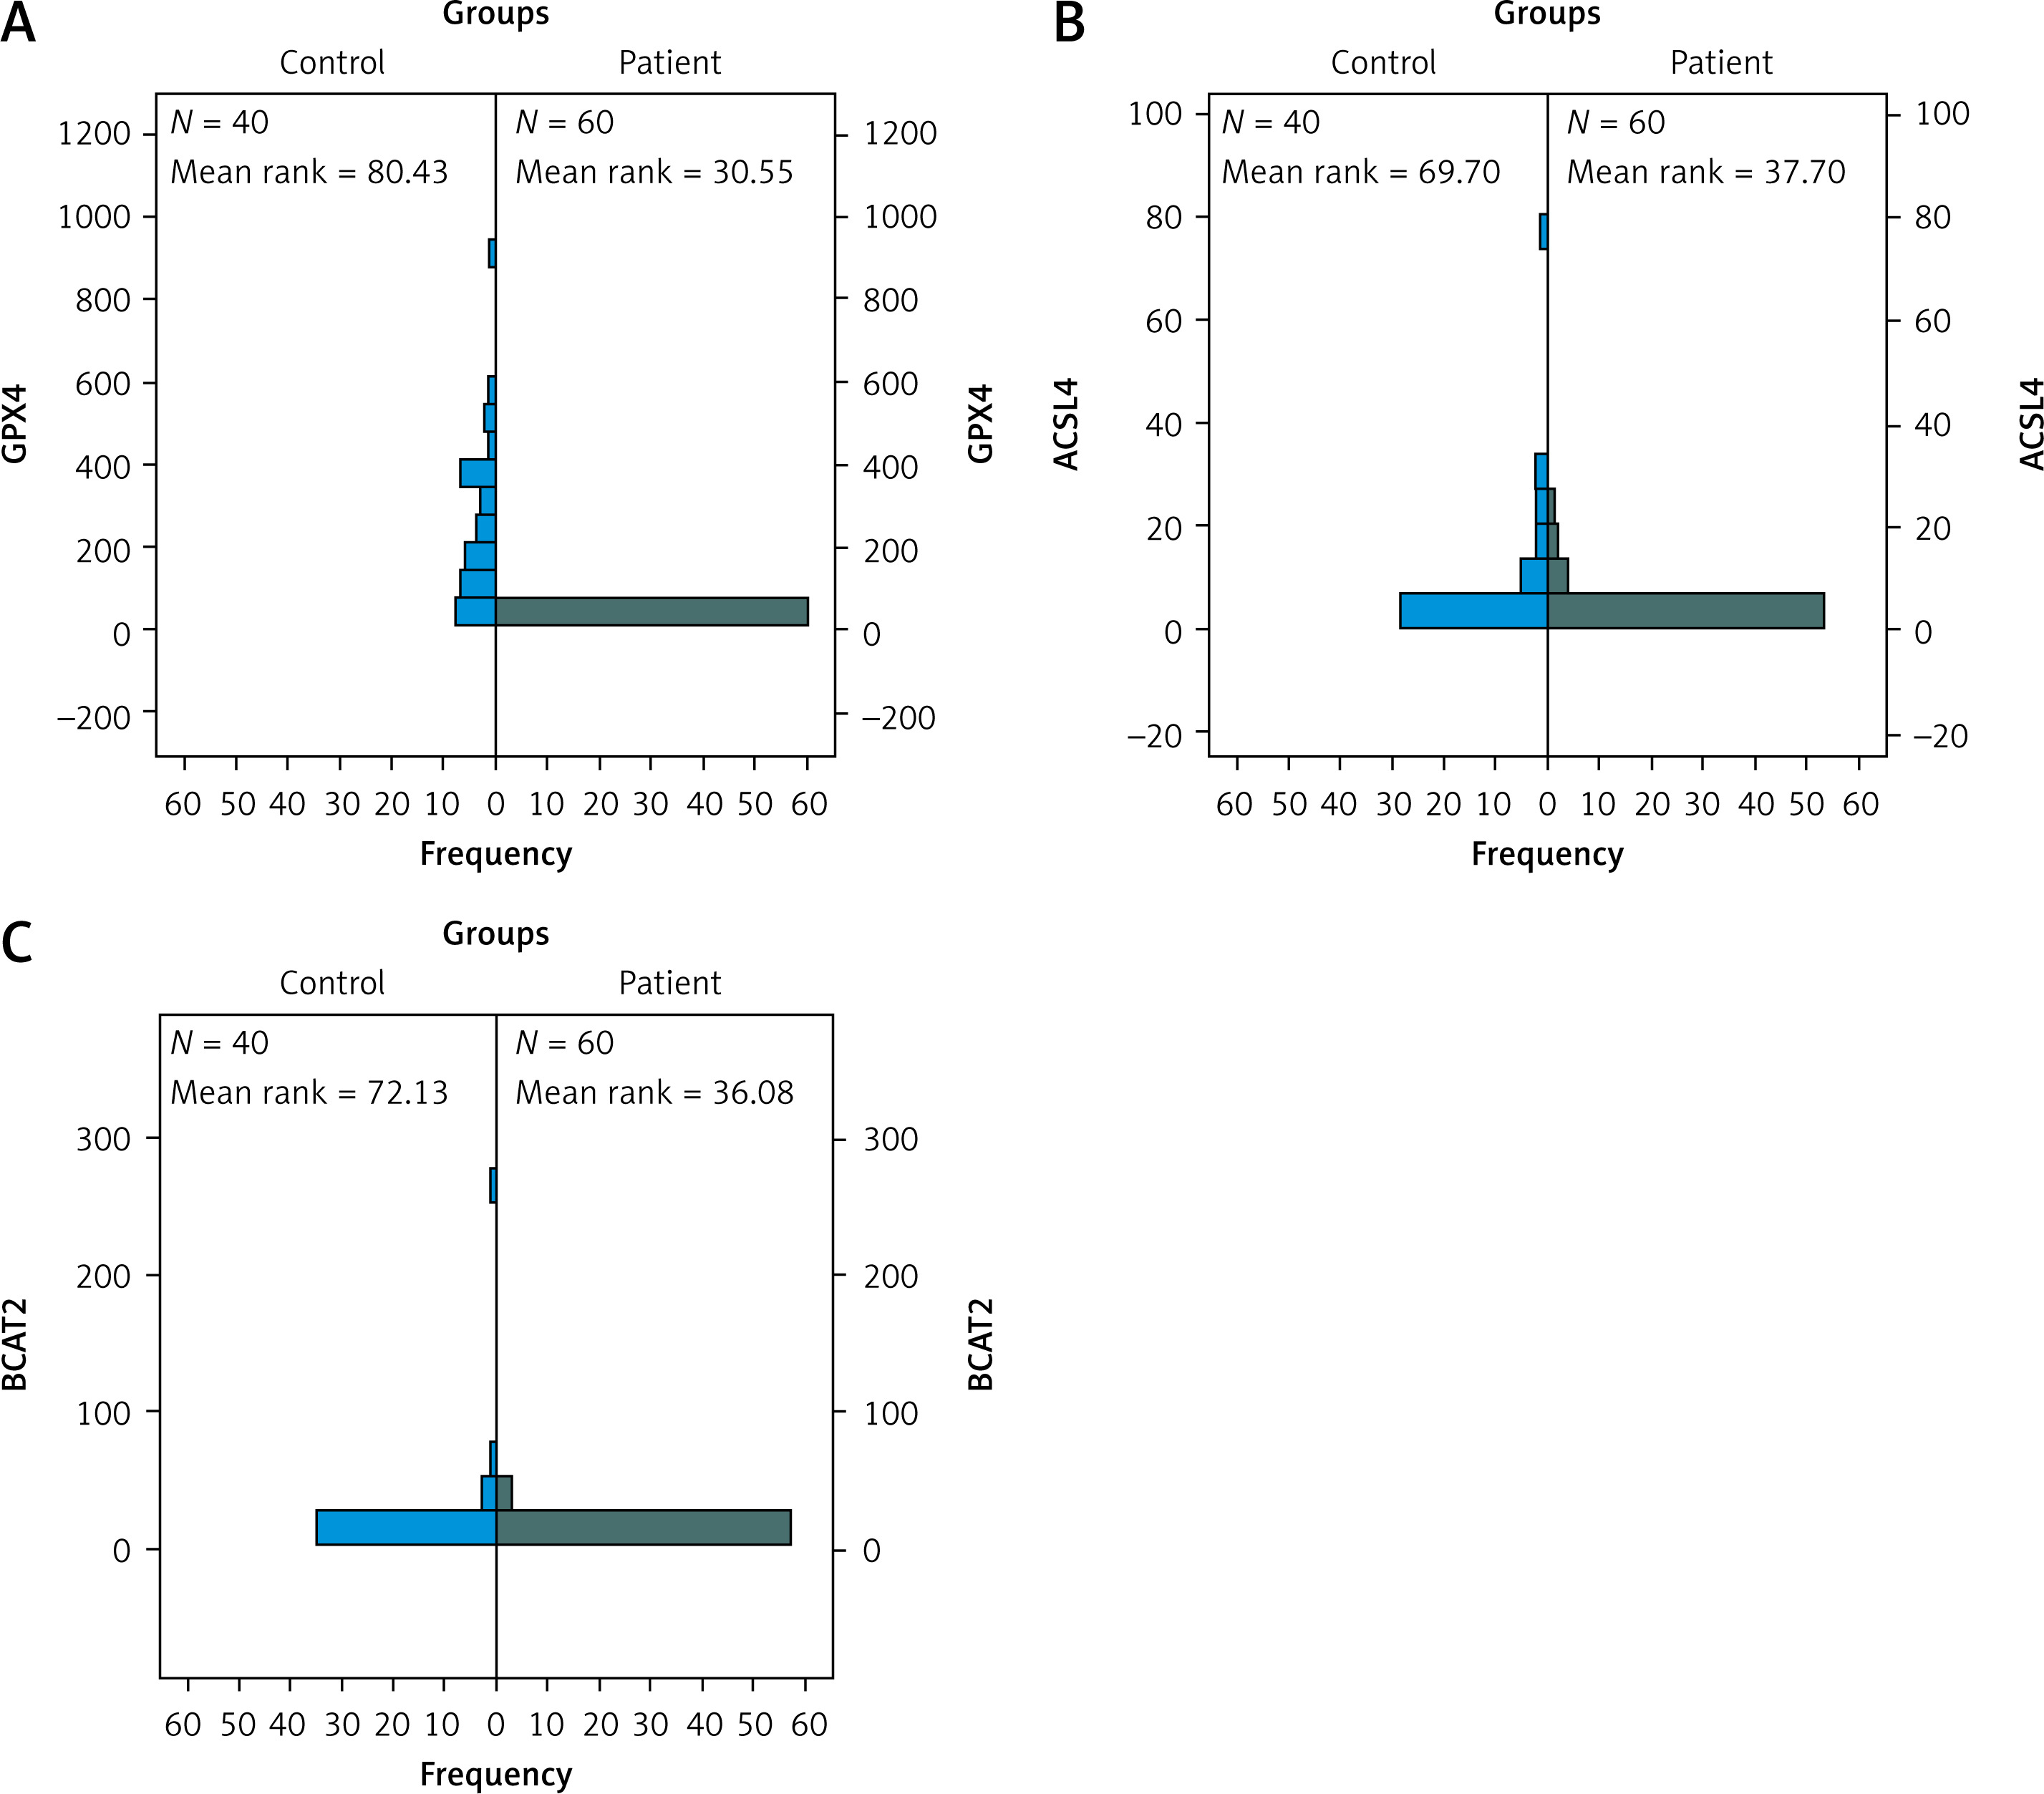
Gene expression levels of ACSL4, GPX4, and BCAT2 were significantly lower in the patient group than in controls (p = 0.0001 for all). See Table IV.
Table IV
Gene expression results
| Parameter | Patient group (mean ± SD) | Control group (mean ± SD) | P-value |
|---|---|---|---|
| ACSL4 | 2.654 ± 4.470 | 8.974 ± 13.372 | 0.0001* |
| GPX4 | 0.239 ± 0.847 | 226.881 ± 183.888 | 0.0001* |
| BCAT2 | 3.884 ± 9.819 | 15.453 ± 43.058 | 0.0001* |
Statistical analysis results showed that ACSL4, GPX4, and BCAT2 gene expression levels were significantly lower in the patient group compared to the control group (Figure 3).
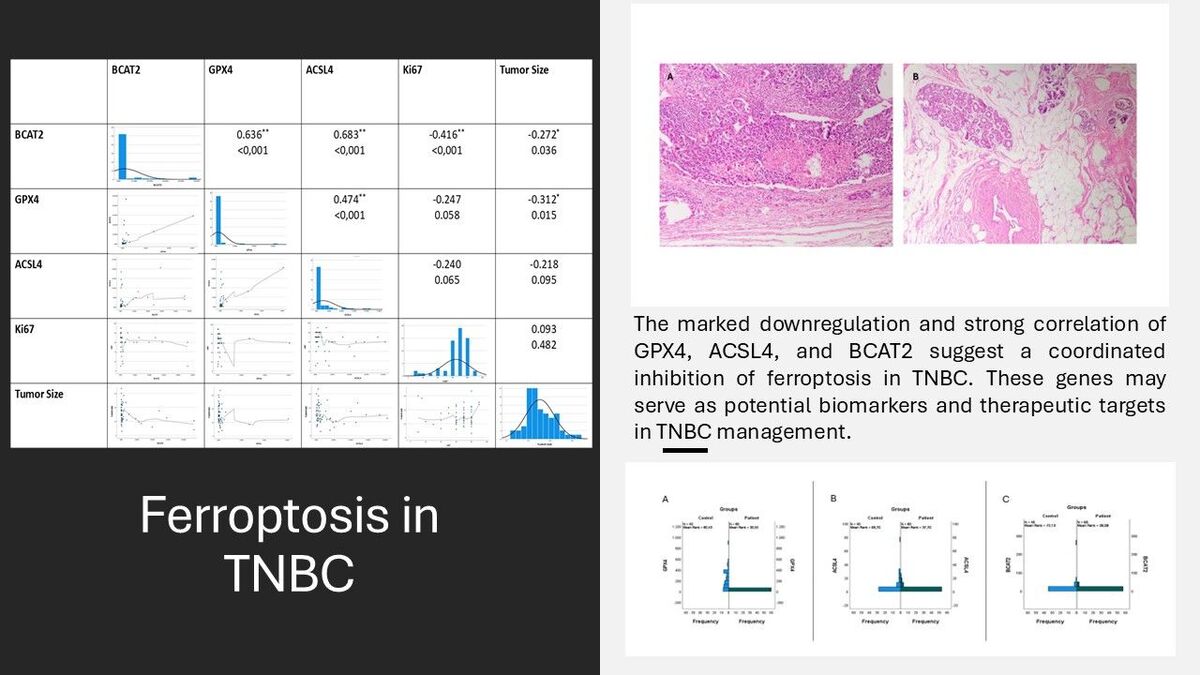
The relationships between the parameters were evaluated by correlation analysis with the analyzed results. A significant positive correlation was found between BCAT2 and ACSL4 (p < 0.001, R = 0.683). Similarly, a significant positive correlation was observed between BCAT2 and GPX4 (p < 0.001, R = 0.636). A strong positive correlation was found between ACSL4 and GPX4 (p = 0.001, R = 0.474) (Figure 4).
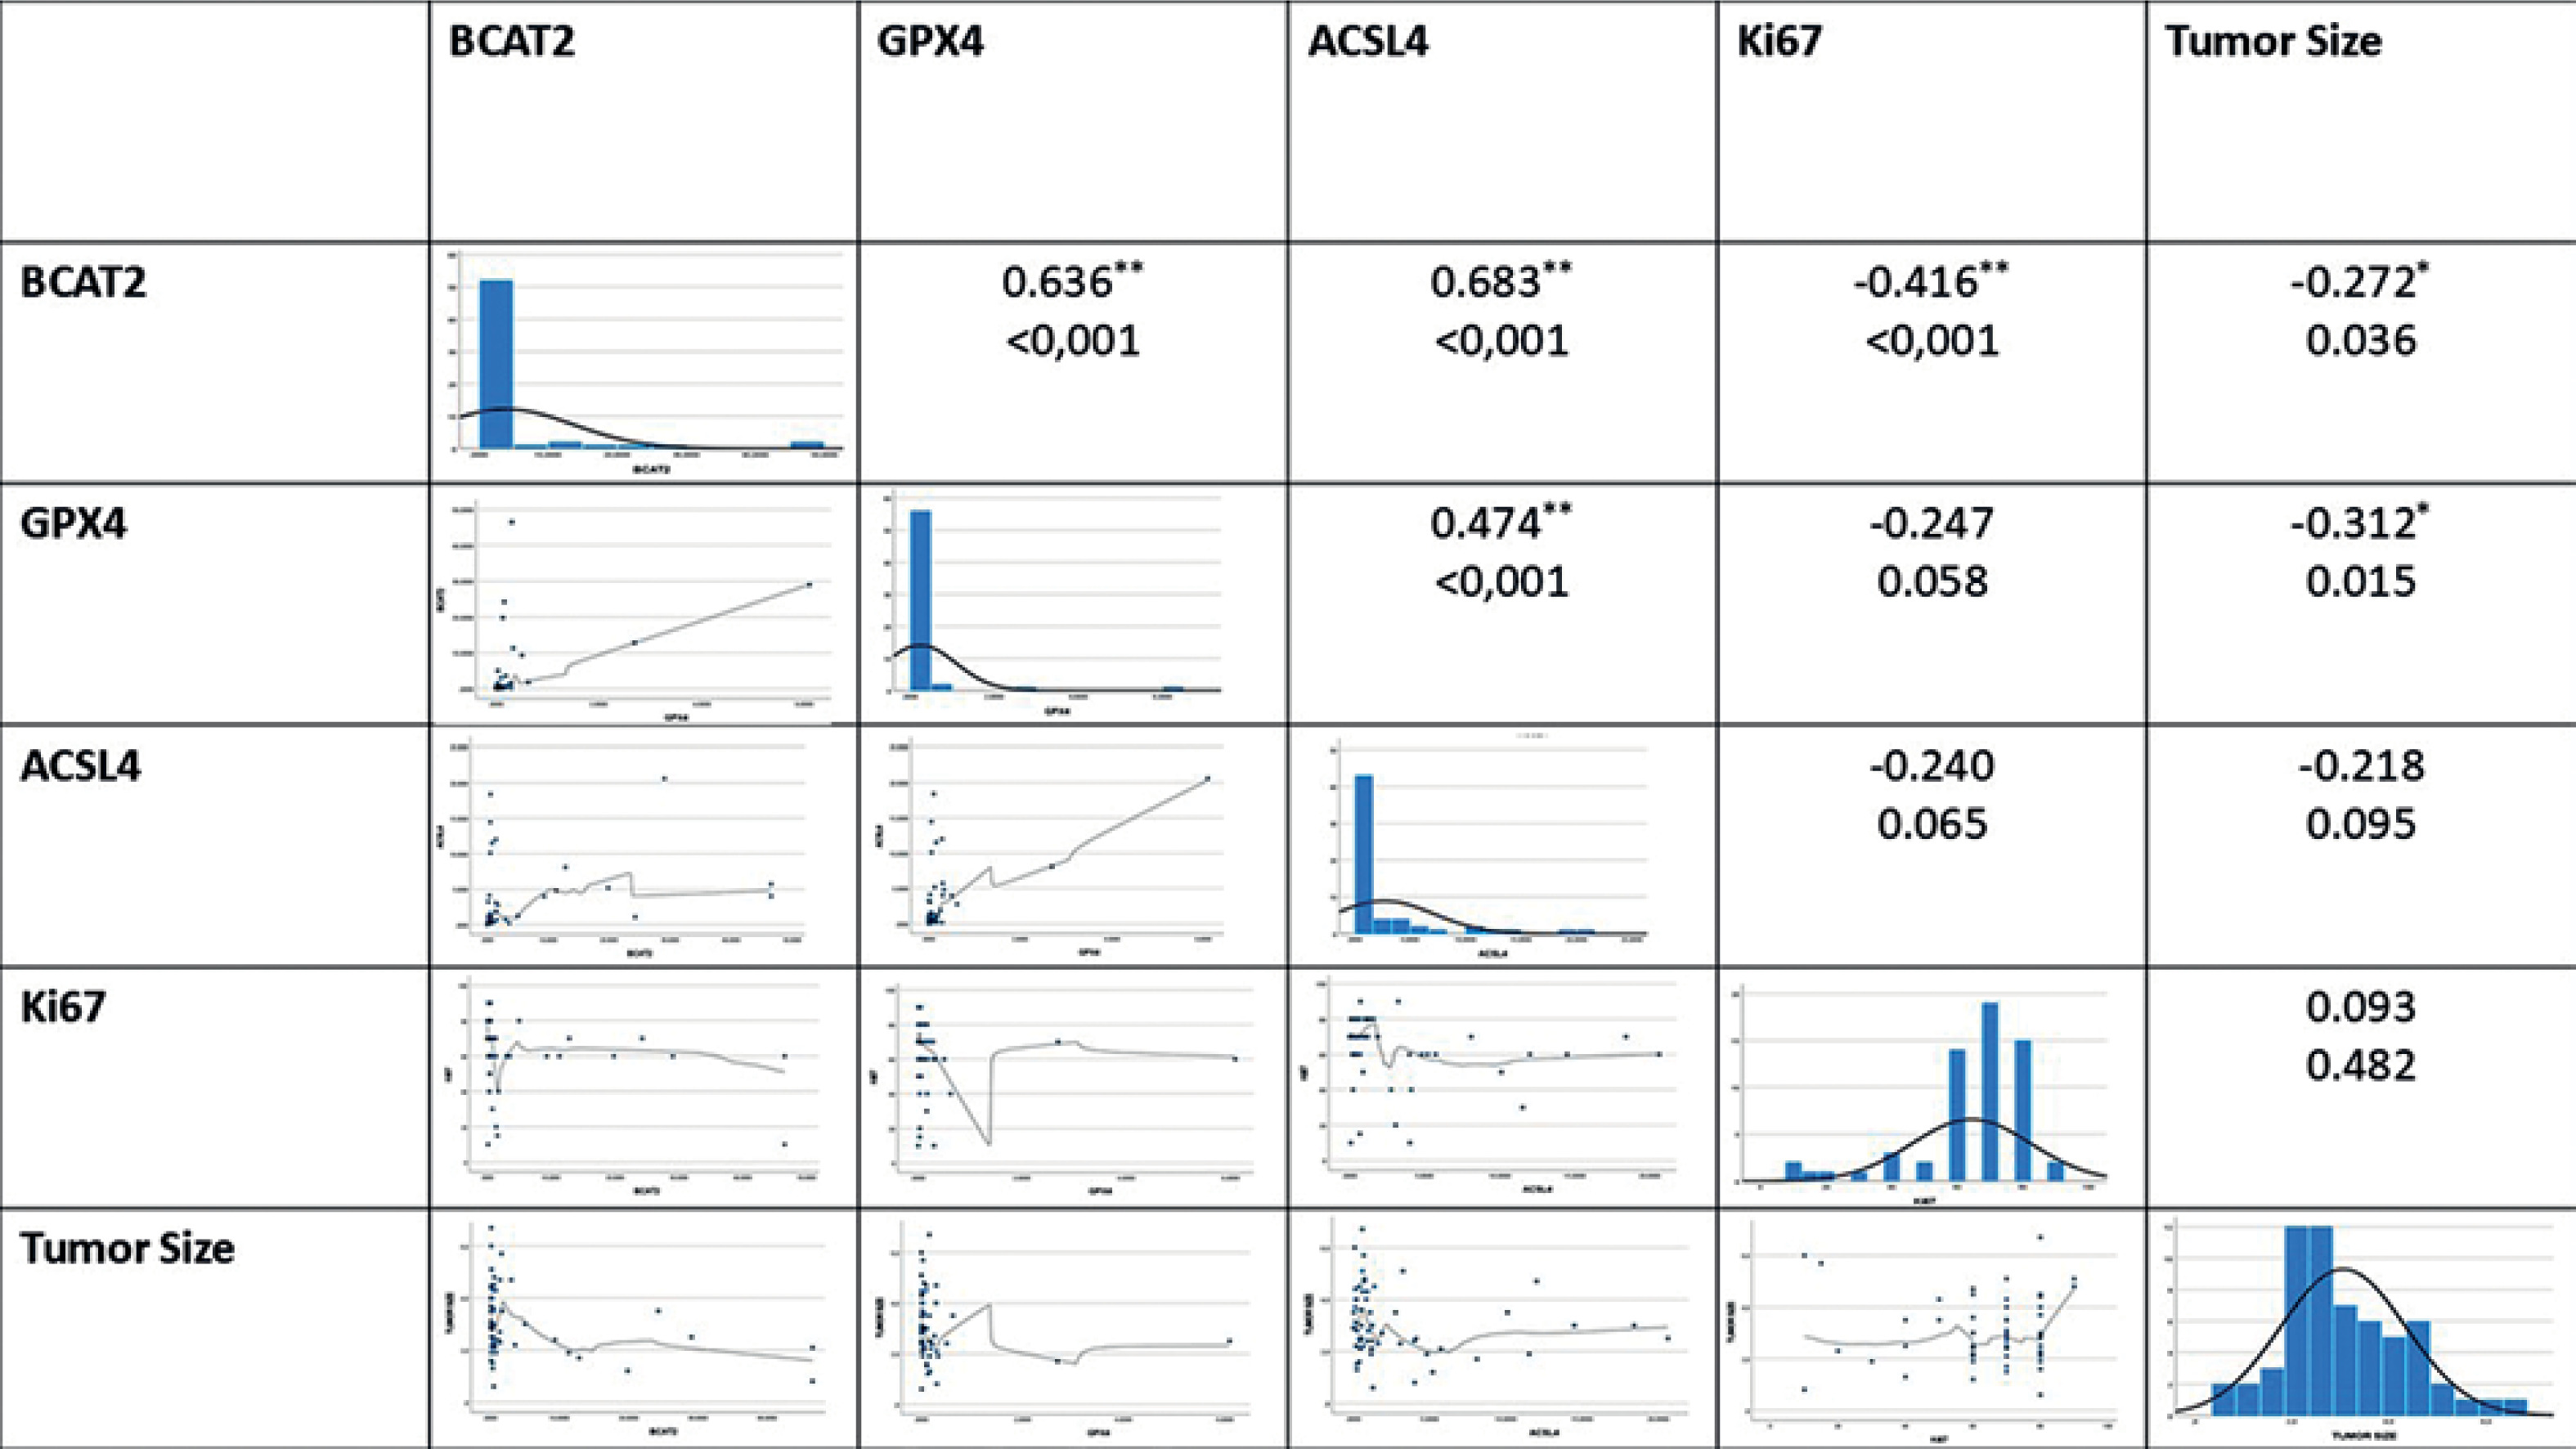
When the general results were examined, a significant negative correlation was found between BCAT2 and tumor diameter (p = 0.036, R = –0.272). Furthermore, there was a significant negative correlation between the proliferation marker Ki-67 and BCAT2 (p < 0.001, R = –0.416).
Multiple linear regression analysis was performed to assess the clinical and histopathological factors influencing the expression levels of BCAT1, ACSL4, and GPX4 genes. In the analysis of BCAT1 expression, the variable perineural invasion was excluded from the model due to multicollinearity. The revised model approached statistical significance (F = 1.852, p = 0.097) and accounted for 20% of the variance in the dependent variable (R2 = 0.200). According to this model, tumor diameter (p = 0.017) and the Ki-67 proliferation index (p = 0.027) had a statistically significant and negative impact on BCAT1 expression. Conversely, variables such as age, histologic grade, biopsy type, lymphovascular invasion, and lymph node status were not found to be statistically significant (p > 0.05). In contrast, the regression models for ACSL4 and GPX4 expression did not reach statistical significance overall, and none of the examined variables were found to have a significant effect on the expression of these genes (p > 0.05).
Discussion
Triple-negative breast cancer (TNBC), characterized by the absence of HER2, PR, and ER expression, is aggressive, with a poor prognosis due to rapid proliferation and metastasis [21]. Ferroptosis, an iron-dependent lipid peroxidation-based cell death, offers a promising therapeutic target [22]. It involves ROS accumulation, peroxidation of PUFA-containing phospholipids, and mitochondrial shrinkage [23]. This study investigated GPX4, ACSL4, and BCAT2 expression in TNBC to inform new therapeutic strategies.
GPX4, a critical antioxidant enzyme, plays a central role in preventing lipid peroxidation and suppressing ferroptosis, thereby promoting TNBC cell survival. Its inhibition has been reported to trigger ferroptotic cell death and may underlie mechanisms of chemoresistance; notably, one study also demonstrated that suppressing GPX4 not only promotes tumor ferroptosis but simultaneously augments antitumor immune responses [24–26]. Our study found significantly decreased GPX4 expression in TNBC tissues (p = 0.0001), which may be linked to patient grade, microenvironment, or tumor stage, as most patients were Grade 3.
Gankyrin, overexpressed in TNBC, promotes p53 degradation via MDM2 interaction and elevates GPX4, suppressing ferroptosis. Its silencing stabilizes p53, reduces SLC7A11, and lowers GPX4 [27]. These mechanisms support our findings and highlight upstream regulators such as gankyrin as therapeutic targets. Paclitaxel and apatinib combination therapy suppresses GPX4 and SLC7A11, promoting ferroptosis via increased iron and lipid peroxidation [28]. Our findings of reduced GPX4 expression in TNBC align with this, emphasizing GPX4’s therapeutic relevance. Evaluating systemic therapies’ effects on ferroptosis could enable more targeted TNBC treatment.
GPX4 also contributes to TNBC progression in obesity contexts, and its inhibition curbs tumor growth [29]. GPX4 also enhances TNBC cell adaptation to oxidative stress by cooperating with other ferroptosis-inhibiting mechanisms [30]. Exploring ferroptosis pathways alongside chemotherapeutic or targeted drugs may improve understanding and support the development of more effective TNBC treatments.
ACSL4 transcription is regulated by RORα (promoter-level) and ERRα (direct control), with Sp1 acting as a key promoter modulator in TNBC. Post-transcriptional regulation via mRNAs also influences ACSL4 expression [31]. ACSL4 modifies cell membrane lipids, increasing ferroptosis sensitivity. Elevated ACSL4 in cancer cells promotes ferroptosis, while low expression or gene deletion induces resistance [16].
ACSL4 promotes ferroptosis by incorporating PUFAs into phospholipids. Conversely, ACSL3 favors mono-unsaturated fatty acids, enabling cancer cells to escape ferroptosis. Expression shift from ACSL4 to ACSL3 may underlie the low ACSL4 levels in our TNBC group [32]. Although ACSL3 was not analyzed, its possible upregulation warrants further study on their coordinated regulation. Mammary adipocytes may protect TNBC cells from ferroptosis via oleic acid through an ACSL3-dependent pathway. ACSL3 silencing increased lipid peroxidation and reduced cell viability. The observed ACSL4 reduction may reflect a compensatory ACSL3 increase [33], highlighting the need for deeper mechanistic studies.
In our study, BCAT2 (hBCATm) expression was significantly decreased in TNBC tissues, consistent with 2021 findings. As a key enzyme in BCAA transamination and intracellular metabolism regulation, its suppression suggests altered mitochondrial BCAA metabolism and metabolic reprogramming. BCAT2 co-regulates lipogenic factors such as SREBP1 and may interact with IDH1 [17], indicating its role in ferroptosis sensitivity, redox balance, and energy metabolism.
CRISPR/Cas9 screening in HepG2 cells identified BCAT2 as a ferroptosis repressor, with inducers downregulating it via the AMPK/SREBP1 pathway. BCAT2 modulates glutamate levels and counteracts the effects of system Xc– inhibitors, protecting against ferroptotic death [34]. Our study’s reduced BCAT2 expression in TNBC aligns with these findings, suggesting impaired ferroptosis regulation and potential sensitivity to ferroptotic stimuli. Future studies should investigate AMPK/SREBP1 and system Xc– axis regulators in this context.
Literature reports on AMPK’s role in ferroptosis are contradictory. Some show that AMPK promotes ferroptosis via BECN1 phosphorylation and complex formation with SLC7A11 [35], while others indicate that energy stress-activated AMPK inhibits ferroptosis [36].
These conflicting results may stem from variations in basal AMPK activity and microenvironmental factors. Our finding of suppressed BCAT2 expression, linked to AMPK/SREBP1 signaling, suggests that AMPK may influence ferroptosis regulation in TNBC. Thus, further mechanistic studies are warranted to clarify the AMPK-BCAT2-ferroptosis relationship.
We observed strong positive correlations between GPX4, ACSL4, and BCAT2. The most robust was between BCAT2 and ACSL4 (p < 0.001, R = 0.683), followed by BCAT2–GPX4 (p < 0.001, R = 0.636) and GPX4–ACSL4 (p = 0.001, R = 0.474). These findings imply their co-suppression in TNBC, potentially increasing ferroptosis sensitivity. BCAT2’s correlation with both molecules links energy metabolism and lipid peroxidation, supporting their joint use in ferroptosis-based therapeutic strategies.
In this study, GPX4, ACSL4, and BCAT2 expression levels were significantly decreased in TNBC tissues compared to controls. Strong positive correlations between these molecules suggest coordinated ferroptosis regulation in TNBC. While some studies report opposing GPX4–ACSL4 patterns [37], our results show a positive correlation, possibly reflecting TNBC-specific molecular dynamics. BCAT2’s strong correlation with both GPX4 and ACSL4 further supports a link between amino acid metabolism and lipid peroxidation, highlighting the role of metabolic reprogramming. These genes may serve as biomarkers for both disease characterization and therapeutic targeting in TNBC.
Given the downregulation of GPX4, ACSL4, and BCAT2 in TNBC tissues, future research may focus on therapeutic approaches such as GPX4 inhibitors (e.g., RSL3, ML210), ACSL4 modulation, or RNA interference strategies targeting BCAT2. These interventions hold promise for restoring ferroptotic sensitivity and overcoming treatment resistance in TNBC.
This study has several limitations. Firstly, the number of patients was relatively limited, and the fact that the samples were obtained from a single center limits the generalizability of the results to larger populations. Secondly, GPX4, ACSL4, and BCAT2 gene expression levels were evaluated only by RT-qPCR; confirmatory analyses at the protein level and functional validation experiments (e.g., ferroptosis induction assays, gene knockdown) could not be performed due to budgetary and technical constraints. Thirdly, the retrospective nature of the study prevented access to longitudinal clinical outcomes such as survival and treatment response. Future studies should aim to address these limitations through prospective, multicenter designs, inclusion of functional assays, and long-term follow-up to fully assess the prognostic and therapeutic potential of ferroptosis-related genes in TNBC.
In conclusion, our study demonstrates that the expression levels of GPX4, ACSL4, and BCAT2 – three key regulators of ferroptosis – are significantly lower in triple-negative breast cancer tissues compared to healthy controls. The strong positive correlations observed among these genes suggest coordinated suppression of ferroptosis in TNBC, potentially contributing to tumor aggressiveness and treatment resistance. These findings support the notion that ferroptosis plays a central role in TNBC biology and highlight the potential utility of GPX4, ACSL4, and BCAT2 as diagnostic and therapeutic biomarkers. Although further functional and clinical validation is required, our results lay the groundwork for future studies aiming to exploit ferroptosis-targeted strategies as a novel therapeutic approach in managing TNBC.