Introduction
Non-alcoholic fatty liver disease (NAFLD) is a metabolic liver disorder characterized by hepatic steatosis and represents one of the most prevalent causes of chronic liver disease globally [1]. The accumulation of free fatty acids (FFAs) or triglycerides (TG) in the liver, without secondary causes of hepatic fat accumulation, represents the primary pathological pathway of NAFLD. The disease spectrum ranges from non-alcoholic simple steatosis, marked by lipid deposition in hepatocytes, to non-alcoholic steatohepatitis (NASH), which is accompanied by varying levels of hepatic inflammation and fibrosis. In advanced stages, NAFLD may progress to cirrhosis and is a significant cause of cryptogenic cirrhosis, arising without any identifiable underlying etiology [2]. Although cirrhosis is a well-recognized risk factor for the development of hepatocellular carcinoma (HCC), in NAFLD, up to 50% of patients with HCC show no clinical or histological evidence of cirrhosis, highlighting NAFLD-caused various pathological pathways that contribute to different clinical presentations [3, 4].
The term “metabolic dysfunction-associated steatotic liver disease” (MASLD) has been introduced to replace “NAFLD” to reflect better the underlying metabolic dysfunctions associated with the disease while offering improved clarity for clinical, research, and patient care purposes. The diagnostic criteria for MASLD include evidence of hepatic steatosis, detected through imaging or histology, and the presence of at least one cardiometabolic risk factor, such as obesity (body mass index (BMI) ≥ 25 kg/m2), type 2 diabetes mellitus (DM), hypertension (HT), hypertriglyceridemia, or dyslipidemia [5].
Steroid hormones play a crucial role in lipid metabolism, and deregulation of their levels or bioactivity is linked to varying degrees of hepatocellular damage. Glucocorticoids (GC) decrease lipogenesis; in combination with insulin, they act synergistically to increase lipid accumulation. They also profoundly affect adipose tissue, driving lipolysis and adipocyte differentiation [6]. Their lipolytic action may be responsible for enhanced FFA delivery to the liver, fueling the MASLD phenotype. In Cushing’s syndrome (CS), elevated circulating GC leads to visceral obesity, insulin resistance, and hepatic steatosis [7]. Additionally, activation of the renin–angiotensin–aldosterone system, regulated by steroid hormones and their receptors, contributes to liver inflammation and fibrosis. Steroid hormone receptor-regulated target genes are also involved in cholesterol and fatty acid metabolism, thus playing a role in the pathogenesis of NAFLD [8, 9].
Liver biopsy remains the gold standard for diagnosing NAFLD and hepatic fibrosis. However, it is not commonly used in routine practice due to its invasive nature. Imaging techniques are therefore critical for detection, with ultrasound (USG) being particularly valuable due to its accessibility, non-invasive approach, and cost-effectiveness. USG can identify hepatosteatosis (HS) by increased echogenicity, while computed tomography (CT) and magnetic resonance (MR) spectroscopy reveal HS through decreased hepatic attenuation and an increased fat signal, respectively. USG demonstrates a sensitivity of 84.8% and a specificity of 93.6% for moderate liver steatosis, though its detection rate decreases in mild cases (< 30%) [10, 11].
In CS, imaging-based HS incidence is around 20% [12]. Tarantino et al. suggested that the low incidence of HS in patients with CS may be explained by the anti-inflammatory effects of elevated GC in CS. High circulating GC levels can inhibit low-grade chronic inflammation, primarily mediated by interleukin-6 (IL-6), which is thought to play a role in developing HS. However, there are limited data regarding the impact of GC on HS in MASLD.
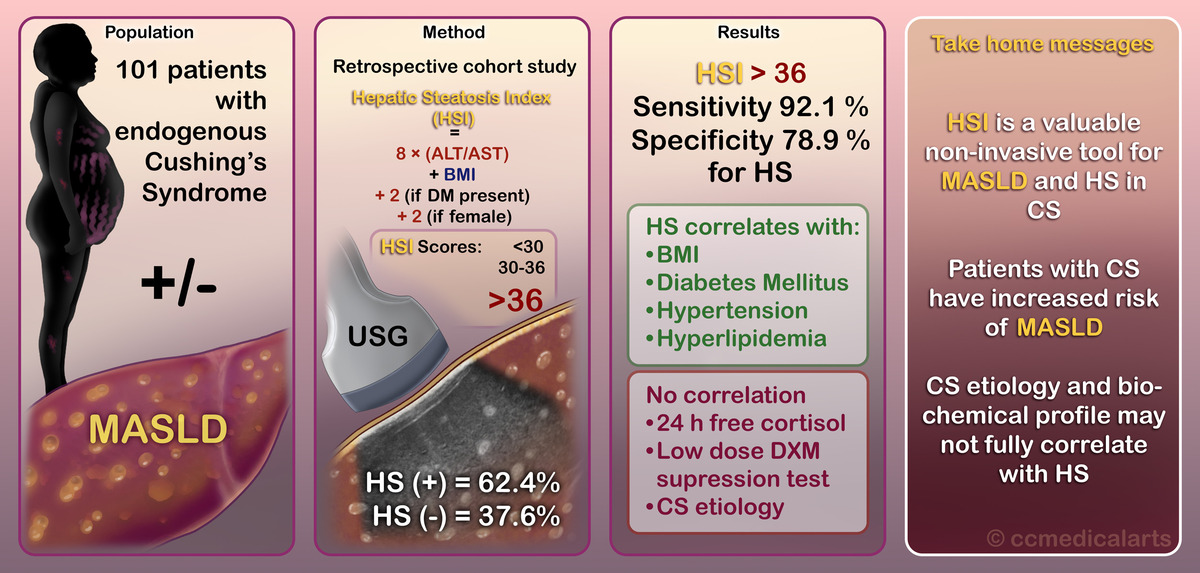
We aimed to assess the predictive power of the hepatic steatosis index (HSI) in diagnosing MASLD in patients with endogenous CS.
Material and methods
Study design and ethical approval
This single-center, retrospective cohort study was conducted at the Endocrinology and Metabolism Department of Ankara City Hospital, Ankara, Türkiye. Ethical approval was obtained from the local ethical committee on June 9, 2021 (Reference No. E1-21-1832).
Inclusion and exclusion criteria
Participants included patients aged 18 years or older of both sexes diagnosed with endogenous CS.
Exclusion criteria
Exclusion criteria were as follows:
Unwillingness to participate.
Alcohol intake exceeding 20 g/day for women or 30 g/day for men.
History of viral hepatitis, autoimmune hepatitis, hereditary liver diseases, drug-induced hepatitis, or other chronic liver diseases.
Non-euthyroid status.
Presence of hypopituitarism.
Current pregnancy or lactation.
Diagnosis of active malignancy.
Eligible participants were informed about the study details and provided written informed consent before enrollment.
Data collection
Data collection involved morning blood sampling after a 12-hour fasting period, adhering to uniform laboratory standards. Collected variables included:
Demographic and clinical data: age, sex, medical history, and comorbidities.
Anthropometrics: BMI, calculated as weight (kg)/height2 (m2), height, and weight.
Laboratory assessments: complete blood count, alanine aminotransferase (ALT), aspartate aminotransferase (AST), low-density lipoprotein cholesterol (LDL-C), HDL cholesterol (HDL-C), TG, fasting plasma glucose (FPG), and glycated hemoglobin (HbA1c).
CS-specific assessments: Etiology, morning cortisol, 24-hour urinary free cortisol (UFC), salivary cortisol, and dexamethasone suppression test results.
The diagnosis of hepatic steatosis was based on liver imaging techniques. A mean liver/spleen density ratio < 1 on CT was diagnostic of hepatic steatosis. Steatosis manifests as increased echogenicity and beam attenuation on USG. Diffuse hepatic steatosis is graded on ultrasound as follows [13]:
Grade I: diffusely increased hepatic echogenicity but periportal and diaphragmatic echogenicity is still appreciable.
Grade II: diffusely increased hepatic echogenicity obscuring periportal echogenicity but diaphragmatic echogenicity is still appreciable.
Grade III: diffusely increased hepatic echogenicity obscuring periportal as well as diaphragmatic echogenicity.
Additional evaluations included DM, HT, hyperlipidemia, and osteoporosis commonly associated with CS. Thyroid-stimulating hormone (TSH), free thyroxine (fT4), free triiodothyronine (fT3), luteinizing hormone (LH), follicle-stimulating hormone (FSH), total testosterone (for men), or estradiol (for women) levels were measured. Insulin-like growth factor-1 (IGF-1) and growth hormone (GH) levels were assessed using the IMMULITE 2000 analyzer (Siemens, Los Angeles, CA). Laboratory and imaging results were collected from the time of CS diagnosis.
Calculations and definitions
Diagnostic criteria for MASLD:
MASLD is diagnosed based on the following criteria [5]:
Evidence of hepatic steatosis:
Presence of at least one of the following metabolic risk factors:
Overweight or obesity:
Type 2 diabetes mellitus (T2DM).
Metabolic dysregulation, including:
– Increased waist circumference (≥ 102/88 cm for Caucasians; ≥ 90/80 cm for Asians).
– Blood pressure ≥ 130/85 mm Hg or treatment for HT.
– Plasma TG ≥ 150 mg/dl (≥ 1.70 mmol/l) or on specific treatment.
– Low plasma HDL-C:
– Prediabetes (FPG 100–125 mg/dl, 2-hour post-load glucose 140–199 mg/dl, or HbA1c 5.7–6.4%).
– Homeostatic Model Assessment of Insulin Resistance (HOMA-IR) ≥ 2.5.
– Plasma high-sensitivity C-reactive protein (hs-CRP) > 2 mg/l.
Biomarkers can be measured using several technologies including glycomics, proteomics and/or metabolomics.
An HSI score > 36 was used as the cutoff for diagnosing hepatic steatosis.
A high FIB-4 score was defined as > 2 for patients aged > 60 years and > 1.3 for younger individuals.
APRI (AST-to-platelet ratio index) [16]:
An APRI threshold of 0.7 was used, with a sensitivity of 77% and specificity of 72% for diagnosing fibrosis [16].
Statistical analysis
Statistical analysis was conducted using SPSS for Windows software (SPSS Inc). Quantitative data are expressed as mean ± standard deviation (SD) or standard error (SE), and categorical data are expressed as percentages. Continuous variables were summarized using the median and range, while categorical variables were presented as frequencies and percentages. The chi-square (χ2) test was employed to compare categorical variables. Relations between the outcome variables and continuous variables were evaluated by univariate Pearson’s correlation coefficients or Spearman’s rank correlation, as appropriate. Cramér’s phi test was used to assess the association between two dichotomous variables. Statistical tests were two-sided, and significance was set at p < 0.05.
Results
One hundred sixteen patients were enrolled in the study from June 2019 to June 2021. After excluding 5 patients who did not provide informed consent and 10 patients who were not euthyroid, 101 patients (79.2% female, 19.8% male) were included (Figure 1). The mean age of the patients was 48.97 ±13.74 years (range: 18–76 years). The mean BMI of the patients was 28.97 ±7.65, ranging from 20.00 to 59.30 kg/m2(Table I).
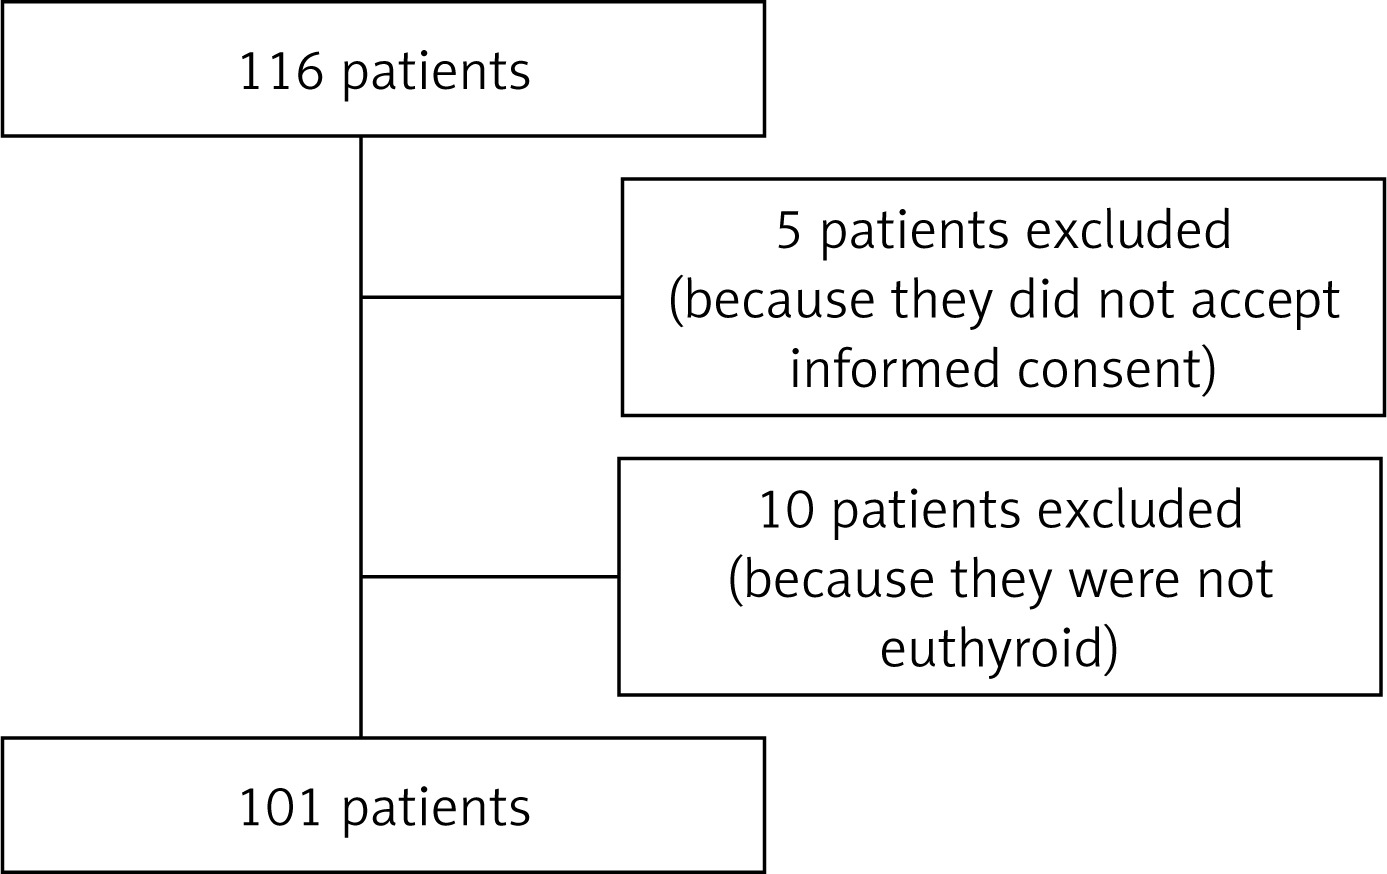
Table I
Characteristics of the cohort
Regarding the etiology of CS, 39.6% (n = 40) of patients had adrenocortical adenoma (ACA), while 60.4% (n = 61) were diagnosed with CD. Comorbidities associated with CS were observed in 72.3% (n = 73) of patients, including DM in 35.6% (n = 36), prediabetes in 1.0% (n = 1), HT in 51.5% (n = 52), hyperlipidemia (HL) in 24.8% (n = 25), and osteopenia/osteoporosis in 26.7% (n = 27) (Table I). All patients diagnosed with DM were using metformin. In addition to metformin, 3 patients used insulin, 4 used sodium-glucose cotransporter-2 inhibitors, 5 used gliclazide, and 5 used dipeptidyl peptidase inhibitors. Of the patients diagnosed with hyperlipidemia, 24 (96.0%) used statins, and 1 (1.0%) used fibrates. Among all the patients, 16 (15.8%) received acetylsalicylic acid, and 17 (16.8%) received levothyroxine sodium treatment.
The mean FPG, LDL-C, HDL-C, TG, ALT, AST levels and the mean platelet counts are shown in Table I. The mean HbA1c value of patients diagnosed with DM was 6.73 ±0.42%. All patients had a glomerular filtration rate (GFR) > 60 ml/min/1.73 m2 according to the Modification of Diet in Renal Disease (MDRD) equation [17]. Regarding thyroid function tests, the mean TSH level was 1.52 ±1.07 mIU/ml. The mean morning cortisol level was 19.44 ±10.17 µg/dl (Table II). All patients’ fT3 and fT4 levels were within the normal range. Testosterone, estradiol, prolactin, and IGF-1 values were normal.
Table II
Hepatic steatosis index results
Hepatosteatosis was detected using ultrasound in 63 (62.4%) patients. All of these 63 patients met MASLD criteria. Of those diagnosed with HS, 84.1% were female (n = 53) and 15.9% were male (n = 10). Grade 1 HS was detected in 33 (52.3%), grade 2 HS in 21 (33.3%), and grade 3 HS in 9 (12.8%). Eighty-six (85.14%) patients also had abdominal CT or MR. These imaging methods also detected the presence of HS in 23 (26.7%) of these 86 patients (Table I).
Among individuals with and without hepatic steatosis, diabetes mellitus and hypertension were significantly more common in those with HS. DM was present in 47.6% of individuals with HS compared to 15.8% without HS (p = 0.001). Similarly, HT was observed in 65.1% of individuals with HS, compared to 28.9% of those without HS (p < 0.001). In contrast, the prevalence of coronary artery disease (CAD) was similar between the two groups: 7.9% in the HS group and 5.3% in the non-HS group (p = 0.608).
When HSI was evaluated, 66 (65.3%) patients had HS (score > 36). It was consistent with the absence of HS (score < 30) in 9 (8.9%) patients. Twenty-six (25.7%) patients were in the gray zone. The mean HSI score was 41.04 ±9.66. When the HSI score of 63 patients with HS detected on ultrasound was examined, 58 (92.1%) were compatible with HS (score > 36), while 5 (7.9%) were detected in the gray zone (score 30–36). When the HSI scores of 38 patients in whom HS was not detected on ultrasound were examined, the scores of 9 (23.7%) were compatible with the absence of HS, the scores of 21 (55.3%) were compatible with the gray zone, and the scores of 8 were compatible with the presence of HS. Six of them were women, and 2 were men. The average BMI of these 8 patients was 28.97 ±6.78 kg/m2. Only 1 of them had DM (Table II).
When patients were grouped with an HSI score below and above 36, 58 (92.1%) of 66 patients with an HSI score > 36 had HS on ultrasound, while 30 (78.9%) of 35 patients with an HSI < 36 had no HS on ultrasound (p < 0.001, p < 0.001) (Table III). When the HSI cut-off was taken as 36, the sensitivity of HSI for HS was 92.1% (95% CI is 82.44% to 97.37%), the specificity was 78.9% (95% CI: 62.68% to 90.45%), the positive predictive value was 87.9%, and negative predictive value was 85.7% (Table IV).
Table III
Hepatic steatosis index (without gray zone) results
| HSI results (n = 101) HSI > 36 indicates presence of hepatosteatosis HSI < 36 indicates absence of hepatosteatosis | 66 (65.3%) patients score > 36 35 (34.7%) patients score < 36 | |||
| Comparing HSI with ultrasonography (when cutoff is 36) | HSI > 36 | HSI < 36 | P-value* | |
| USG positive | 58 (92.1%) | 5 (7.9%) | < 0.001 | |
| USG negative | 8 (21.1%) | 30 (78.9%) | < 0.001 | |
| HSI results (n = 101) HSI > 30 indicates presence of hepatosteatosis HSI < 30 indicates absence of hepatosteatosis | 72 (71.3%) patients score > 30 29 (28.7%) patients score < 30 | |||
| Comparing HSI with ultrasonography (when cutoff is 30) | HSI > 30 | HSI < 30 | P-value* | |
| USG positive | 63 (87.5%) | 0 | < 0.001 | |
| USG negative | 9 (12.5%) | 29 (100%) | < 0.001 | |
When patients were grouped with an HSI score below and above 30, 63 (87.5%) of 72 patients with an HSI score > 30 had HS on ultrasound, while 29 (100%) of 29 patients with an HSI < 30 had no HS on ultrasound (p < 0.001, p < 0.001) (Table III). When the HSI cut-off was taken as 30, the sensitivity of HSI for HS was 100% (95% CI is 94.31% to 100%), the specificity was 76.3% (95% CI: 59.76% to 88.56%), and the positive predictive value was 87.50%. The negative predictive value was 100% (Table IV).
Table IV
Hepatic steatosis index evaluation
Imaging methods detected no findings compatible with liver fibrosis in any patients. When the patients’ FIB-4 scores were examined, 94 (93.1%) were compatible with the absence of fibrosis, and 7 (6.9%) were compatible with the gray zone. When APRI scores were examined, 100 (99.0%) were compatible with the absence of fibrosis, and 1 (1.0%) was compatible with the gray zone. When APRI and FIB-4 scores were examined, no patient compatible with fibrosis was detected with either index.
When the factors associated with HS in CS were examined, it was correlated with BMI (p < 0.001, phi = 0.498), DM (p = 0.001, phi = 0.322), HT (p < 0.001, phi = 0.352), and HL (p < 0.001, phi = 0.398). HS was not correlated with low-dose DSTs (1 mg and 2 mg for 2 days) or 24 h UFC (p = 0.270, phi = 0.135; p = 0.452, phi = –0.089; p = 0.619, phi = 0.058). Also, it was not correlated with CS etiology (p = 0.690, phi = 0.040).
When the factors associated with HSI were examined, it was correlated with DM (p = 0.005, phi = 0.281), HT (p = 0.036, phi = 0.209) and HL (p = 0.006, phi = 0.273). HSI was not correlated with low-dose DSTs (1 mg and 2 mg for 2 days) or 24 h UFC (p = 0.224, phi = 0.14; p = 0.265, phi = –0.131; p = 0.772, phi = 0.003). Also, it was not correlated with CS etiology (p = 0.910, phi = 0.361).
Discussion
Our study is among the first to describe the characteristics of MASLD in endogenous CS and explore possible factors that may be associated with MASLD in CS. Additionally, our study is the first to evaluate the sensitivity and specificity of HSI in predicting MASLD in CS.
Glucocorticoids regulate energy balance, reproduction, growth, and immune responses. They promote lipolysis in adipose tissue and protein catabolism in muscles to provide glucose precursors for the liver, fueling brain activity. GC increases the release of FFAs into the circulation, which are then taken up by the liver, contributing to TG synthesis and HS. The effects of GC are mediated through glucocorticoid receptors (GR). Higher GR expression in CS can increase GC availability in the liver. The activity of enzymes such as 11β-HSD1 (which regenerates cortisol) and 5α-reductase (which inactivates cortisol) influences local GC actions in tissues such as the liver and adipose tissue. Increased 11β-HSD1 activity and decreased 5α-reductase activity may contribute to the development of MASLD in CS.
Currently referred to as MASLD, this condition – previously known as metabolic-associated fatty liver disease (MAFLD) and NAFLD – is the most common liver disease worldwide, with an estimated prevalence of 39.22% globally [18–20]. There are few studies about endogenous CS and MASLD. Rockall et al. evaluated the prevalence of MAFLD by CT; MAFLD was present in 20% of the CS patients [20]. A Chinese retrospective study that enrolled CS patients found that 27.4% had HS [21]. Marengo et al. evaluated HS in 49 CS patients with CT and found HS in 26.5% [22]. Our study detected HS in 62.4% of the patients in ultrasound. The high prevalence may indicate a causal link between cortisol dysregulation and liver fat accumulation. Interestingly, the incidence of HS detected by CT was notably lower in CS patients compared to the general population, emphasizing the importance of considering specific diagnostic tools tailored to CS patients due to potential differences in disease manifestation.
Auer et al. investigated biochemically controlled patients with CD using the fatty liver index (FLI) [23]. The FLI was not significantly elevated in patients with controlled CD compared to patients with non-functioning pituitary adenomas. In addition, patients with a higher FLI received a significantly higher daily hydrocortisone dosage than those with a lower index. This suggests that oral hydrocortisone replacement therapy in these patients resulted in a higher hepatic hydrocortisone exposure since it entered the portal circulation, in contrast to subjects with normal adrenal function, where cortisol was directly secreted from the adrenals into the systemic circulation. Therefore, the relationship between MASLD and endogenous versus exogenous CS may have different pathogenetic mechanisms and consequences. Most studies evaluated the relationship between exogenous CS and MAFLD. These studies showed that patients receiving high doses of GC developed severe NAFLD. In addition, exposure to high doses of GC (greater than 10 g prednisolone) induced severe simple steatosis in 29% of patients, whereas those exposed to lower doses showed a lower incidence [24, 25].
MASLD is closely linked to metabolic disturbances, including obesity, type 2 DM, dyslipidemia, and metabolic syndrome (MetS). Our study also showed that MASLD was correlated with BMI, DM, HT, and HL in patients with CS, similar to the literature examining MASLD in the general population [26]. Zhou et al. reported that fatty liver was more frequent in patients with CD than those with ACA [21]. However, our study did not detect differences in MASLD according to the etiology of CS.
The HSI has emerged as a promising diagnostic tool for MASLD in CS patients. HSI demonstrated high sensitivity and specificity, mainly when using a cutoff value of 30, suggesting its utility in identifying HS in this population. These findings highlight the clinical relevance of HSI as a non-invasive and cost-effective tool for assessing hepatic steatosis in CS patients. BMI, DM, HT, and HL significantly correlated with HS and HSI scores. These associations underscore the complex interplay between metabolic factors and hepatic lipid metabolism in CS-related MASLD. In the study of Targher et al., 24-hour UFC and DST were correlated with hepatic necroinflammatory grade and fibrosis [27]. However, in our study, low-dose DSTs and 24-hour UFC levels did not correlate significantly with HS or HSI scores, suggesting that other metabolic factors may be more significant in driving hepatic lipid accumulation in CS patients. Similarly, no differences in morning cortisol and 24-hour UFC between MAFLD and non-MAFLD groups in patients with CD were found in the Zhou et al. study [21].
Moreover, the study assessed hepatic FIB-4 score and APRI in CS patients. Interestingly, no evidence of liver fibrosis was found in any of the patients, suggesting that fibrosis may not be a prominent feature of MASLD in CS patients, at least in the absence of other comorbidities or prolonged disease duration.
While our study provides valuable insights into the relationship between CS and MASLD, several limitations should be considered. The study’s retrospective design and reliance on data from a single center may limit the generalizability of the findings. Variations in patient demographics, clinical practices, and diagnostic criteria across different healthcare settings could influence the results. Due to the study’s retrospective nature, waist circumference measurements of some patients were unavailable, so we could not make comparisons with other indexes, such as the fatty liver index. Likewise, due to the retrospective nature of our study, we were unable to assess whether excessive fat accumulation occurred in other organs, such as the epicardium or pancreas. This issue may provide valuable insights for future studies in this area. Despite its limitations, this study also possesses several strengths. This study represents one of the first investigations into the prevalence and diagnostic approaches of endogenous CS and MASLD. The study employed a comprehensive approach to evaluate MASLD in CS patients, incorporating clinical, biochemical, and imaging data. The findings of this study have significant clinical relevance, emphasizing the importance of early detection and management of MASLD in CS patients. By elucidating the prevalence and associated factors of MASLD in this population, the study informs clinical practice and underscores the need for tailored diagnostic and therapeutic strategies.
In conclusion, our study sheds light on the intricate relationship between endogenous CS and MASLD. The findings highlight the high prevalence of HS in CS patients and emphasize the need for tailored diagnostic approaches to accurately identify hepatic lipid accumulation in this population. HSI is a promising non-invasive tool for diagnosing MASLD in CS patients, offering high sensitivity and specificity. Our study fills a significant gap in the literature by being the first to investigate the predictive power of HSI for MASLD diagnosis, specifically in CS patients. Future studies should explore therapeutic interventions targeting metabolic factors implicated in CS-related MASLD, ultimately improving patient outcomes and quality of life.