Introduction
Oral cavity cancer is a significant global health concern, with squamous cell carcinoma (SCC) being the predominant histological type, primarily linked to tobacco and alcohol use [1, 2]. Oral SCC (OSCC) often presents at advanced stages despite relative ease of early detection, and has a higher male prevalence with poorer prognosis [3–5]. However, its complete etiology and full risk factor spectrum remain incompletely understood, demanding further research into underlying mechanisms for improved diagnosis and treatment [6].
Sex hormones influence various neoplasms, including breast, prostate, and cervical cancers [7–9], and emerging evidence suggests their potential role in oral cavity cancer. For instance, elevated estradiol levels have been observed in OSCC patients, independent of sex [10]. Nevertheless, the precise role of hormone receptors, including androgen and estrogen receptors (ERα, ESRβ, GPR30) in oral and salivary gland cancers is complex and not fully established. Studies in oral squamous cell carcinoma and salivary gland tumors have reported controversial or varied expression patterns and associations, differing from classical hormone-dependent cancers, underscoring the complexity of their carcinogenic role [11–13]. The causal relationship between systemic sex hormones and oral cavity cancer thus remains a critical knowledge gap.
Mendelian randomization (MR) uses genetic variants as instrumental variables to infer causality [14], mitigating confounding and reverse causation inherent in observational studies [15–17], thereby offering valuable etiological insights.
To address the existing uncertainty and provide novel insights from a genetic perspective, this study aimed to employ a two-sample MR approach to investigate the potential causal effects of genetically predicted levels of total testosterone (TT), sex hormone-binding globulin (SHBG), estradiol (E2), estrogen receptor (ESR), estrogen sulfotransferase (EST), and breast cancer anti-estrogen resistance protein 3 (BCAR3) on the risk of oral cavity cancer.
Material and methods
Study design
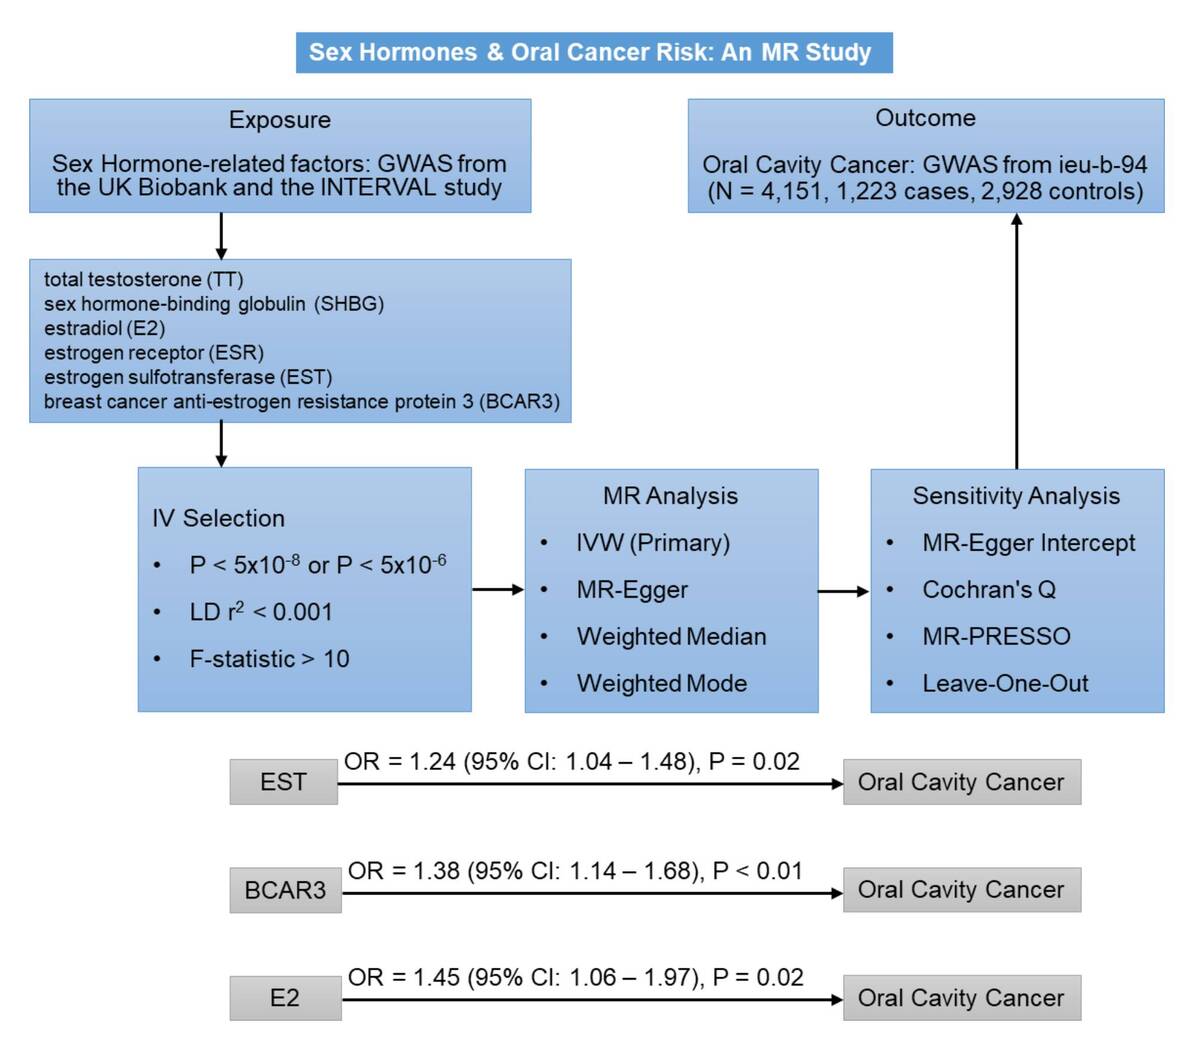
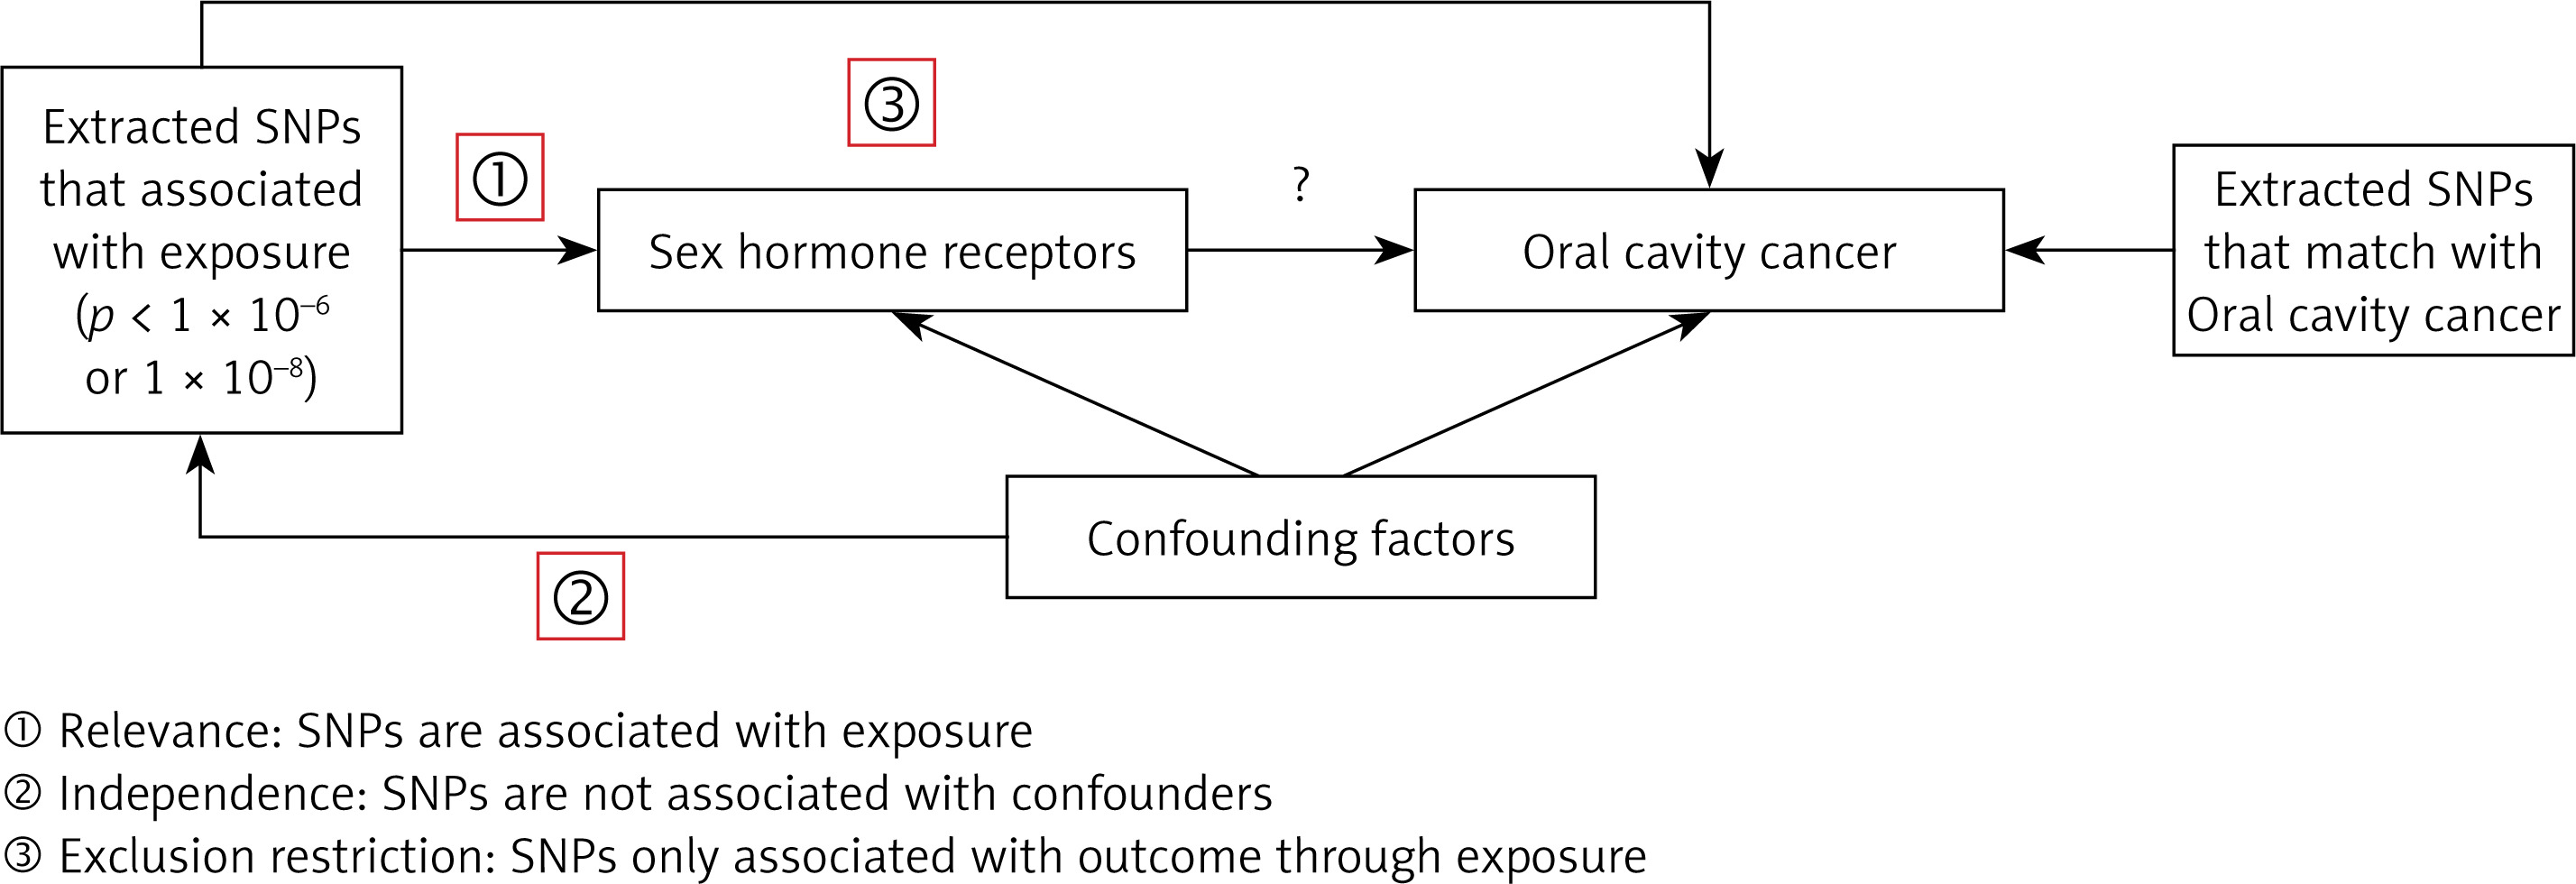
The exposures analyzed in this study included TT, SHBG, E2, ESR, EST, and BCAR3. The primary outcome of interest was oral cavity cancer. Our MR analysis is based on three key assumptions: (1) instrument variables (IVs) have a direct and meaningful relationship with the exposure, (2) IVs are not associated with any confounders, and (3) IVs affect the outcome exclusively through their association with the exposure [18, 19]. An overview of the study design is shown in Figure 1. Data were sourced from previously published studies, all of which had obtained ethics approval; no additional approval was required.
Figure 1
Study design for the two-sample Mendelian randomization analysis. This schematic illustrates the overall workflow, including the selection of genetic variants (single nucleotide polymorphisms – SNPs) as instrumental variables (IVs) for sex hormone-related exposures, and their use to estimate the causal effect on oral cavity cancer. The three core assumptions of MR (relevance, independence, and exclusion restriction) are also depicted
Data source
Summary-level data from GWAS were used for all exposures and the outcome. All participants in the source GWASs were of European descent. The GWAS data for the outcome, oral cavity cancer (GWAS ID: ieu-b-94; N = 4,151, 1,223 cases, 2,928 controls; 7,510,833 SNPs), were obtained from the IEU OpenGWAS project (https://gwas.mrcieu.ac.uk/). This dataset originates from a large-scale meta-analysis by the Oncoarray oral cavity and oropharyngeal cancer consortium [20]. While the broader consortium study included various head and neck cancer sites, the ieu-b-94 dataset specifically pertains to cancers of the oral cavity, primarily defined by the International Classification of Diseases (ICD) codes C02.0-C02.9, C03.0-C03.9, C04.0-C04.9, and C05.0-C06.9 [20].
For the exposures, GWAS summary statistics for TT (GWAS ID: GCST90012114; N = 425,097) and SHBG (GWAS ID: GCST90012111; N = 370,125) were derived from a study published in Nature Medicine (Ruth et al., 2020) [21], and summary statistics for E2 (GWAS ID: GCST90020091; N = 147,690) were derived from a study published in Journal of Clinical Endocrinology & Metabolism (Schmitz et al., 2021) [22]. Both of these source studies for TT, SHBG, and E2 used data from the UK Biobank. Summary statistics for ESR (GWAS ID: prot-a-991; N = 3,301), EST (GWAS ID: prot-a-2892; N = 3,301), and BCAR3 (GWAS ID: prot-a-234; N = 3,301) were obtained from a study published in Nature (Sun et al., 2018), which used data from the INTERVAL study, a genomic bioresource of blood donors in England [23]. All exposure data were also accessed via the IEU OpenGWAS database. Detailed information is provided in Supplementary Table SI.
Instrumental variables
In this study, inclusion of IVs was guided by the following criteria: 1) SNPs demonstrating a significant association with E2 were identified (p < 5 × 10⁻⁸) [24]. SNPs significantly associated with TT, SHBG, ESR, EST, and BCAR3 were chosen using a threshold of p < 5 × 10⁻⁶ due to the limited number of SNPs [25]. 2) SNPs exhibiting a minor allele frequency (MAF) greater than 0.01 [24]. 3) Linkage disequilibrium (LD) was eliminated based on an R2 threshold of < 0.001 and a window size of 10,000 kb [26]. 4) In instances where selected IVs were absent in the summary data for the outcome, high-LD (R2 > 0.8) SNPs serving as proxies were sought and substituted [27]. 5) The F-statistic was computed for each SNP within the IV to assess the strength of each IV and mitigate potential weak instrument bias between the IV and the exposure; the formula for the calculation of F-statistic was: F = R2 × (N – 2)/(1 – R2), where R2 represents the proportion of variance in the exposure explained by the SNPs in the IV. An F-value greater than 10 was considered a requirement for inclusion [28].
MR analysis
The inverse variance weighted (IVW) method was used as the primary analytical approach, using odds ratios (ORs) and their corresponding 95% confidence intervals (CIs) to assess the causal relationship between hormones and the risk of oral cavity cancer [29]. The IVW method, being the predominant method for interpreting MR results, calculates the weighted average of effect sizes by assigning weights proportional to the inverse variance of each SNP [29]. Additionally, the robustness of the findings was assessed using MR-Egger, weighted median, and weighted mode methods [30–32]. The MR-Egger approach accounts for the presence of an intercept, allowing for accurate causal effect estimation even in the presence of pleiotropic bias [30]. The weighted median method assumes that half of the instrumental variables are valid and investigates the causal effect of the exposure on the outcome [32]. The weighted mode approach estimates the causal effect of the subset with the greatest number of SNPs by clustering the SNPs into subsets based on the similarity of causal effects [31]. All analyses in this study were conducted using the “TwoSampleMR” package in R software (version 4.0.5) [24]. Visual representations of the data were generated via scatter plots and sensitivity analysis graphs.
Sensitivity analysis
In this study, we employed Cochran’s Q test to detect heterogeneity among the IVs [33]. A p-value less than 0.05 was regarded as significant heterogeneity. Considering the impact of genetic pleiotropy on the estimation of association effects, we adopted the MR-Egger regression technique and the MR Pleiotropy Residual Sum and Outlier (MR-PRESSO) approach to probe for horizontal pleiotropy [34, 35]. An intercept close to zero or statistically insignificant in the MR-Egger regression would indicate the absence of directional pleiotropy [34]. Furthermore, we used the MR-PRESSO approach to identify and remove possible outliers (SNPs with p < 0.05), and then re-estimated the causal effect to account for horizontal pleiotropy [35]. To ensure the robustness of our results, we conducted a leave-one-out sensitivity analysis, iteratively removing each IV and recalculating the effect size to evaluate the influence of individual IVs on the overall MR estimates [36].
Results
Inclusion of IVs
For MR analysis with TT, E2, SHBG, ESR, EST, and BCAR3 as the exposure, 180, 15, 396, 9, 16, and 9 relevant IVs were selected. The F-statistics ranged as follows: 29.22 to 1409.01, 30.25 to 269.83, 23.58 to 1457.55, 21.48 to 23.30, 18.3 to 164.57, and 20.95 to 334.57, respectively. All individual F-statistics were greater than the conventional threshold of 10, indicating that the selected IVs were sufficiently strong and thus less likely to suffer from weak instrument bias. Detailed information regarding the selected SNPs for each exposure, including their effect alleles, effect sizes, and standard errors, is provided in Supplementary Table SII.
MR analysis of sex hormones and oral cavity cancer risk
The primary MR analysis using the IVW method showed significant associations between EST (OR = 1.24, 95% CI: 1.04–1.48, p = 0.02), BCAR3 (OR = 1.38, 95% CI: 1.14–1.68, p < 0.01) and oral cavity cancer (Table I, Figures 2 and 3). In contrast, the IVW analysis did not identify significant causal relationships for genetically predicted levels of TT (OR = 1.17, 95% CI: 0.53–2.60, p = 0.70), initial E2 analysis (OR = 1.21, 95% CI: 0.84–1.74, p = 0.30), ESR (OR = 1.31, 95% CI: 0.94–1.83, p = 0.11), or SHBG (OR = 0.89, 95% CI: 0.50–1.58, p = 0.69) with the risk of oral cavity cancer (Table I). The results from complementary MR methods, including MR-Egger, weighted median, and weighted mode, are also shown in Table I. For EST and BCAR3, the direction of effect was largely consistent across these sensitivity methods, although not all reached statistical significance, which can be expected given their different underlying assumptions and statistical power.
Table I
Associations between genetically predicted levels of sex hormones and risk of developing oral cavity cancer
Figure 2
Scatter plots illustrating the causal association between genetically predicted sex hormone levels and oral cavity cancer risk. A – EST; B – BCAR3; C – E2; D – E2 (adjusted). Each point represents a single instrumental SNP, with the x-axis showing the SNP effect size on the respective exposure (EST, BCAR3 and E2) and the y-axis showing the SNP effect size on oral cavity cancer. The slopes of the fitted lines represent the causal estimate from different MR methods: inverse variance weighted (IVW), MR-Egger, weighted median, and weighted mode. A steeper slope indicates a larger estimated causal effect
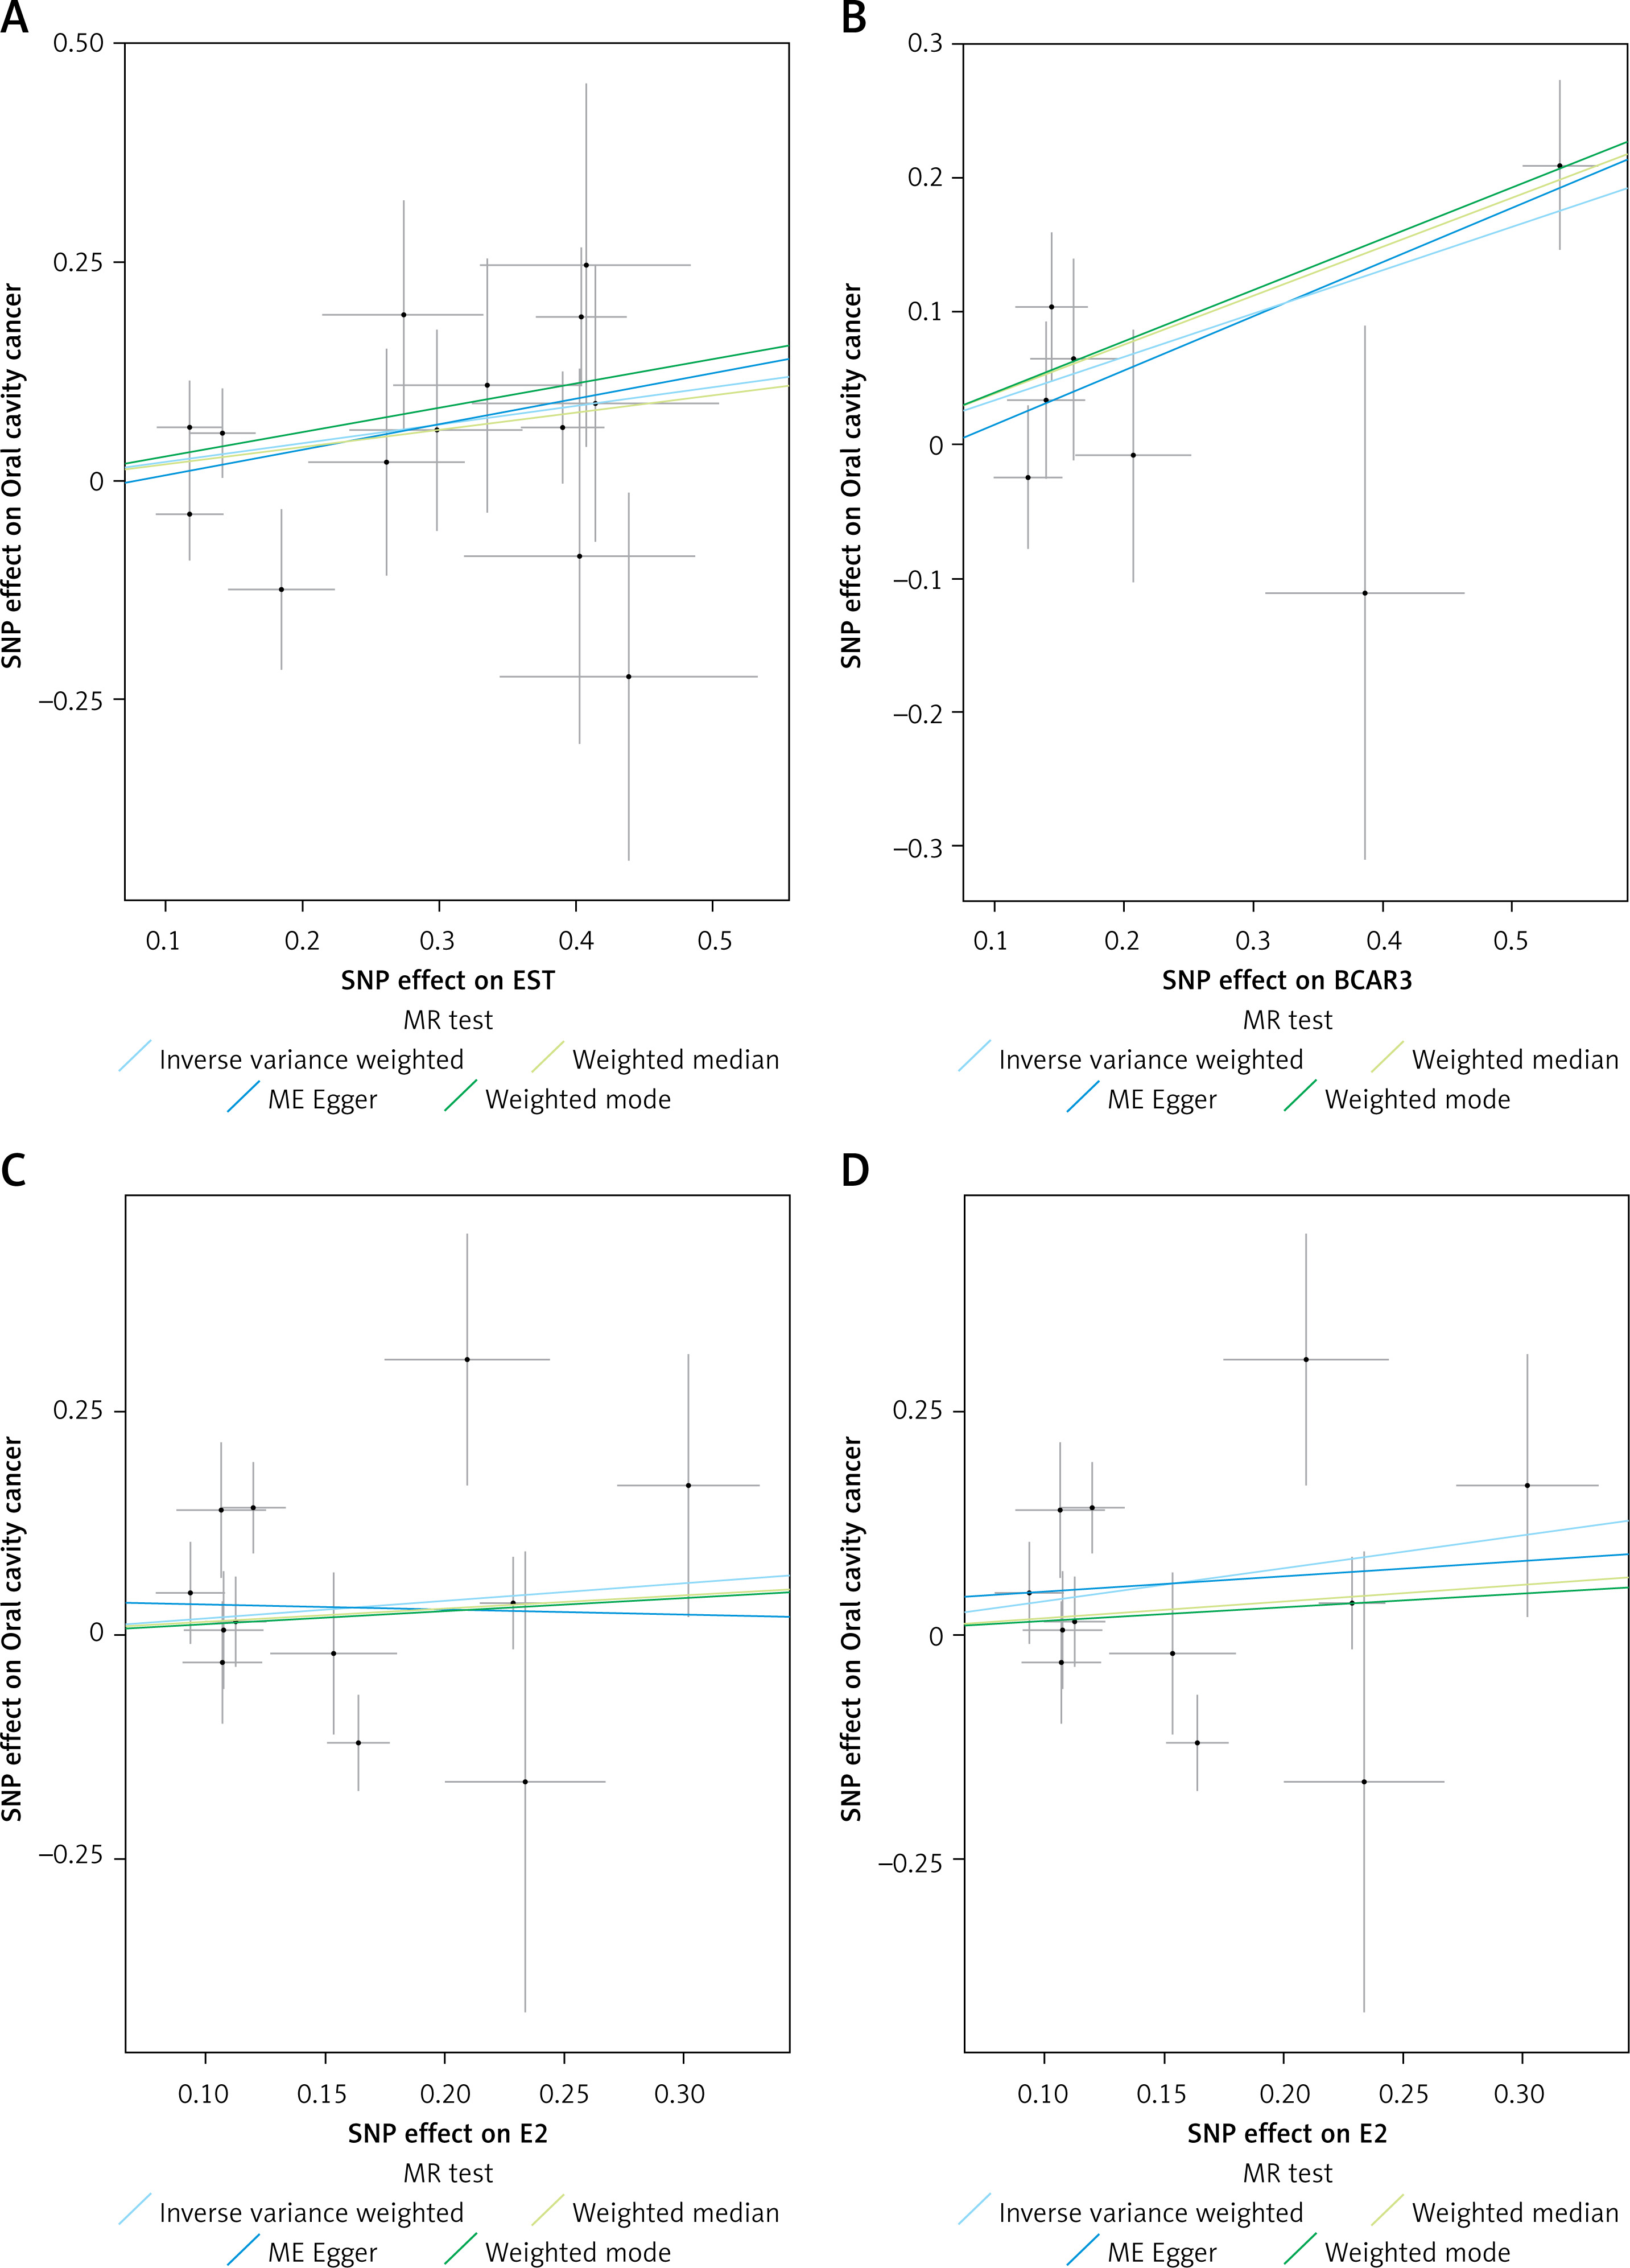
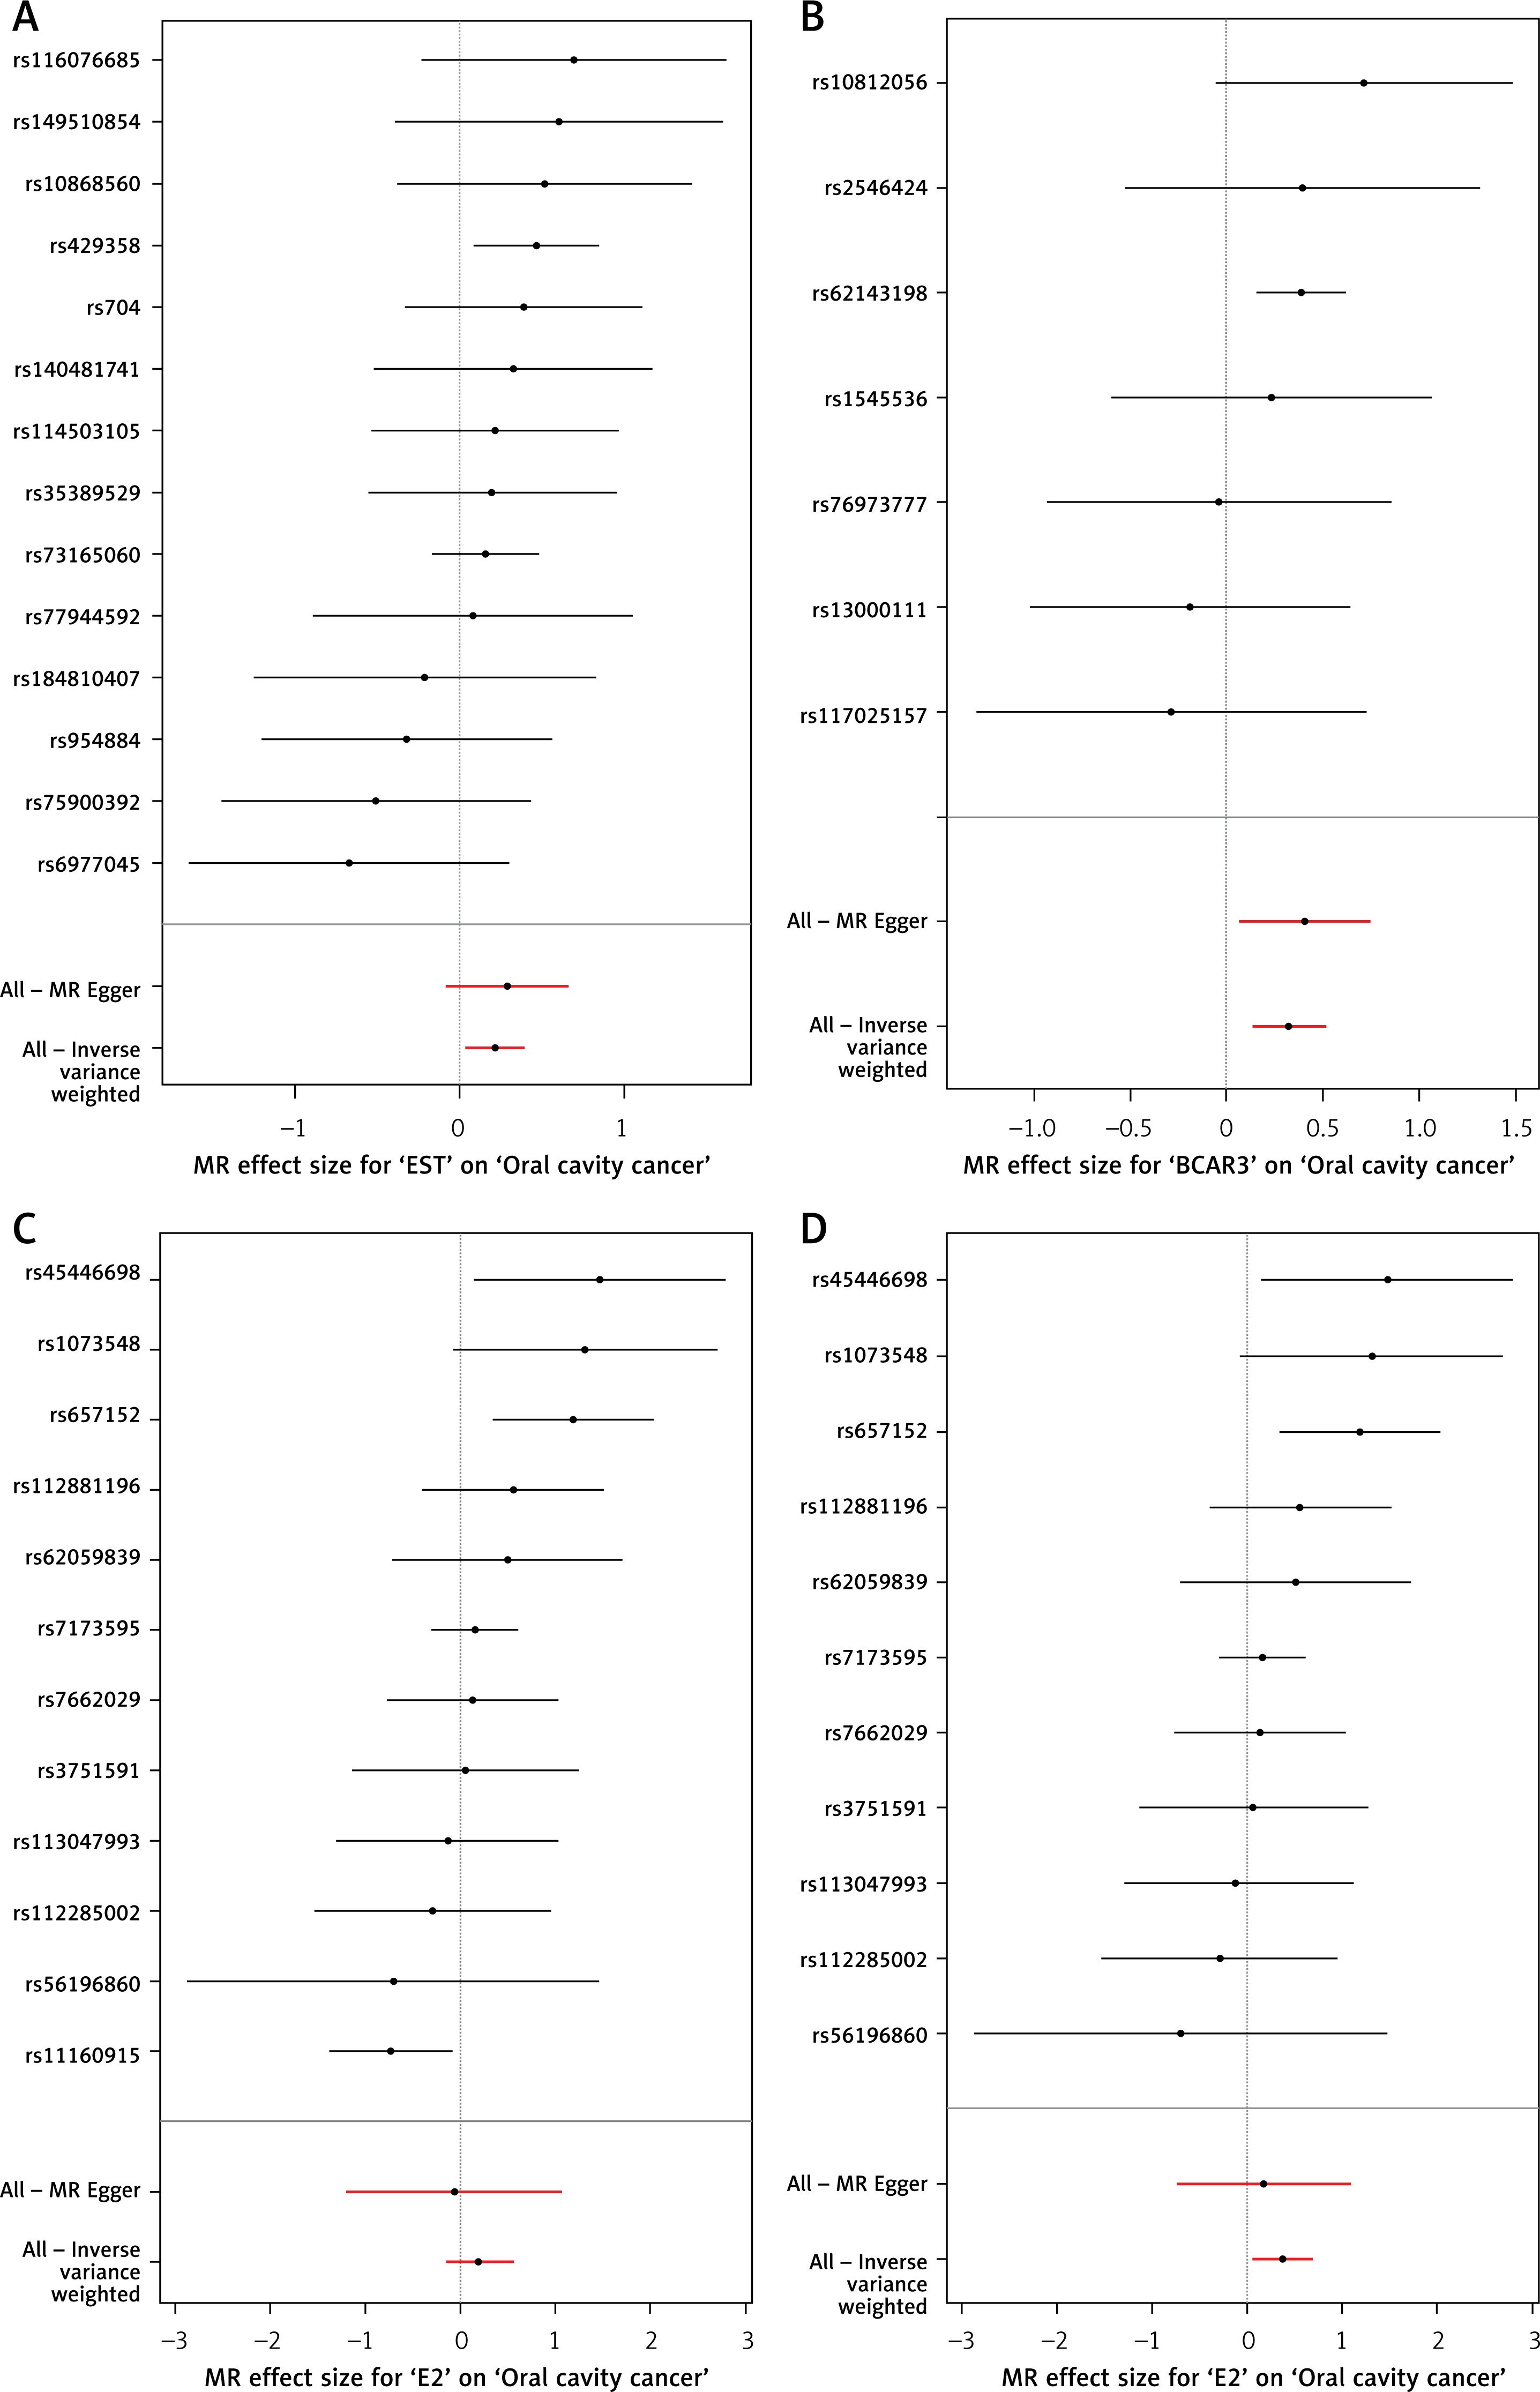
Figure 3
Forest plots of the Mendelian randomization estimates for the association between sex hormones and oral cavity cancer. A – EST; B – BCAR3; C – E2; D – E2 (adjusted). Each horizontal black line represents the causal effect estimate (odds ratio and 95% confidence interval) of an individual SNP on oral cavity cancer for the respective exposure (EST, BCAR3 and E2). The red horizontal lines at the bottom represent the overall causal estimates derived from the IVW method and the MR-Egger method, respectively, with their 95% confidence intervals. The vertical dashed line indicates an odds ratio of 1 (no effect)
Notably, sensitivity analyses indicated the presence of an outlier SNP for E2. After removing one outlier SNP (rs11160915), a significant association was found between E2 and oral cavity cancer (OR = 1.45, 95% CI: 1.06–1.97, p = 0.02) (Table I, Figures 2 and 3).
Sensitivity analysis
Sensitivity analyses were performed to assess the robustness of our findings. For E2, Cochran’s Q test indicated significant heterogeneity among the IVs (Q = 21.594, p = 0.028). However, after removing the outlier SNP (rs11160915) identified by MR-PRESSO, heterogeneity was no longer significant in the adjusted analysis (Q = 12.22, p = 0.271). No significant heterogeneity was observed for EST (p = 0.554), BCAR3 (p = 0.570), ESR (p = 0.891), or SHBG (p = 0.135) (Supplementary Table SIII).
The MR-Egger intercept test showed no evidence of directional horizontal pleiotropy for any of the exposures, as all intercepts were close to zero and non-significant (all p > 0.05) (Supplementary Table SIII).
The MR-PRESSO test was employed to detect and correct for potential horizontal pleiotropy by identifying outlier SNPs (Supplementary Table SIV). One outlier SNP (rs11160915) was identified for E2 (Global p = 0.039). After correcting for this outlier, the association between E2 and oral cavity cancer became statistically significant (OR = 1.445, 95% CI: 1.058–1.974, p = 0.043), and this adjusted estimate was used in subsequent analyses (Table I). For TT, one outlier SNP (rs9272309) was detected (Global p = 0.019); however, the corrected association remained non-significant (OR = 0.963, 95% CI: 0.450–2.060, p = 0.923). No significant outliers were found for BCAR3, EST, ESR, or SHBG (all Global p > 0.05) (Supplementary Table SIV).
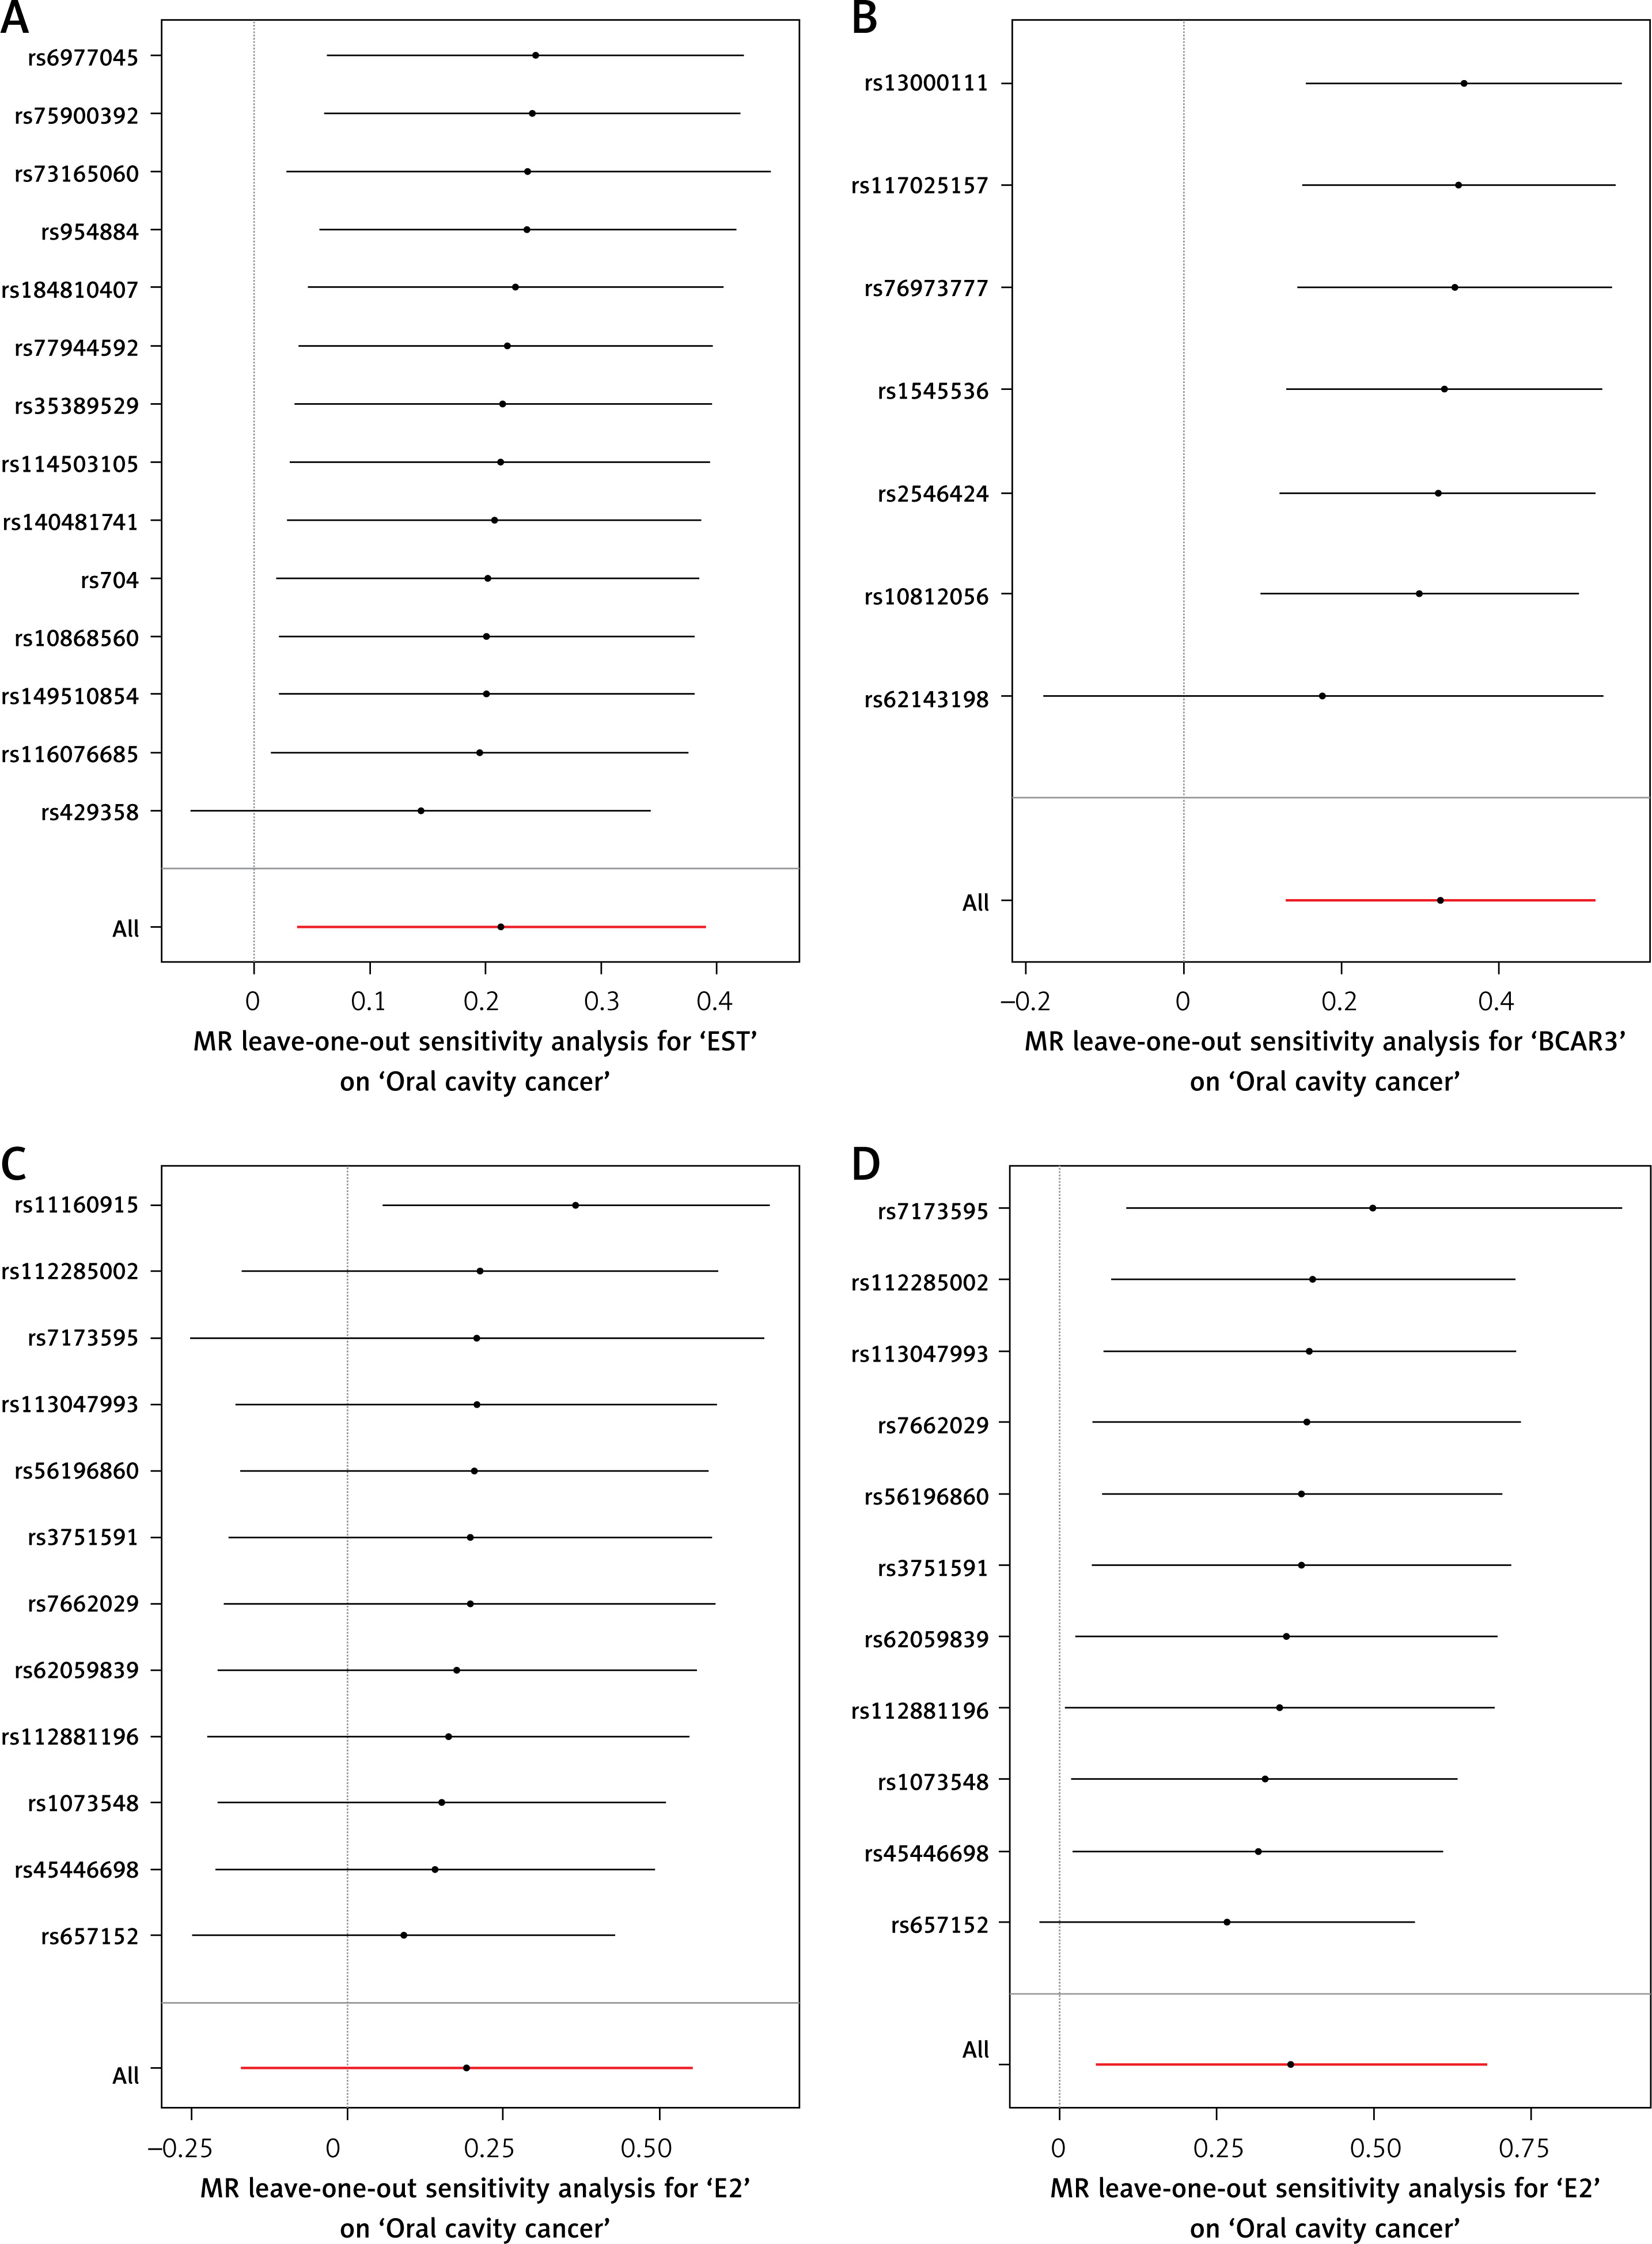
Leave-one-out sensitivity analyses confirmed that no single instrumental variable disproportionately influenced the overall causal estimates for EST, BCAR3, or adjusted E2, further supporting the robustness of these associations (Figures 4 and 5).
Figure 4
Funnel plots for assessing small-study bias or directional pleiotropy in the Mendelian randomization analyses. A – EST; B – BCAR3; C – E2; D – E2 (adjusted). For each exposure (EST, BCAR3 and E2), the plot displays the causal effect estimate of individual SNPs (x-axis) against their precision (1/standard error, y-axis). In the absence of bias or pleiotropy, the points are expected to form a symmetrical inverted funnel shape around the summary estimate
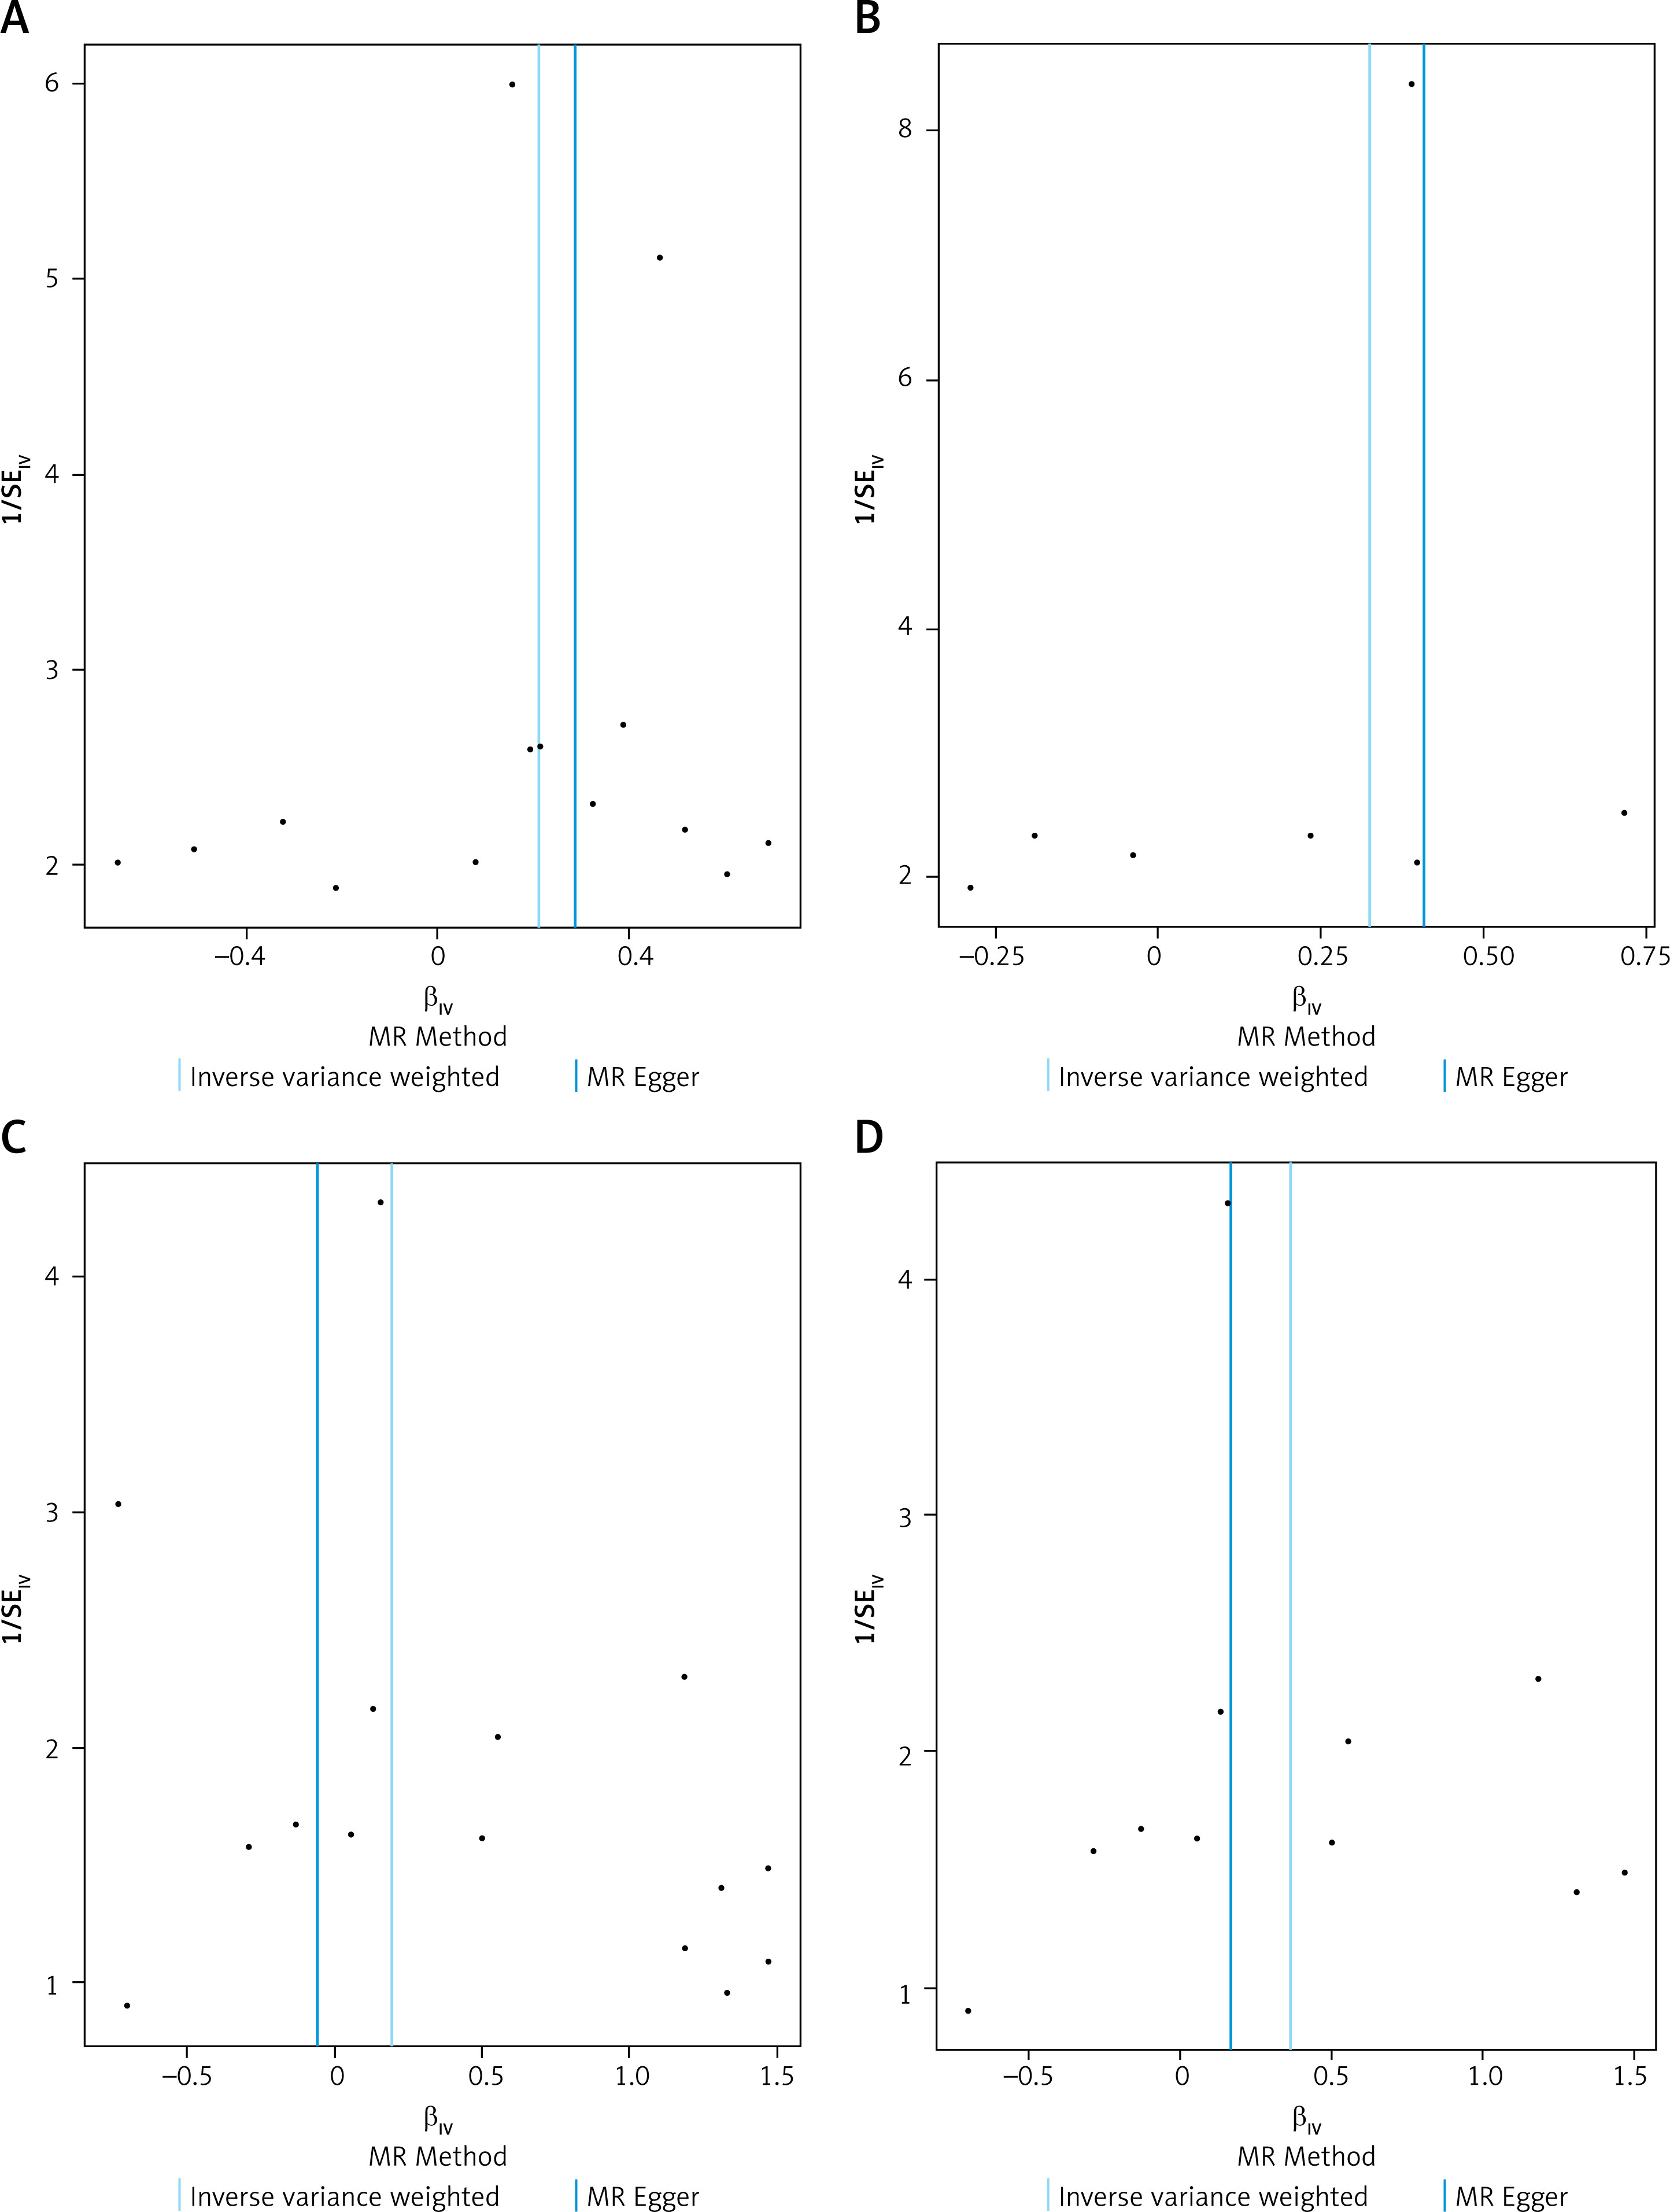
Figure 5
Leave-one-out sensitivity analysis plots for the association between sex hormones and oral cavity cancer. A – EST; B – BCAR3; C – E2; D – E2 (adjusted). For each exposure (EST, BCAR3 and E2), the plot displays the causal effect estimate of individual SNPs (βIV, x-axis) against the inverse of their standard error (1/SEIV, y-axis). Each black point represents an individual SNP. In the absence of bias, the points are expected to form a symmetrical inverted funnel shape. The vertical solid lines indicate the overall causal estimates from the IVW method and the MR-Egger method
Discussion
The current MR study investigated the relationship between sex hormones – TT, E2, SHBG, ESR, EST, and BCAR3 – and oral cavity cancer. Results of the MR estimates revealed that levels of E2, EST, and BCAR3 were risk factors for the development of oral cavity cancer.
Our MR estimates provided evidence suggesting that genetically predicted higher levels of E2 (after outlier removal), EST, and BCAR3 are associated with an increased risk for the development of oral cavity cancer.
17β-estradiol (E2) is a primary estrogen that exerts its effects primarily by binding to the estrogen receptor (ER) [37]. Previous studies have reported associations between estradiol levels and cancer development, including OSCC. For instance, Thakare et al. found that serum estradiol levels were significantly elevated in patients with OSCC compared to controls, suggesting a potential role for E2 in tumor progression [10]. Furthermore, estrogen receptor expression has been linked to anoikis resistance and invasion in squamous cell carcinoma, indicating that E2 may influence cancer cell behavior by modulating these pathways [38]. Our MR findings lend genetic support to the hypothesis that higher E2 levels may contribute to an increased risk of developing oral cavity cancer. Supporting this, tamoxifen, an ER antagonist, has been shown to enhance cytotoxicity and apoptosis in OSCC cells when combined with chemotherapy [39]. Therefore, it is plausible that higher E2 levels, through ER activation, lead to enhanced cellular proliferation and reduced apoptosis, thereby promoting tumor growth [40]. Additionally, the pro-inflammatory properties of E2 could further exacerbate this risk by fostering a microenvironment conducive to cancer progression [41].
EST, a member of the sulfotransferase family (SULTs), also known as SULT1E1, is a key enzyme in estrogen metabolism, catalyzing the sulfation and thereby inactivation of estrogens [42, 43]. While direct evidence linking EST levels to oral cavity cancer risk is limited, its involvement in other hormone-related cancers, such as breast, endometrial, and ovarian cancer, has been demonstrated, with genetic polymorphisms in the SULT1E1 gene influencing susceptibility [42, 44, 45]. In the context of oral cavity cancer, our finding of a positive association between genetically predicted EST levels and cancer risk is intriguing. One hypothesis could be that elevated systemic EST levels might reflect a compensatory upregulation in response to high local estrogen activity, stimulating cell proliferation and potentially facilitating carcinogenesis. Similarly, we investigated BCAR3, a signaling adapter protein crucial for cell motility and hormone resistance [46, 47]. While direct evidence linking BCAR3 to oral cavity cancer is limited, its established role in breast cancer, especially in modulating ER signaling and contributing to anti-estrogen resistance, offers insights into potential mechanisms [48]. Our MR study linked higher genetically predicted BCAR3 levels to increased oral cavity cancer risk. This suggests that BCAR3 may also modulate estrogen-related pathways in oral cancer, potentially by enhancing ER activity through interactions with BCAR1 and activation of c-Src, PI3K/AKT, and ERK1/2 pathways, as seen in breast cancer [47]. Furthermore, studies have demonstrated that estrogen can affect the oral microenvironment by influencing epithelial cell proliferation and inflammation, which are critical factors in cancer development [49]. It is plausible that increased BCAR3 activity could contribute to a microenvironment conducive to carcinogenesis through such estrogen-related pathways. These potential mechanisms warrant further investigation.
The findings of this study have several potential clinical implications. The identification of genetically predicted higher levels of E2, EST, and BCAR3 as risk factors for oral cavity cancer suggests that these molecules could serve as potential biomarkers for risk stratification or early detection, although this requires substantial further validation. If these causal relationships are confirmed, interventions targeting these hormonal pathways might offer novel avenues for the prevention or treatment of oral cavity cancer. For example, modulating estrogen activity or the pathways influenced by EST and BCAR3 could be explored as therapeutic strategies, particularly in susceptible individuals. However, translating these MR findings into clinical practice will necessitate a deeper understanding of the underlying biological mechanisms and rigorous clinical trials.
In this study, genetically predicted levels of TT, SHBG, and ESR were not found to be causally related to oral cavity cancer. This could be due to the complex interplay between different hormones and their receptors, or the involvement of alternative pathways such as inflammation, oxidative stress, and DNA damage repair mechanisms, which might mask or supersede the effects of these specific hormones in oral carcinogenesis. It underscores the need for larger and more diverse studies, potentially employing advanced multi-omics technologies, to further clarify the comprehensive role of sex hormones in oral cancer.
To our knowledge, this is the first MR study to explore the causal relationship between sex hormones and oral cavity cancer. The strengths of our study include the application of an MR design, which minimizes confounding and reverse causation inherent in observational studies, the use of multiple MR techniques to validate findings, and comprehensive sensitivity and heterogeneity tests to ensure the reliability of the results.
Nonetheless, several limitations of this study should be acknowledged. First, the GWAS summary data used in this study were exclusively derived from European populations, limiting the generalizability of our findings to other ethnic groups. Second, the genetic instruments used in our study may not fully capture the complexity of sex hormone levels, limiting the precision of our estimates. For instance, GWAS for hormone levels often reflect circulating levels, which may not perfectly represent tissue-specific hormonal action in the oral cavity. Third, our analyses assume linear relationships between genetically predicted hormone levels and oral cancer risk; non-linear effects might not be fully captured. Fourth, the GWAS data for some exposures, particularly the proteins, were derived from smaller sample sizes than those for the hormones, which could affect the statistical power and the robustness of IVs. Finally, although we observed statistically significant associations, the biological mechanisms linking levels of E2, EST, and BCAR3 to oral cavity cancer require further experimental validation to confirm causality and elucidate the precise pathways involved.
In conclusion, our two-sample MR study provides evidence suggesting potential causal associations between genetically predicted elevated levels of E2, EST, and BCAR3 and an increased risk of oral cavity cancer. These findings highlight these factors as potentially important in oral cancer pathogenesis and suggest that they could be explored as biomarkers or therapeutic targets. However, these findings should be interpreted with caution due to the acknowledged limitations, including the European-centric nature of the data and the need for further mechanistic understanding. Future research, including functional studies to elucidate biological pathways, validation in diverse populations, and investigation into a broader array of related biomarkers, is essential to confirm these results and explore their full implications for the prevention and treatment of oral cavity cancer.