
Introduction
Ovarian cancer (OC) ranks among the three most prevalent cancers affecting the female reproductive system [1]. In the year 2020, 313,959 new OC cases were diagnosed worldwide, equivalent to an age-standardized incidence rate (ASR) of 6.6 cases per 100,000 population. The regions with the highest reported incidence rates include Central and Eastern Europe, where the ASR is notably elevated at 10.7. Northern Europe, which has an ASR of 8.8, follows closely [2]. Currently, several molecular biomarkers, such as CA125 and HE4, are used for ovarian cancer screening and monitoring. However, their sensitivity, specificity, and applicability have certain limitations, and their performance in early OC screening remains suboptimal. Because early diagnostic indicators and symptoms are lacking, most OC patients are diagnosed at advanced stages [3, 4]. Current molecular strategies to prevent ovarian cancer include the use of oral contraceptives to reduce OC risk, the role of genetic testing (BRCA1/2 mutations), and ongoing research on targeted therapies aimed at preventing the progression of high-risk ovarian lesions. However, all have significant limitations. In addition, OC is a multifaceted process that involves many variables, creating a major public health problem.
According to previous studies, the development of OC is associated with genetic factors [5], estrogen levels [6], age [7], abnormal gene splicing [8], and metabolic disorders [9], which are considered important contributors, and the progression of OC may be due to combined effects. Metabolic disorders are important factors in the development and progression of many diseases [10–12]. Metabolic disorders, as one of the hallmark features of cancer, also are the key to OC; for example, Zhou [13] reported significant differences in the metabolites of histamine, purine nucleotides, glycine, serine, and sarcosine, along with the overexpression of alanine, cysteine, and glycine in serum samples by mass spectrometry in 44 ovarian serous cystadenocarcinoma (Stages I–IV) samples and in 50 healthy females or those with benign disease. Many plasma metabolites of small metabolic molecules are known to play key intermediate functions in different physiological pathways [14, 15]. Their metabolism provides valuable insights into underlying pathological conditions, including cancer, which make them excellent candidates for biomarker exploration. However, evidence for a causal role of this trait in promoting or preventing OC is still lacking. Therefore, the use of plasma metabolites as potential biomarkers for early OC detection and as viable targets for innovative therapeutic interventions to enhance cancer prevention and early screening is a critical priority strategy.
MR is a significant tool in epidemiology, as it addresses confounding variables and uncovers possible causal links. Research indicates that genetic variations can affect biochemical concentrations in plasma, implying that genetic diversity might contribute to racial disparities in the variations related to sex and/or age at the metabolite level [16, 17]. A recent comprehensive investigation of metabolite GWASs revealed loci connected to various diseases [18]. In addition, Chen et al. developed a genotype-dependent metabolite (GDM) database to categorize GDM traits. This resource links thousands of metabolites and metabolic pathways to genetic data, enabling deeper exploration of the hidden connections between human plasma metabolites and the development and progression of OC [19].
This research identified key metabolic signatures that contribute to OC progression. By using Mendelian randomization, we established causal associations between OC subtypes and plasma metabolites, offering potential and easily detectable biomarkers for early detection. Our findings also suggest the possibility of integrating metabolomic profiling into clinical practice for improved diagnosis, screening, and personalized treatment strategies, ultimately advancing targeted therapies and prognostic tools for OC.
Material and methods
Study design
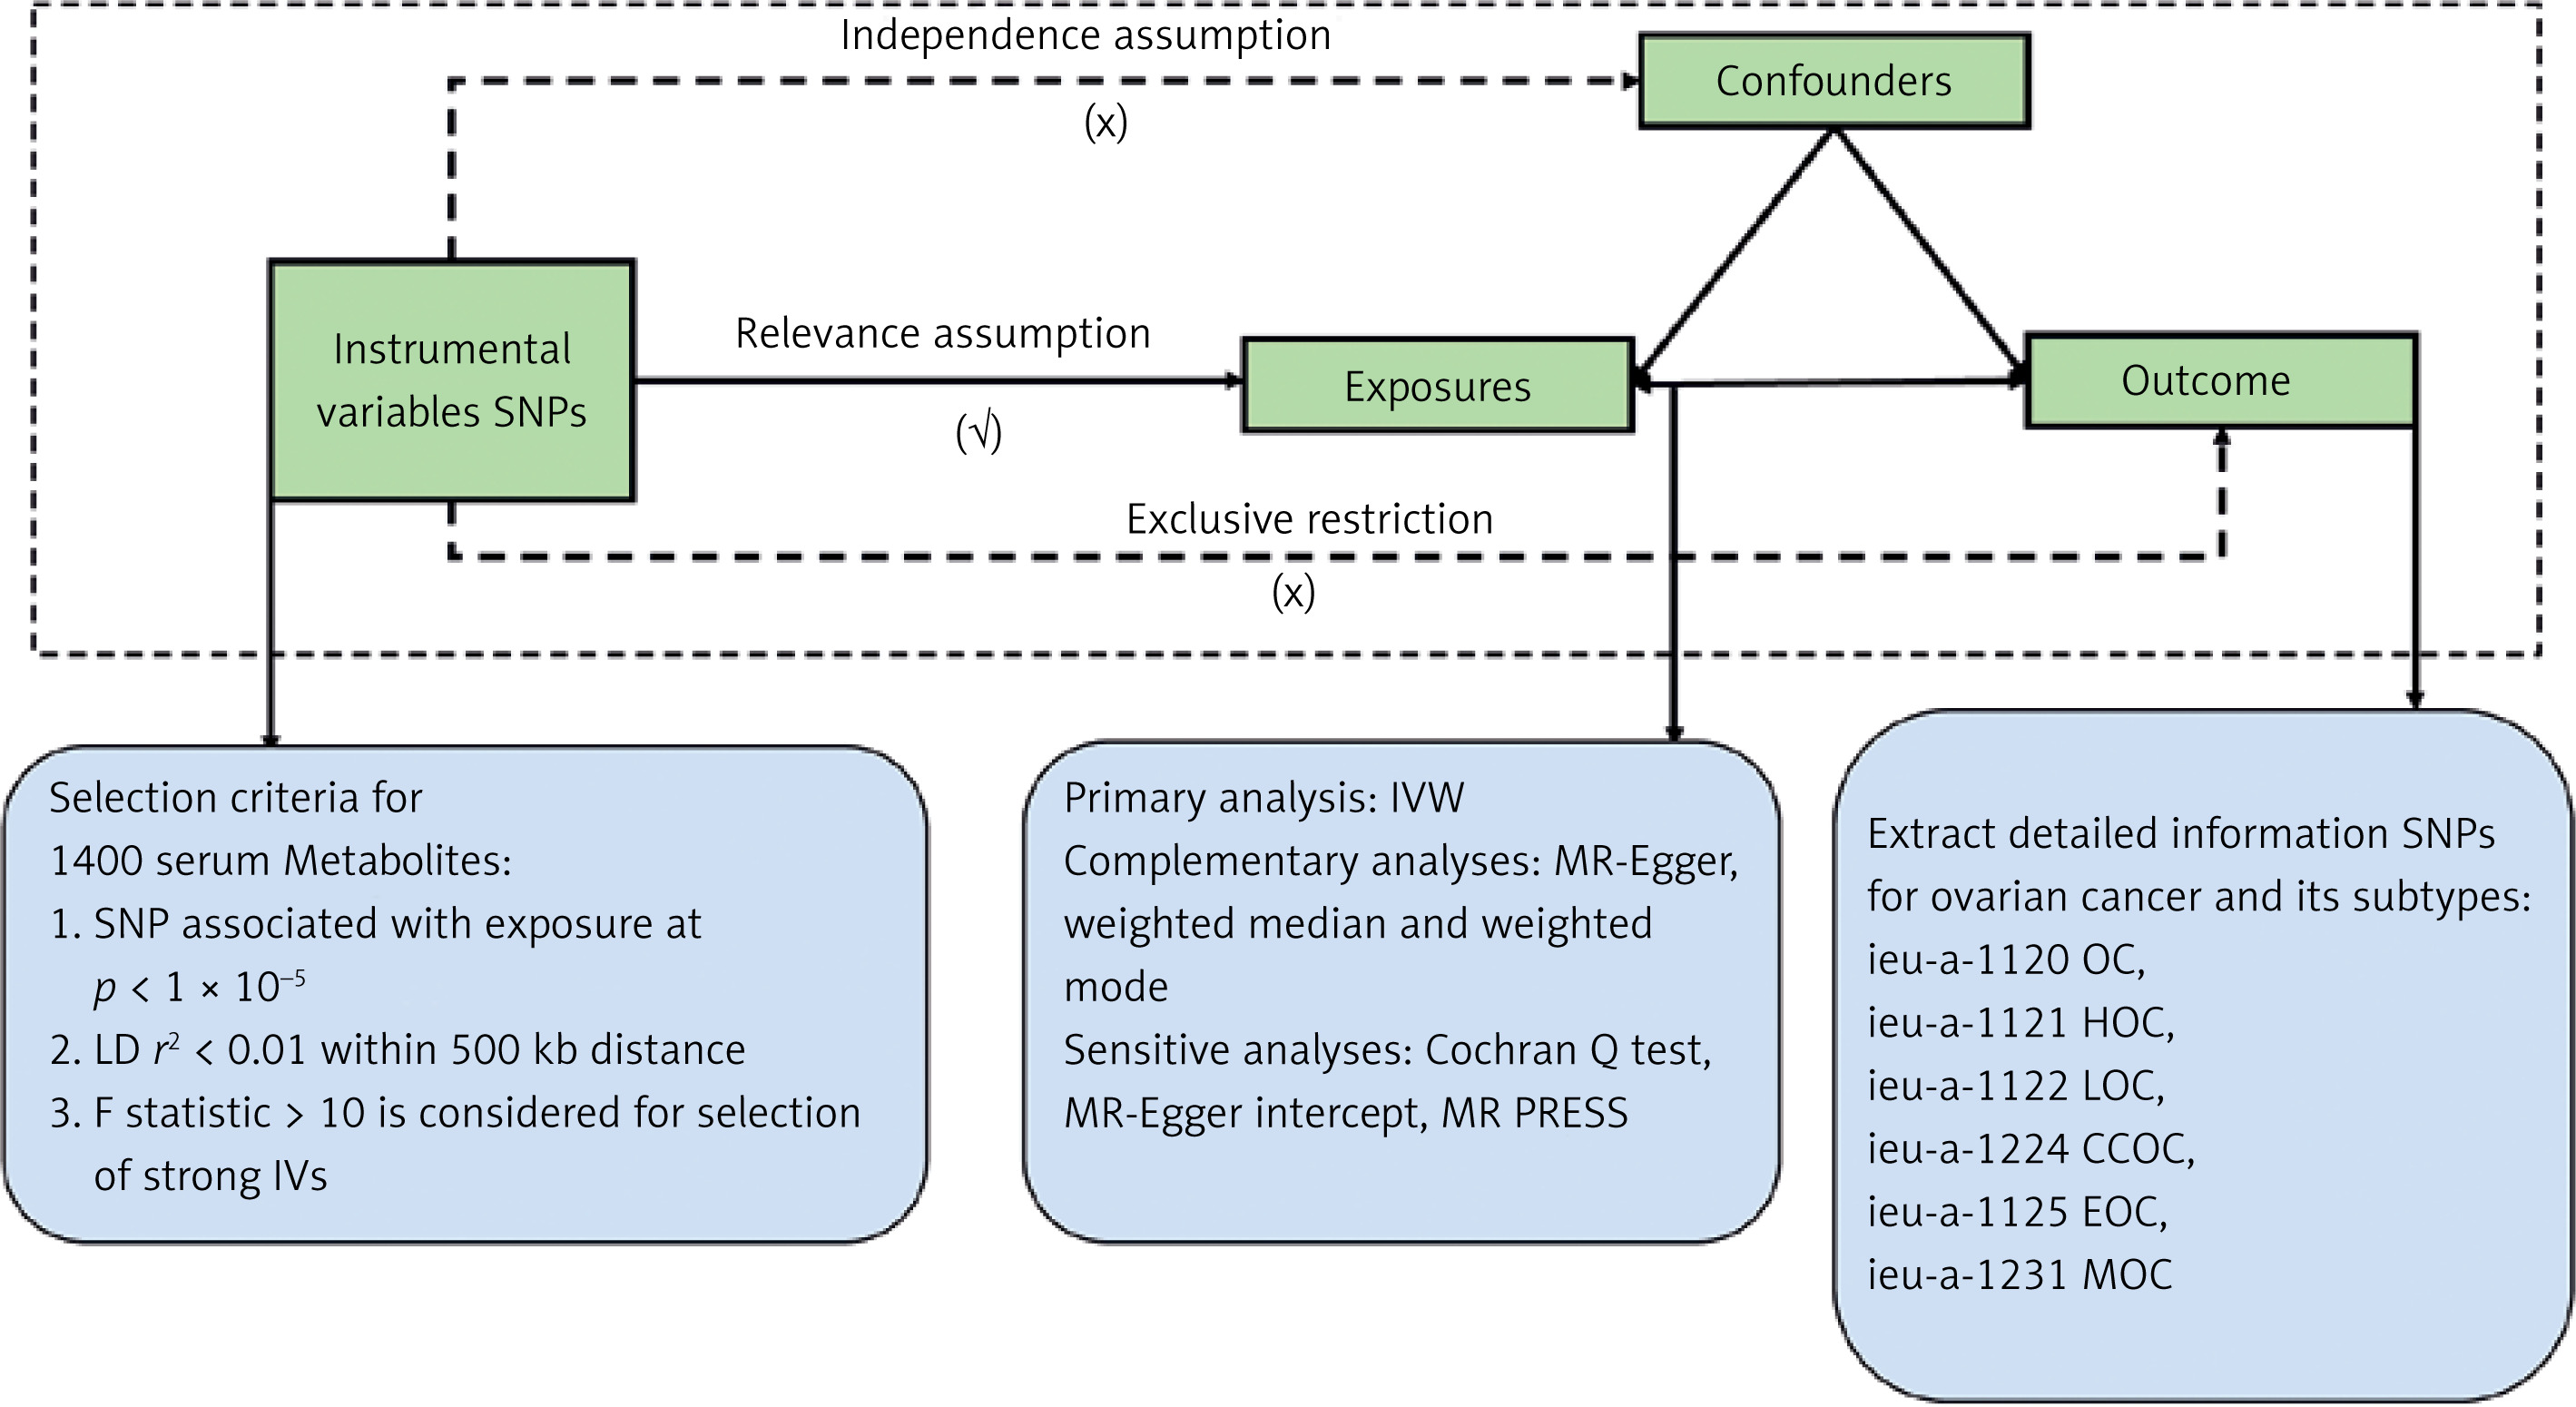
This study used the MR method in a large-scale GWAS to explore the fundamental relationships between the metabolites and OC, including its different subtypes. This approach is founded on three key assumptions [20, 21]: (1) The selected IVs must show a strong correlation with the exposure, specifically OC. (2) The selected IVs must be independent of any confounders that could affect the exposure‒outcome relationship. (3) The selected IVs must influence the results solely through the exposure‒outcome relationship. All analyses were conducted via R software (version 4.2.1) with the two-sample MR, MRCAMO, and radial MR packages. Figure 1 presents the MR study process. This study investigated the causal associations between 1,400 plasma metabolites and OC risk, including its subtypes.
Data sources for exposure and outcome
The plasma metabolites of MR were obtained from a study by Chen et al. [19] involving approximately 8,000 individuals of European descent. A list of the summary indicators of GWASs focusing on plasma metabolites is available in the GWAS Catalog. The accession numbers for these GWAS data range from GCST90199621 to GCST90201020. MR data of OC and each subtype of OC were obtained from the IEU database, OC dataset ID: ieu-a-1120. The analysis included 66,450 Europeans, of whom 225,509 had OC and 440,941 did not have OC. The data pertaining to the OC subtypes were derived from the same sources as previously described [22] (Table I).
Selection of instrumental variables
We accessed GWAS databases to identify IVs while adhering to the three main assumptions of MR. By employing a detailed selection methodology, we addressed concerns related to linkage disequilibrium and examined the latent causal relationship between plasma metabolites and OC. Recognizing the inherent nonindependence among metabolites, we acknowledge that adhering strictly to the conventional genome-wide significance threshold of p < 5 × 10⁻⁸ could be excessively cautious [19]. Such an approach may inadvertently exclude potentially significant associations that warrant consideration. To broaden the scope of relevant plasma metabolites in our search, we applied a wider significance threshold of p < 1 × 10⁻⁵ for the selection of IVs [23, 24]. The intensity of the chosen SNPs as instruments was assessed by calculating the F statistic and the explained variance (R2) for each IV relative to the exposure trait. A common threshold for strong IVs is F > 10 [25], and any IVs with an F < 10 were excluded as weak instruments.
Statistical analysis
To assess latent heterogeneity in the Wald ratio estimates of SNPs [26], we applied the IVW method with multiplicative random effects for accurate estimation [27]. When significant heterogeneity was detected (p < 0.05), random effects IVW was applied; if p > 0.05, fixed-effects IVW was applied [28]. In addition to IVW, three other MR methods – MR-Egger, weighted median, and weighted mode – were adopted to evaluate causality [29]. The IVW approach supposes that all included SNPs are effective instruments [30]. In contrast, the weighted median method requires that at least half of the genetic variants be valid and satisfy the core MR assumptions, making it particularly useful when most instruments are not influenced by horizontal pleiotropy [31]. The MR-Egger regression method, however, posits that more than 50% of the genetic variants are invalid [32]. Results from the four analyses were considered consistent only if the directions of the estimates (positive or negative) aligned [32–34]. If there were discrepancies in these directions, we ruled out any indirect causal associations between metabolites and the progression of OC.
We conducted two sensitivity analyses – Cochran’s Q test and the MR-Egger intercept test – to evaluate heterogeneity and pleiotropy [31, 32, 35]. Heterogeneity was examined through IVW and MR-Egger regression, and the Cochran’s Q statistic was used as the primary measure. A p-value > 0.05 for both IVW and MR-Egger indicated no significant heterogeneity [36, 37]. Pleiotropy was assessed by the MR-Egger regression intercept, where a p-value above 0.05 suggested no evidence of pleiotropy. Additionally, MR-PRESSO analysis was conducted to detect and exclude significant outliers. To minimize false-positive outcomes from multiple testing, we employed FDR correction to adjust for statistical bias in multiple comparisons.
Metabolic pathway enrichment analysis
Pathway enrichment was carried out using MetaboAnalyst version 6.0. This analysis encompassed a thorough investigation of metabolic pathways through the Relational Database of Metabolomic Pathways (RaMP). RaMP integrates various biological pathways drawn from multiple reputable sources, including KEGG, Reactome, WikiPathways, and the Human Metabolome Data Bank (HMDB) [38]. This investigation included only biological pathways previously associated with OC identified by IVW (pIVW < 0.01). Additionally, only metabolites previously linked to OC and its subtypes through IVW (pIVW < 0.01) were considered for this study.
Results
Plasma metabolites causally responsible for OC
We performed MR analysis of 1400 blood metabolites and OC while excluding the inconsistency of results in the estimation direction (either positive or negative) in four methods. Although repeated trials were adjusted by the FDR method, we identified only one metabolite at the 0.05 significance level: AAMU: OR = 1.116, 95% CI: 1.060–1.174, pFDR < 0.038.
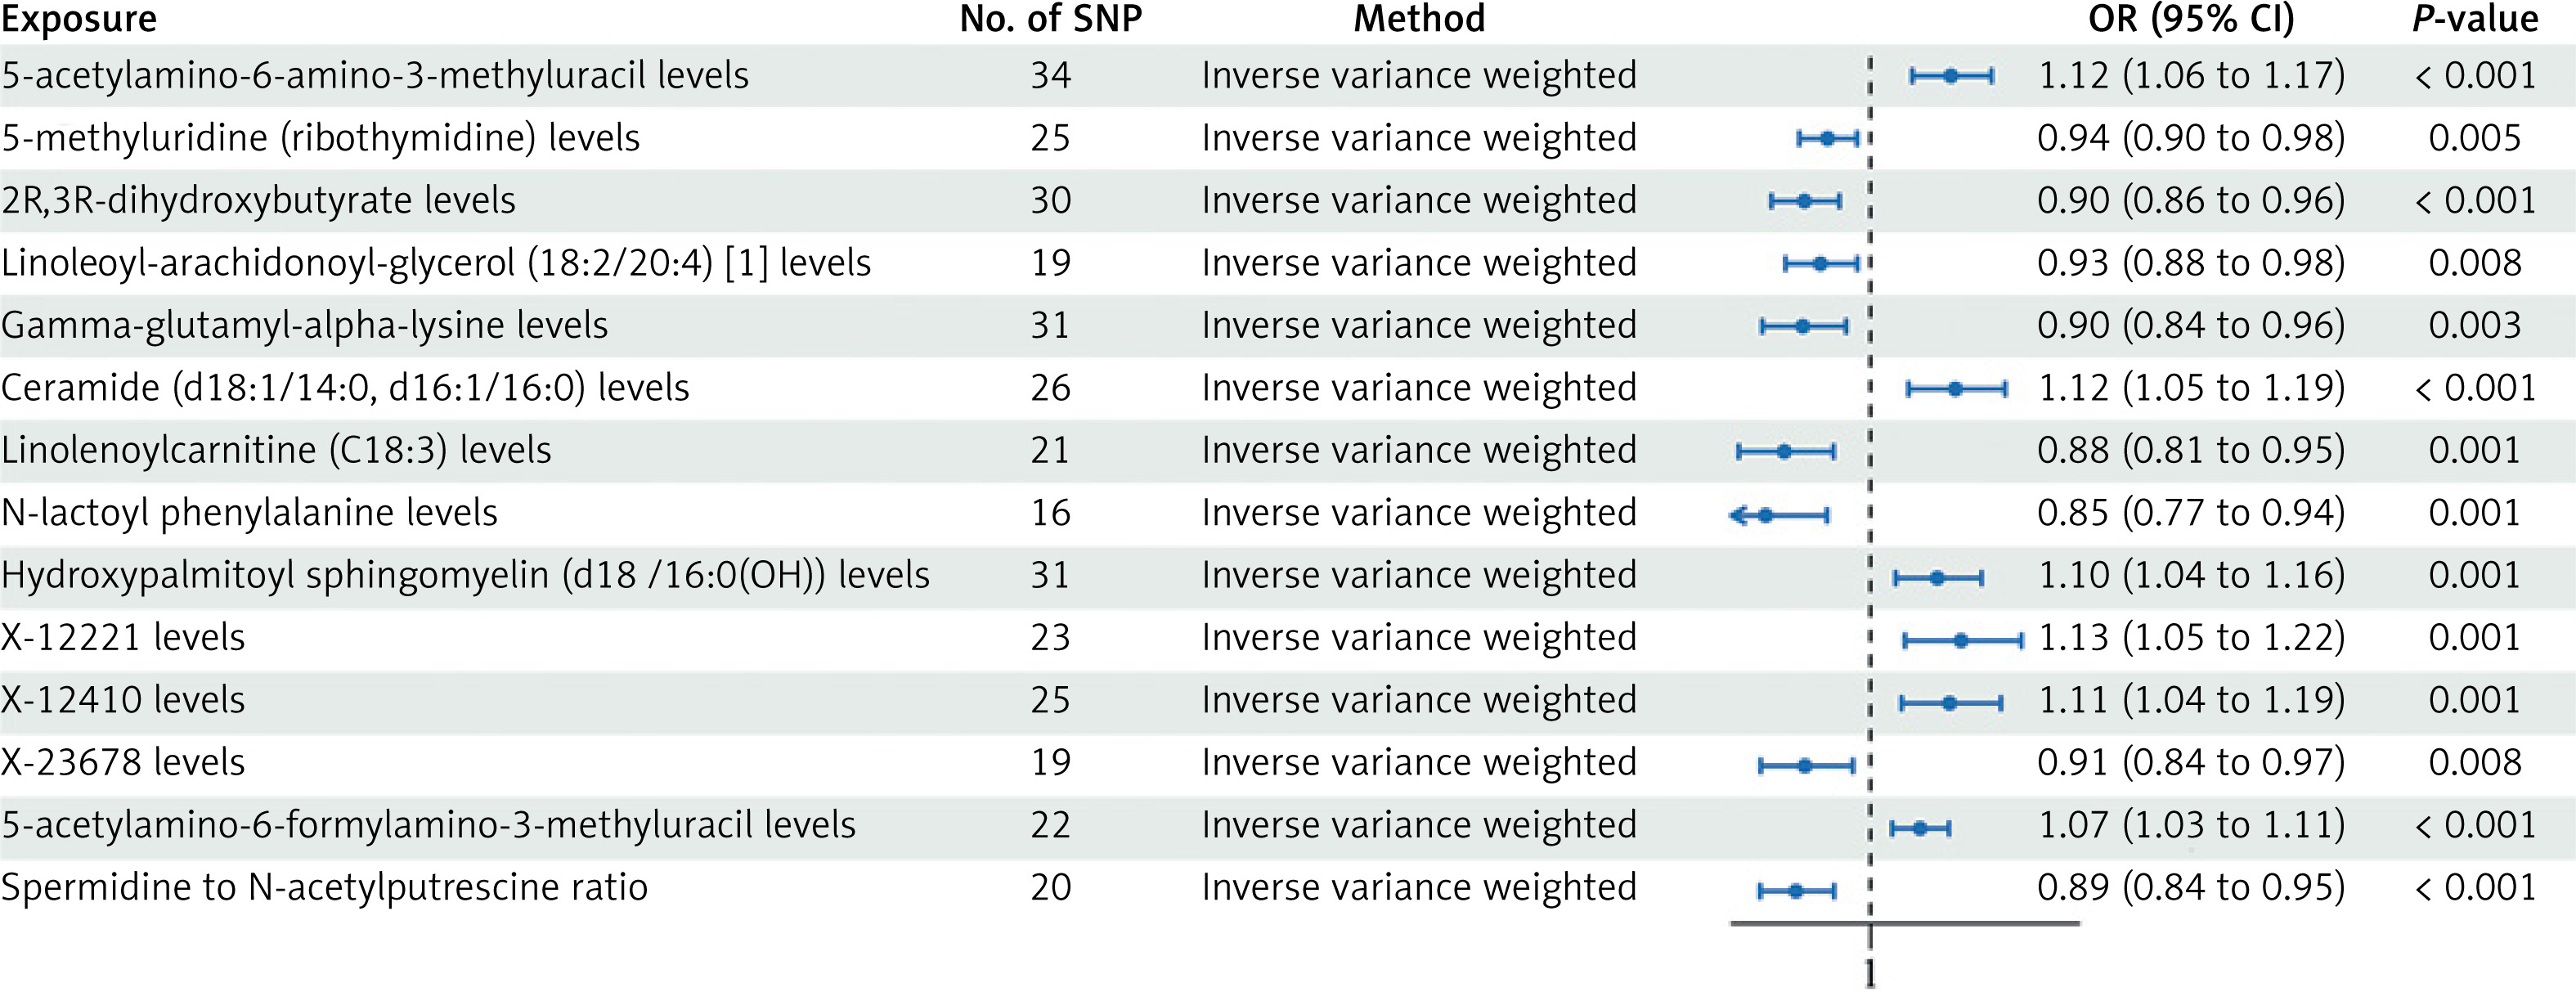
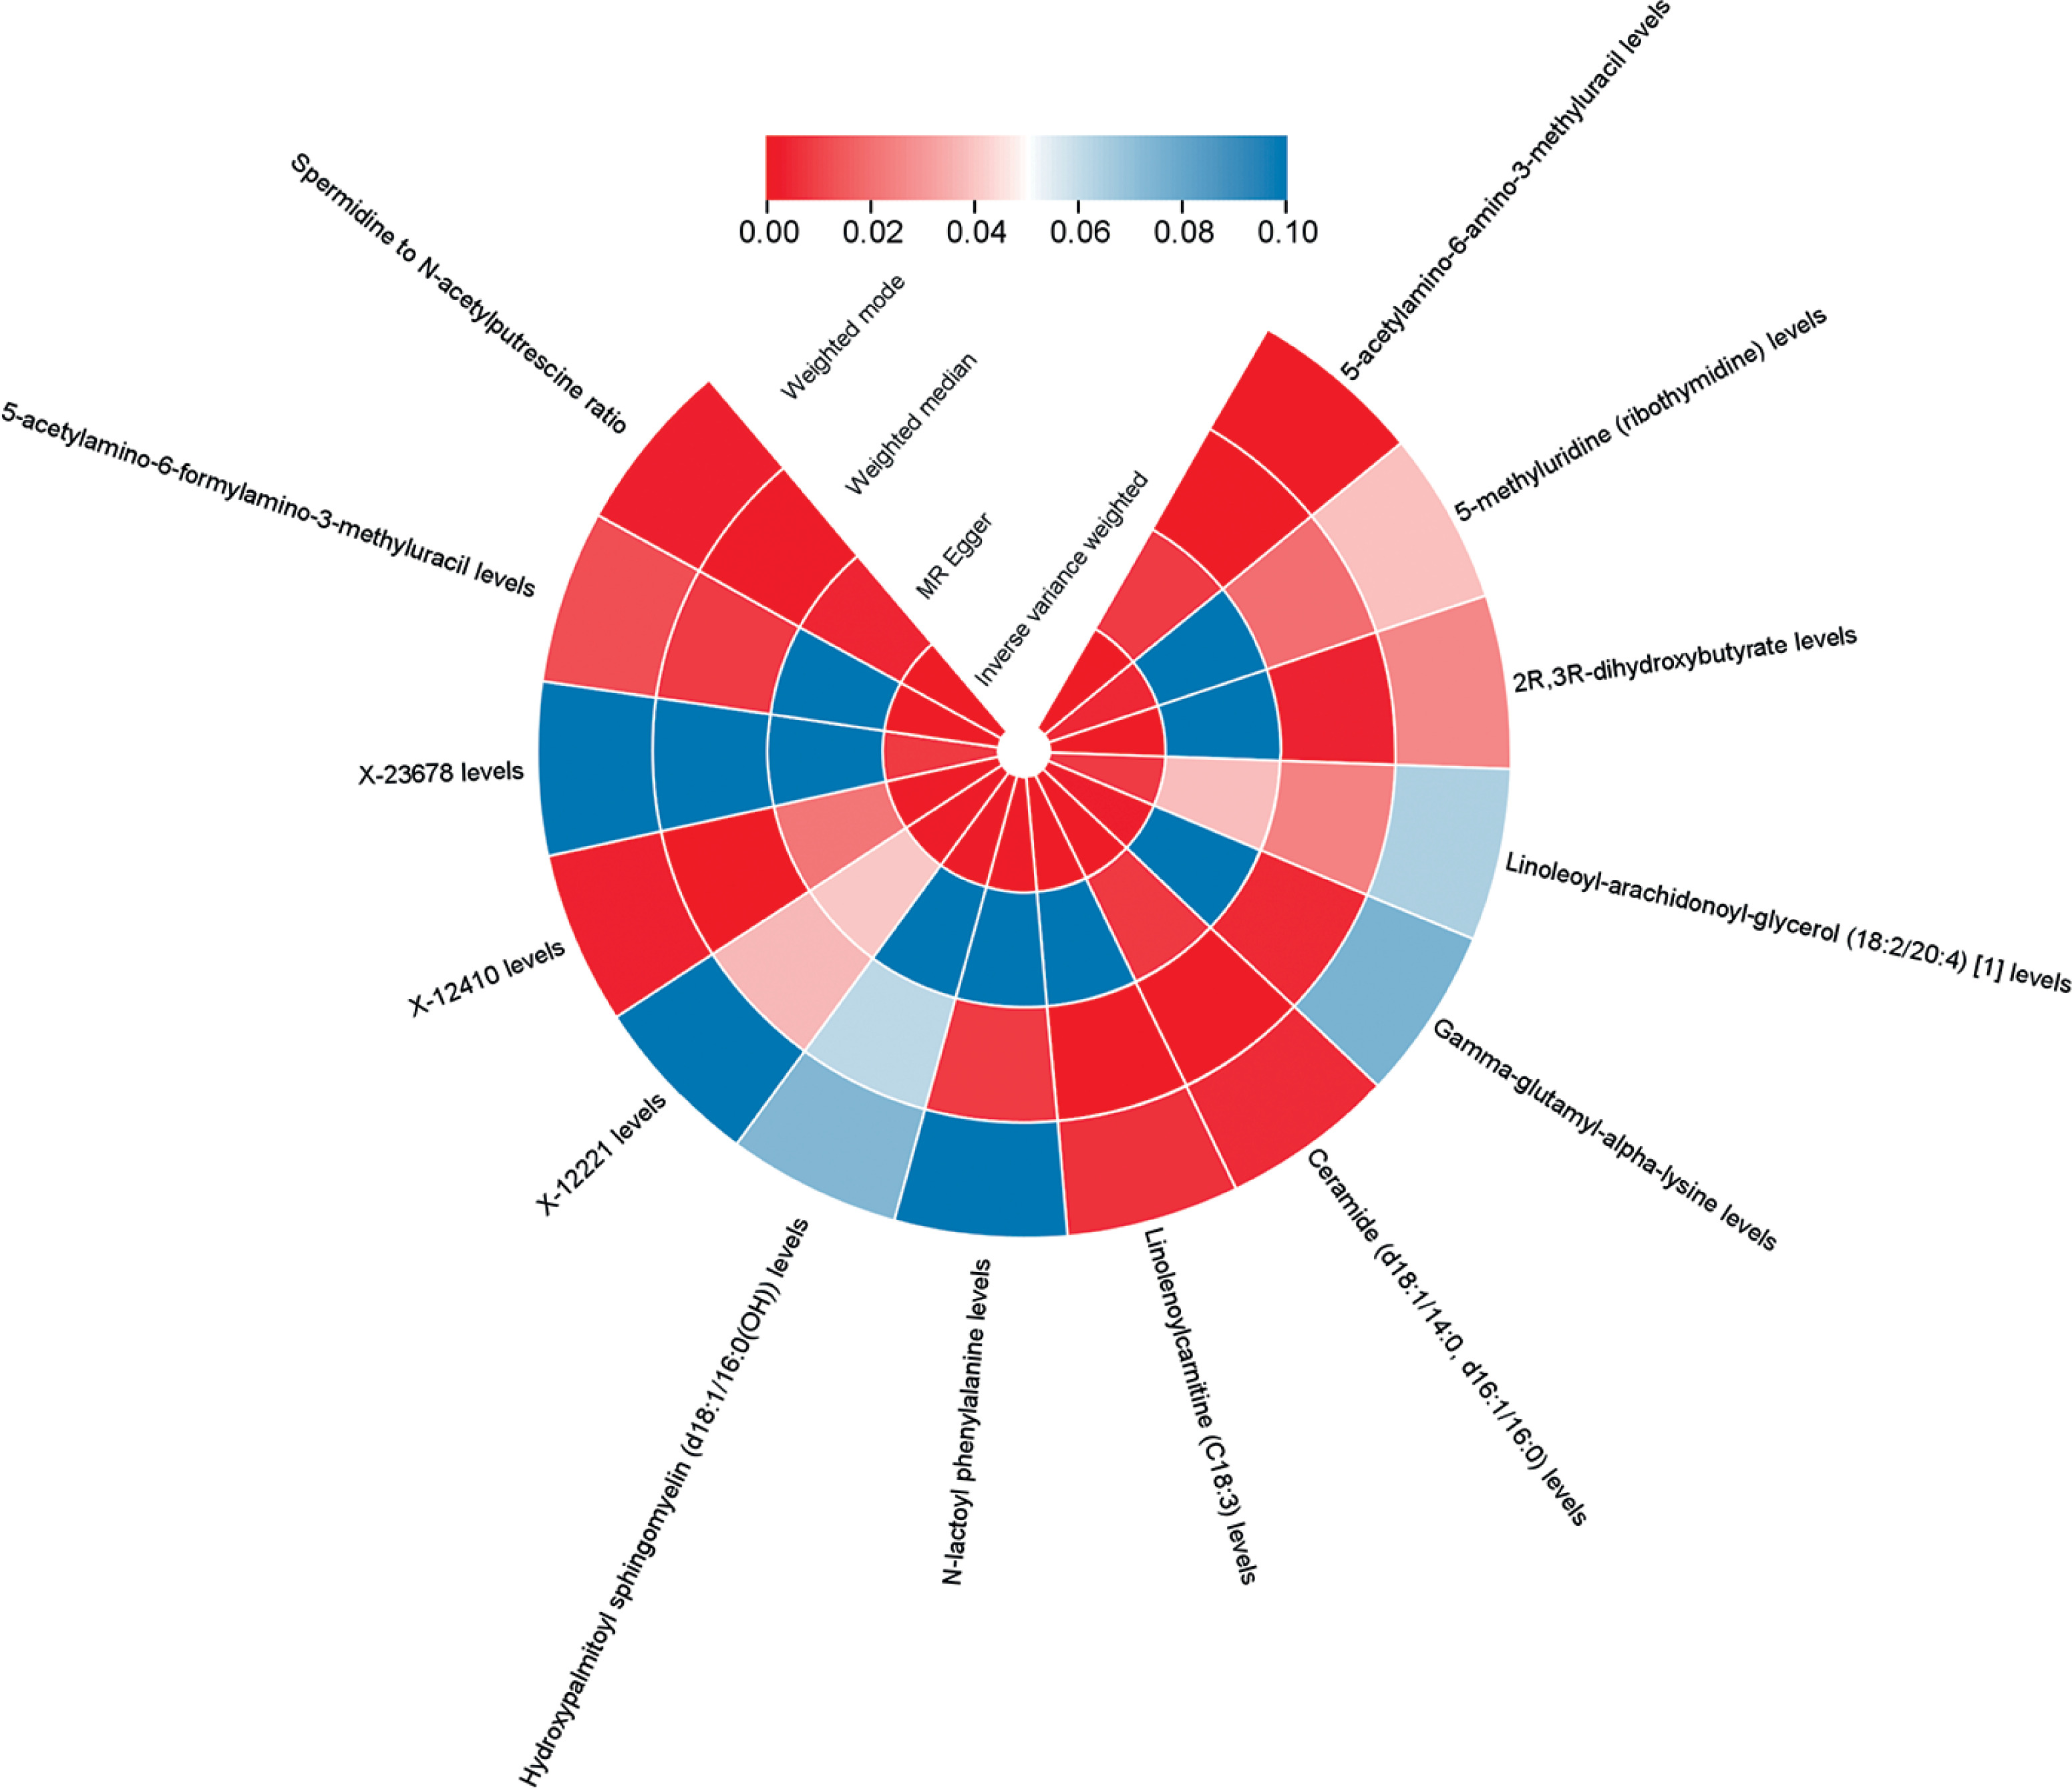
Nevertheless, we detected 14 metabolites associated with OC at the p < 0.01 significance level. These included six metabolites suggestive of a high risk of association with OC: AAMU with OR = 1.116, 95% CI: 1.060–1.174, pFDR < 0.038; ceramide (d18:1/14:0, d16:1/16:0) with OR = 1.122, 95% CI: 1.055–1.194, p = 0.0003; and SM (d18:1/16:0(OH)) with OR = 1.096, 95% CI: 1.036–1.1160, p = 0.0014; X-12221 with OR = 1.130, 95% CI: 1.050–1.217, p = 0.0012; X-12410 with OR = 1.114, 95% CI: 1.045–1.187, p = 0.0010; and AFAMU with OR = 1.071, 95% CI: 1.031–1.113, p = 0.0004. 8 Low-risk metabolites: m5U with OR = 0.938, 95% CI: 0.898–0.980, p = 0.0046; 2R,3R-DHB with OR = 0.905, 95% CI: 0.857–0.955, p = 0.0003; LAG (18:2/20:4) with OR = 0.928, 95% CI: 0.878–0.981, p = 0.0083; gamma-glutamyl-alpha-lysine with OR = 0.902, 95% CI: 0.844–0.965, p = 0.0026; linolenoylcarnitine (C18:3) with OR = 0.876, 95% CI: 0.810–0.947, p = 0.0008; N-lactoyl phenylalanine with OR = 0.849, 95% CI: 0.769–0.937, p = 0.0012; X-23678 with OR = 0.906, 95% CI: 0.842–0.974, p = 0.0079; spermidine to N-acetylputrescine ratio with OR = 0.893, 95% CI: 0.841–0.947, p = 0.0002 (Figure 2, Supplementary SI). The p-value results of the four MR analyses for all positive results are shown in Figure 3.
Figure 2
Forest plot depicting impact estimates of the relationship between identified candidate metabolites and OC phenotypes
No signs of pleiotropy or heterogeneity were found in the strong causative factors mentioned earlier, indicating that the main results from the IVW approach in our research could support causal associations with minimal heterogeneity. The findings related to heterogeneity and horizontal pleiotropy are summarized in Supplementary Tables SII, SIII.
Common metabolite phenotypes between OC and the five subtypes
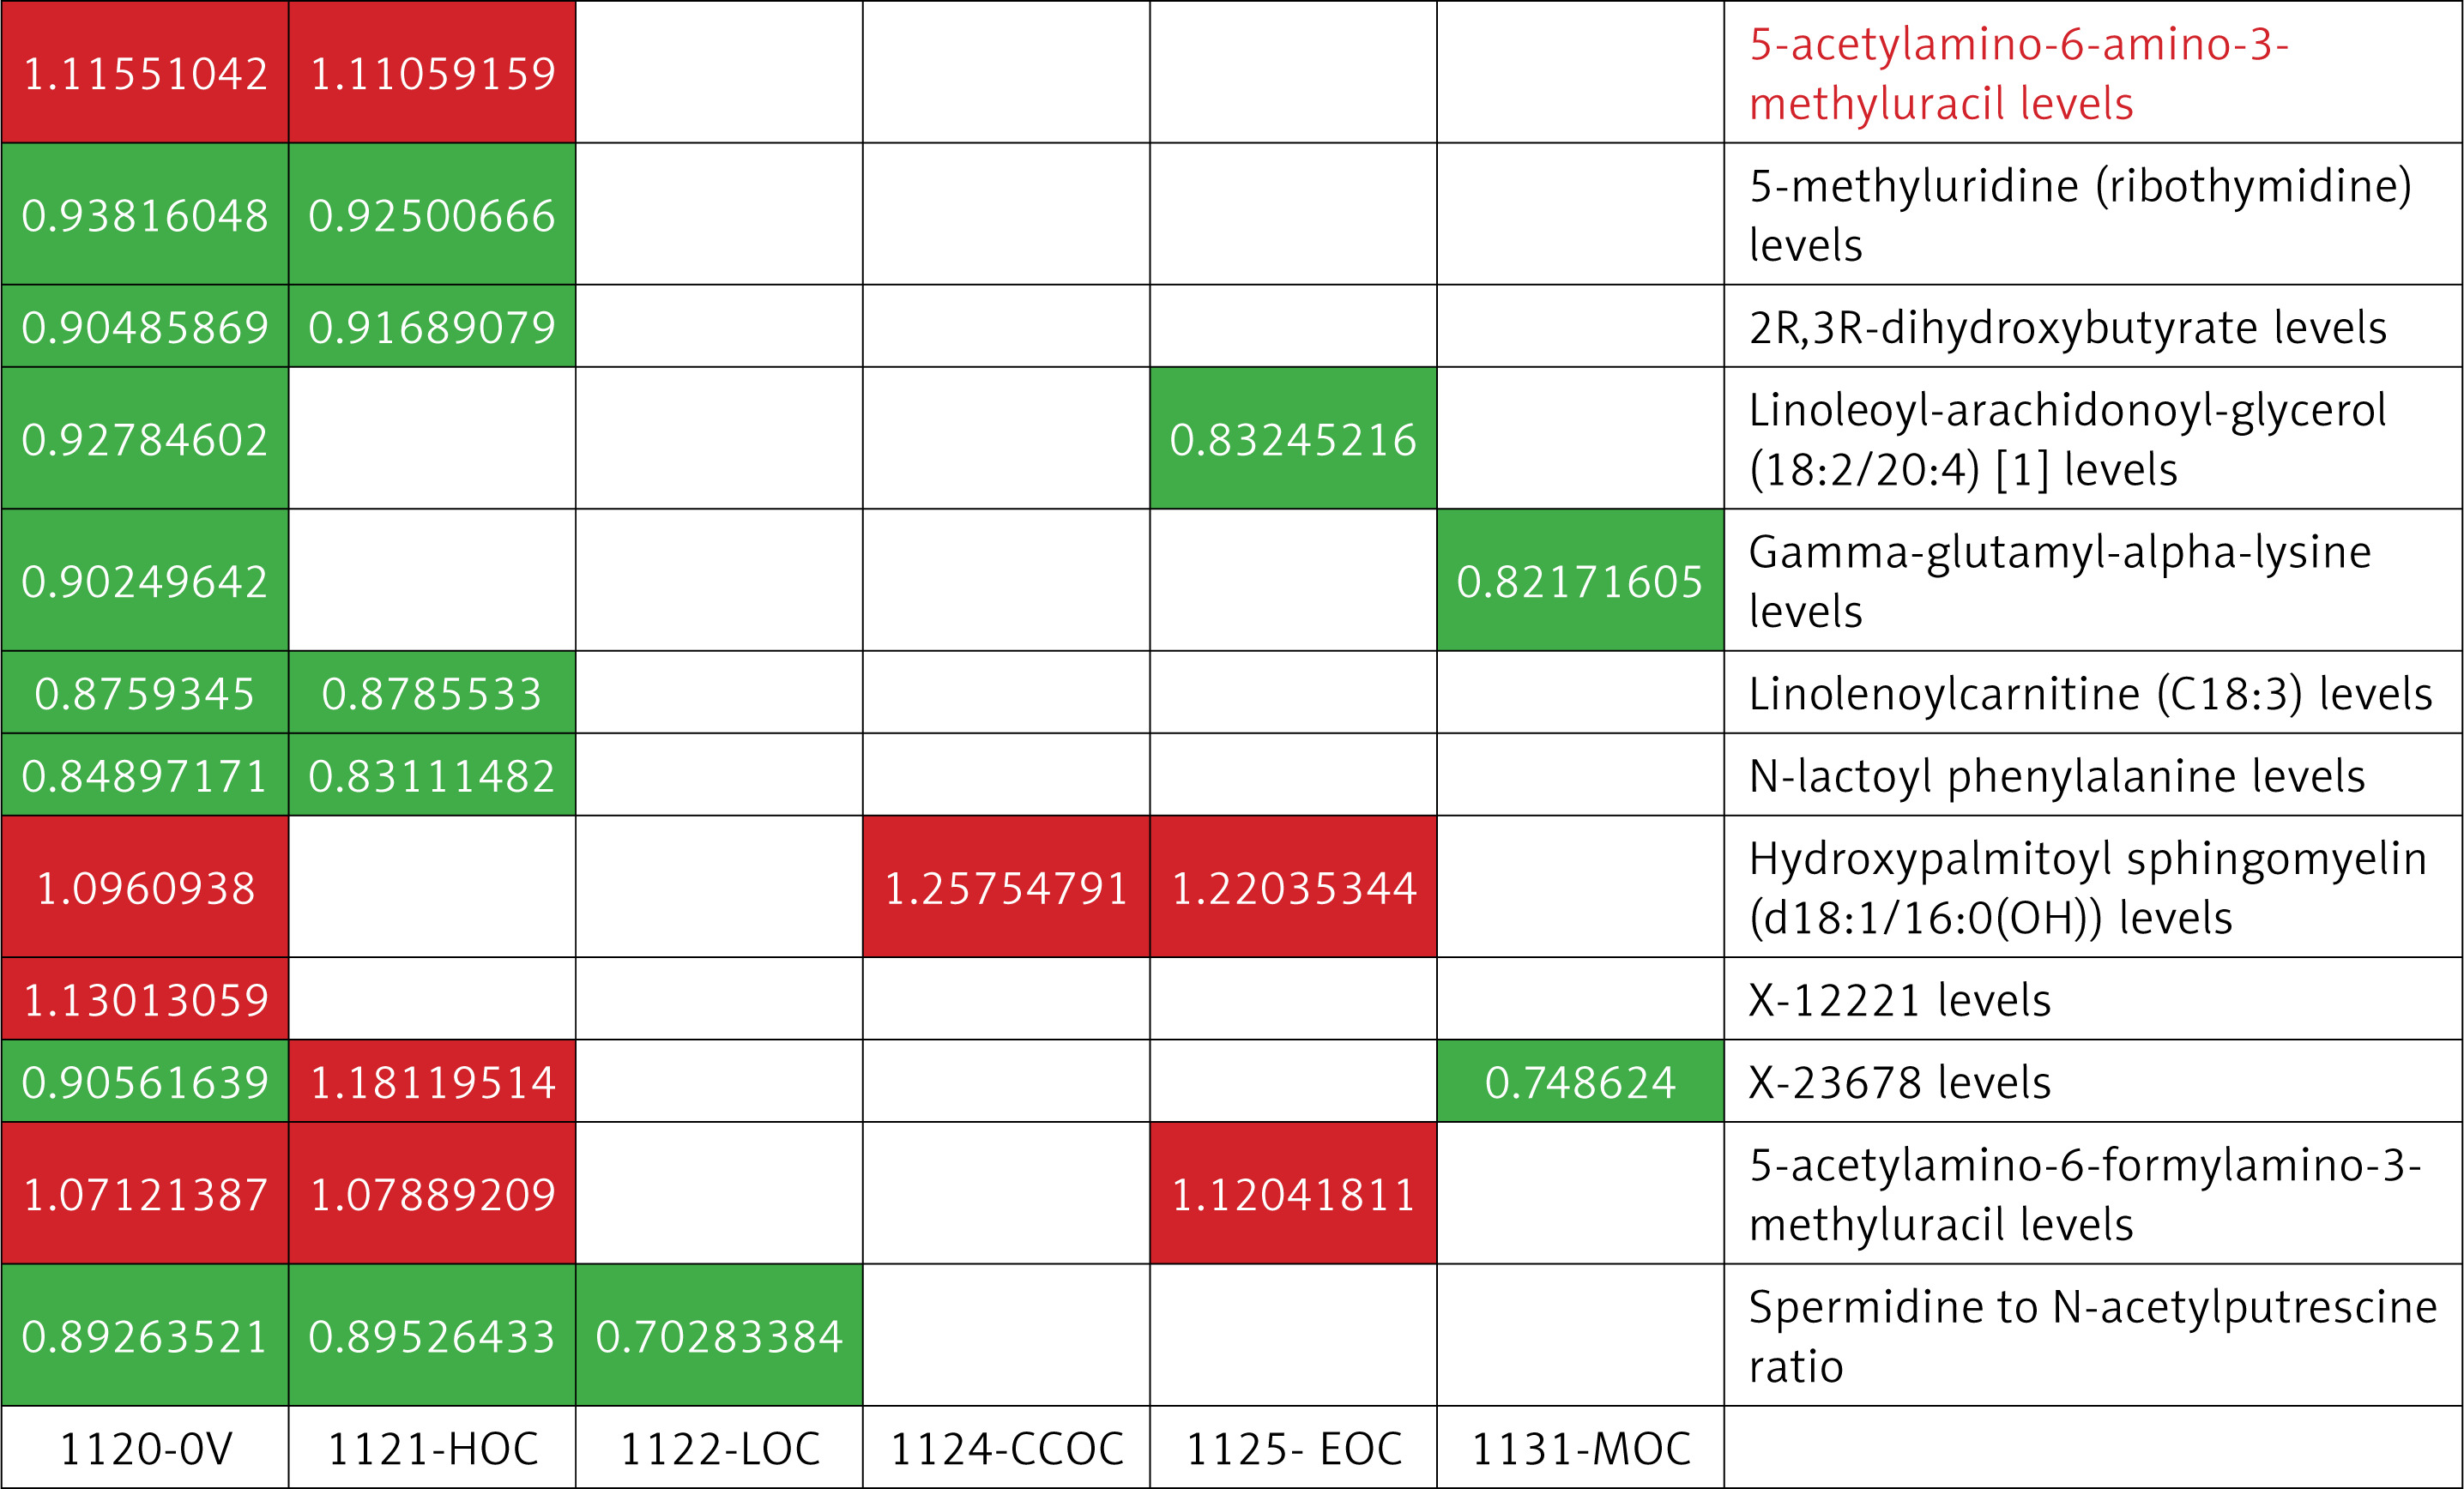
Furthermore, we conducted an MR analysis of 1,400 blood metabolites across five distinct subtypes of OC, using a consistent methodological framework to ensure uniformity across all components of the study. Following the analysis of OC subtypes, a common pathogenic phenotype was identified for these subtypes, as illustrated in Figure 4.
Specific metabolite phenotypes in five OC subtypes
OC is classified into five main types: high-grade serous ovarian cancer (HGSOC), low-grade serous ovarian cancer (LGSOC), endometrioid ovarian cancer (EOC), clear cell ovarian cancer (CCOC), mucinous ovarian cancer (MOC). HGSOC typically shows highly heterogeneous glandular structures, with CA125 and HE4 being common diagnostic markers, and p53 mutations are prevalent. EOC resembles endometrial glands, with positive ER and PR expression, and PTEN mutations are frequent. CCOC exhibits transparent vacuolated cells, with HNF1β as a specific marker and significant ARID1A mutations. MOC is characterized by mucin secretion, with elevated CEA levels, and KRAS mutations are common. HGSOC has well-differentiated cells, frequent KRAS and BRAF mutations, and CA125 has limited diagnostic value.
High-grade serous ovarian cancer
With p < 0.01, we screened 15 associated metabolites, 8 of which were identical to the OC results described above, and 7 were specific to HGSOC: tartronate (hydroxymalonate), N6-acetyllysine, dopamine 3-o-sulfate, 18:0/18:2-GPC, PIP-sulfate (2), 4-acetylcatechol sulfate (1), and adenosine 5′-monophosphate (AMP)-to-tyrosine ratio. These metabolites, when analyzed using four methods, produced results comparable to those obtained via IVW.
Low-grade serous ovarian cancer
Similar to HGSOC, we identified 9 known associated metabolites, with one overlapping with OC and 8 specific to LGSOC. These included 5 high-risk and 7 low-risk metabolites, which are as follows: sphingomyelin (d18:1/22:1, d18:2/22:0, d16:1/24:1), sphingomyelin (d18:1/21:0, d17:1/22:0, d16:1/23:0), 3-formylindole, 3-indoleglyoxylic acid, a-ketoglutarate to aspartate ratio, 2-o-methylascorbic acid, sucrose, spermidine to N-acetylputrescine ratio, and adenosine 5′-monophosphate (AMP) to leucine ratio.
Endometrioid ovarian cancer
In addition, we screened 18 relevant known metabolites associated with EOC subtypes, of which 3 metabolites were identical to those associated with OC, and the remaining 15 metabolites were specific, including 9 high-risk metabolites: trimethylamine n-oxide, 1,2-dilinoleoyl-GPC (18:2/18:2), 18:2/18:3-GPC, tetradecadienedioate (C14:2-DC), SM(d18:1/16:0(OH)), dimethylglycine, AFAMU, retinol (vitamin A) to linoleoyl-arachidonoyl-glycerol (18:2 to 20:4) [2] ratio, cholesterol to linoleoyl-arachidonoyl-glycerol (18:2 to 20:4) [2] ratio, and 9 low-risk metabolites: glycocholenate sulfate, 1-(1-enyl-stearoyl)-2-oleoyl-GPE (p-18:0/18:1), LAG (18:2/20:4), dichosatrienoate (22:3n6), arachidonoylcarnitine (C20:4), 2-ketocaprylate, arachidonate (20:4n6), 18:0/20:4-GPC, spermidine to pyruvate ratio.
Clear cell ovarian cancer
There is one common outcome of OC, and there are also 3 specific high-risk metabolites – 3-(3-hydroxyphenyl)propionate, SM(d18:1/16:0(OH)), succinate, the cholesterol to linoleoyl-arachidonoyl-glycerol (18:2 to 20:4) [1] ratio – and 8 low-risk metabolites: quinate, taurocholenate sulfate, 4-hydroxycoumarin, 1-(1-enyl-palmitoyl)-GPC (p-16:0) ratio, N-acetylcarnosine, 1-oleoyl-GPG (18:1) ratio, arginine, and choline-to-choline ratio.
Mucinous ovarian cancer
Similarly, according to the IVW method, 15 known metabolites were identified to be associated with MOC, 2 of which are common to OC. Another 6 high-risk metabolites are specific to this phenotype: N-formylphenylalanine, N-methylhydroxyproline, 3-amino-2-piperidone, adenosine 5′-diphosphate (ADP)-to-valine ratio, isoleucine-to-phosphate ratio, and leucine-to-phosphate ratio. In addition, 9 low-risk metabolites were identified: 4-hydroxyhippurate, arabonate/xylonate, enyl-16:0/18:1-GPE, GGAL, PIP-sulfate(3), b-hydroxyisovalerate, guanidinoacetate, orotidine, and creatine to carnitine ratio.
Information on the results of MR analysis of OC subtypes can be found in Supplementary Tables SIV–SXVIII and Supplementary Figures S1–S5.
Pathway enrichment analysis
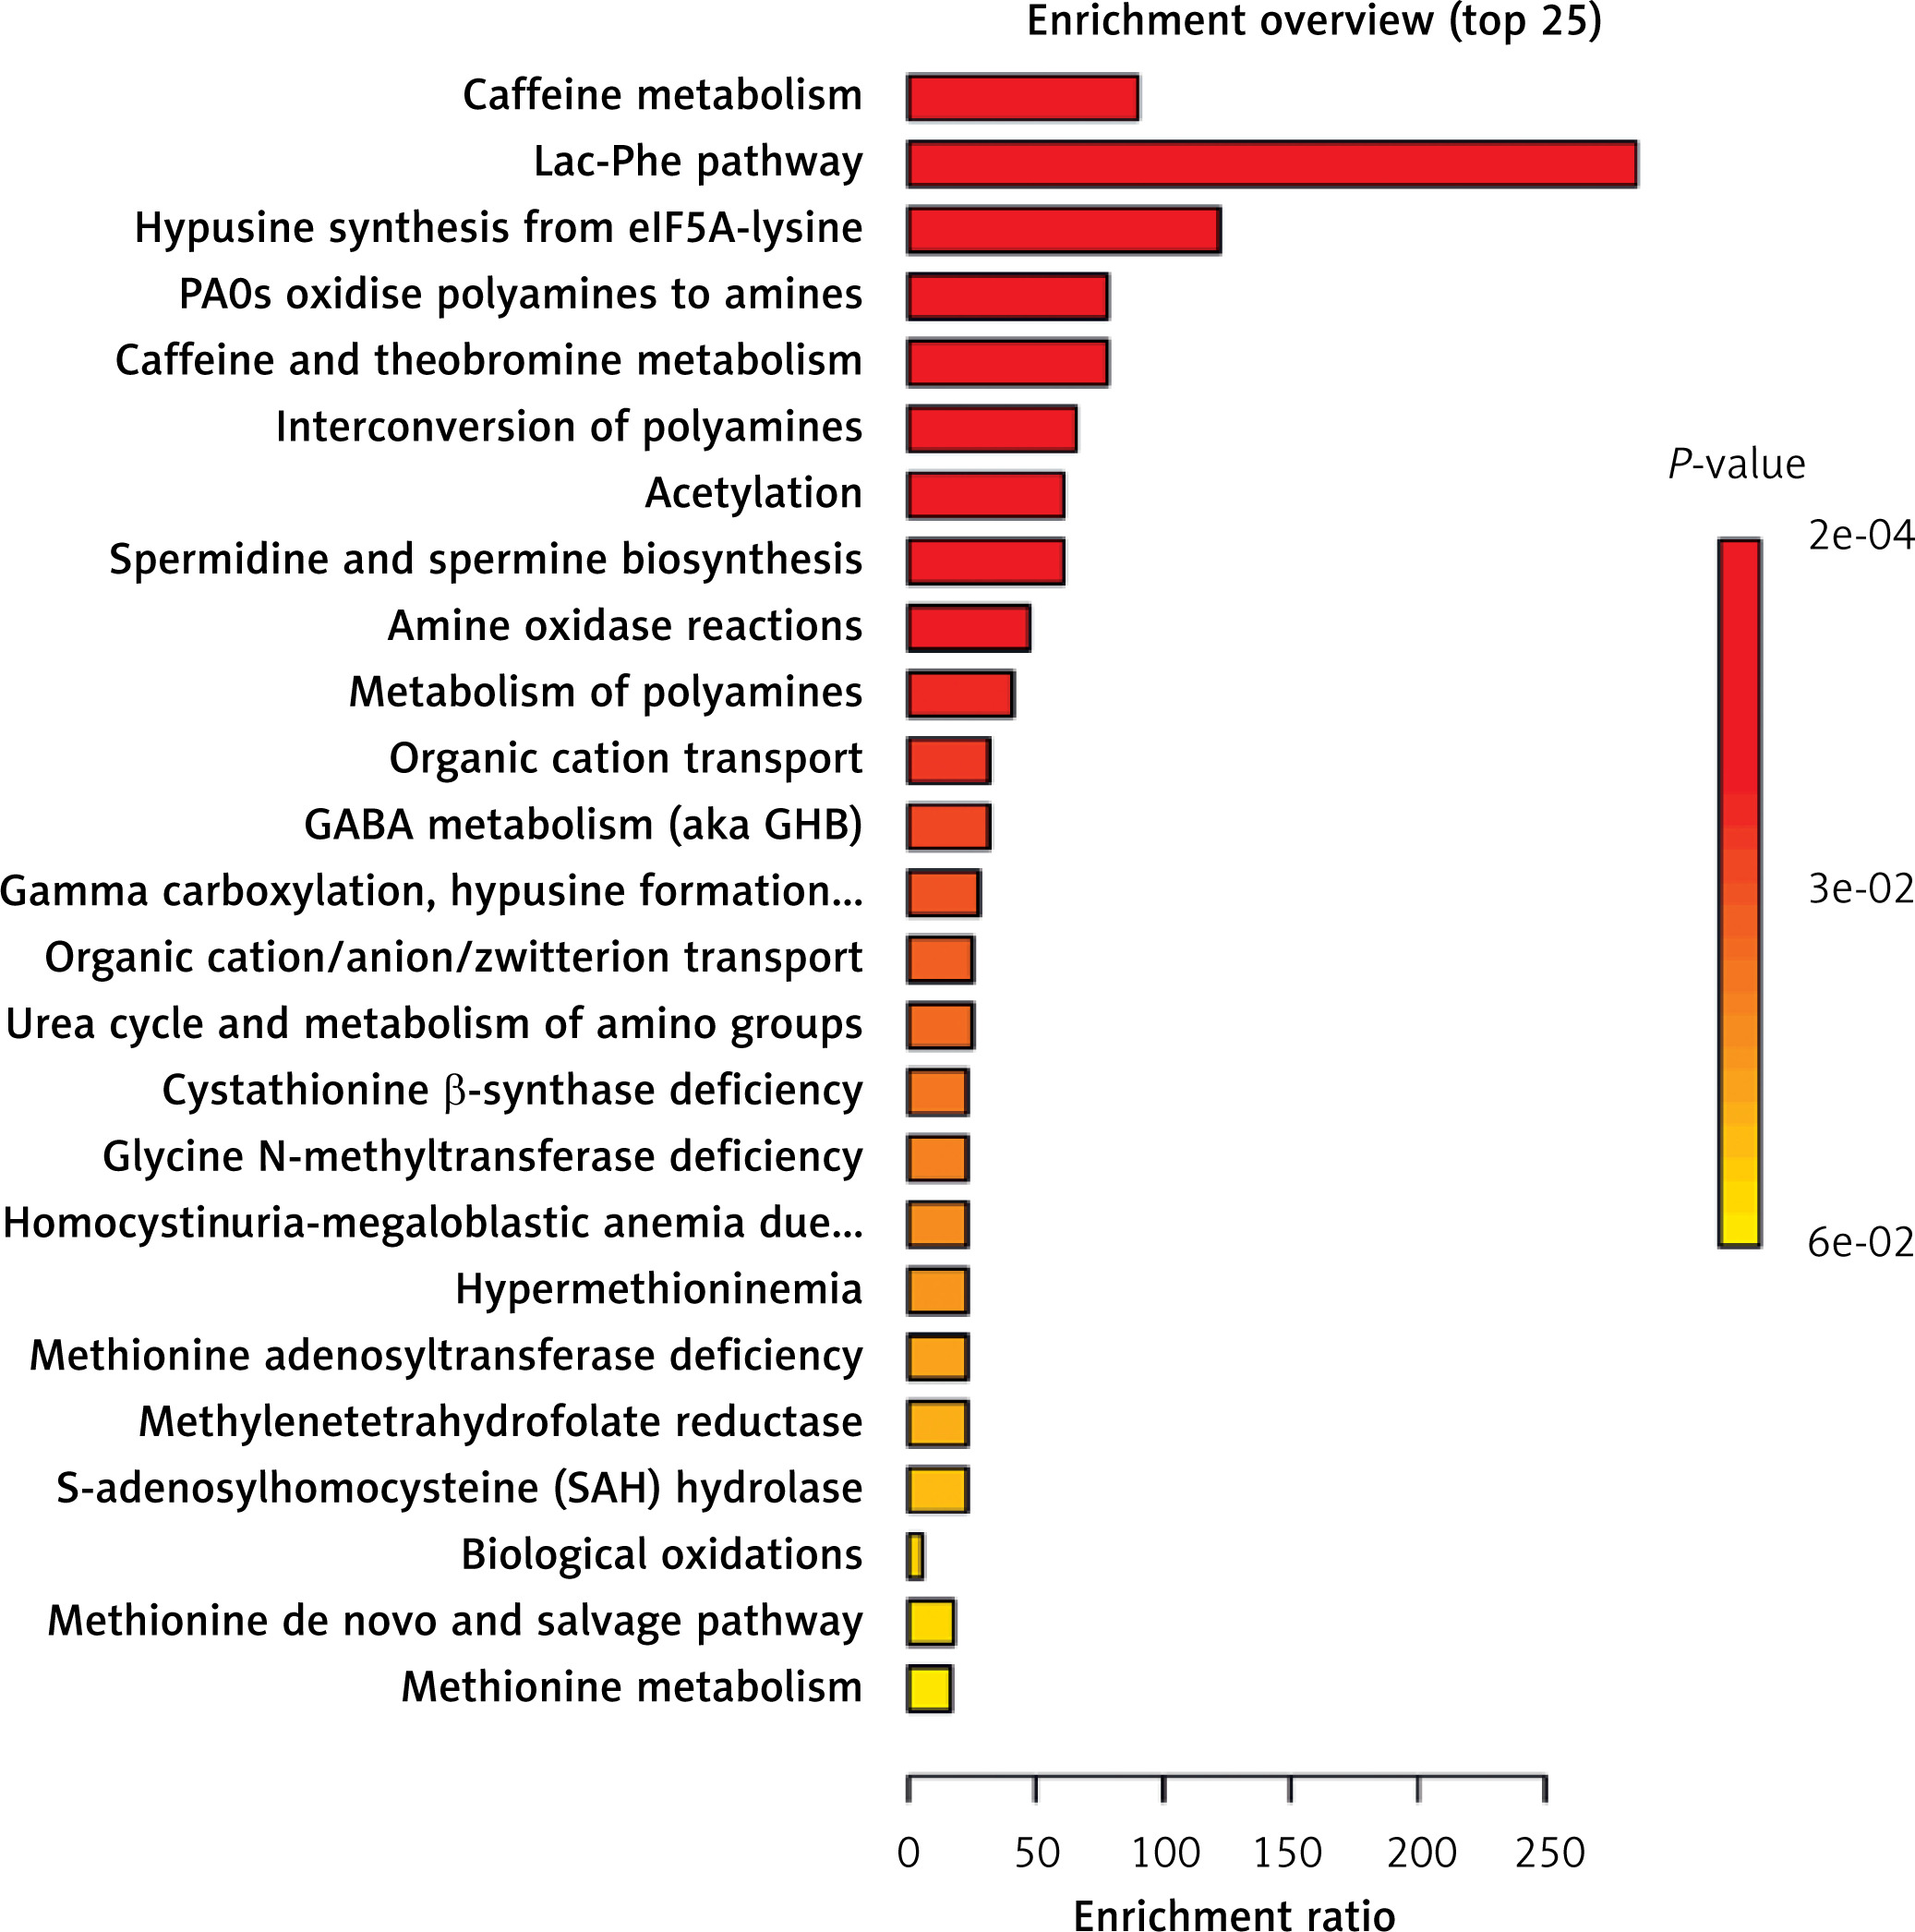
As shown in Figure 5 (Supplementary Table SXIX), we conducted a comprehensive analysis of the metabolic pathways and enrichment of metabolites that are associated with OC and its various subtypes. This involved an investigation of the RaMP database, which yielded insightful results. Our findings revealed a total of 23 distinct metabolic pathways associated with OC. Notably, caffeine metabolism was the most significant among these pathways, highlighting its potential relevance in understanding the metabolic alterations associated with OC.
The analysis of metabolic pathways across the five subtypes of OC revealed notable findings. Caffeine metabolism was significantly correlated with HGSOC. Moreover, pathways related to citrullinemia Type I, argininemia, argininosuccinic aciduria, ornithine transcarbamylase (OTC) deficiency and carbamoyl phosphate synthetase deficiency were strongly associated with LGSOC. The methionine de novo and salvage pathway was also significantly associated with EOC, whereas the immune system pathway was notably associated with CCOC. Furthermore, pathways involving mRNA, protein, and metabolite induction by cyclosporin A were significantly related to MOC. The most important pathways for each cancer subtype are presented in Supplementary Tables SXXI–SXXIV and Supplementary Figures S1–S5.
Discussion
In this study, eight high-risk factors and six low-risk factors were identified through genomics and metabolomics via MR. In addition, we reverse-validated our results, which revealed no causality, eliminating bias associated with reverse causality and reinforcing the dependability of our preliminary MR results. After FDR correction, one high-risk factor for OC, AAMU, was identified. Moreover, metabolic pathway enrichment analysis revealed caffeine metabolism as the most significant pathway.
We characterized eight metabolites as potential cause-and-effect links to increased OC risk. Currently, research on the association between these metabolites and OC remains limited. LAG (18:2/20:4) and C18:3-Car participate in glycerophospholipid and lipid metabolism pathways. Lipid metabolism reprogramming is a signature of cancer, and studies have shown that certain polyunsaturated fatty acids (PUFAs) and their glycerides are associated with inflammation and cancer progression [39, 40]. Carnitine derivatives, including linolenoylcarnitine, may be involved in mitochondrial energy metabolism and the metabolic adaptation of cancer cells [41]. Our study further supports this perspective. GGAL, N-lactoylphenylalanine and 2R,3R-DHB are both involved in the amino acid metabolism pathway. In cancer cells, amino acid metabolism is frequently reprogrammed to satisfy the elevated demands for nutrients, energy, and biosynthetic precursors necessary for growth. Studies have shown that N-lactoyl compounds may be associated with lactate metabolism and the acidification of the tumor microenvironment, allowing cancer cells to promote growth and immune evasion via this metabolic pathway [42–44]. In future studies, we intend to explore targeting this pathway to disrupt immune evasion in tumor cells and thereby control cancer progression.
The ratio of spermidine to N-acetylputrescine can serve as an indicator of the balance between polyamine synthesis and degradation, which has been shown to be dysregulated in various types of cancer. Polyamine metabolism is often upregulated in cancer cells to support their rapid growth and survival [45, 46], making it a potential target for cancer therapy.
AAMU, m5U, and AFAMU are all involved in pyrimidine metabolism. Due to their essential role in cell proliferation, dysregulation of pyrimidine metabolism has already been recognized as a critical driver of tumorigenesis [47, 48]. Cancer cells typically enhance pyrimidine synthesis (de novo synthesis) to meet the demands of rapid proliferation [49]. Among these, m5U, a metabolic product of tRNA degradation, is associated with RNA methylation and is elevated in bladder cancer [50], potentially reflecting the high RNA metabolic activity of tumor cells. This finding aligns with our study. From a treatment perspective, targeting pyrimidine metabolism could provide a novel therapeutic approach in which therapeutic strategies aimed at modulating pyrimidine metabolism could inhibit this excessive metabolic activity, potentially slowing tumor progression.
Our analysis revealed potential causal relationships between six metabolic products and the inhibition of OC progression. Among these, AAMU and AFAMU are involved in caffeine metabolism. Recent studies have shown that caffeine metabolism is closely associated with colorectal cancer [51], breast cancer [52], and prostate cancer [53], among others. The relationship between caffeine metabolism and OC risk may stem from the impact of caffeine and its metabolic byproducts on sex hormone regulation [54, 55]. Studies have also demonstrated that caffeine can affect DNA methylation levels by inhibiting DNA methyltransferases (DNMTs), thus influencing the activity of oncogenes and tumor suppressor genes [56]. These findings align with our results, but the underlying mechanisms warrant further investigation. Future research should explore individual variations in caffeine metabolism to develop more targeted strategies for cancer prevention and treatment.
Ceramide (d18:1/14:0, d16:1/16:0) and SM (d18:1/16:0(OH)) are metabolites of sphingolipid metabolism. Both ceramide and sphingomyelin are critical tumor suppressors that regulate apoptosis, autophagy, and cell proliferation [57]. Therefore, investigating the potential of sphingolipid metabolism, particularly the use of ceramide derivatives as anticancer agents, may provide a novel approach to cancer therapy.
Although five OC subtypes have unique metabolites distinct from those in other forms of OC, these notable findings do not lessen the importance of metabolites in the development of OC. There is growing evidence on observational studies has highlighted metabolic abnormalities in cancer patients relative to healthy individuals. These findings may guide the development of targeted treatment strategies for OC patients. These initial findings offer a foundation for further research.
We support the development of screening programs for groups displaying metabolic irregularities, employing big data analysis to highlight the significant impact of plasma metabolites on the clinical prevention and prognosis of OC. Currently, several methods, such as mass spectrometry and nuclear magnetic resonance, are available for detecting plasma metabolite levels. Future studies could use ex vivo and in vivo experiments to further investigate the relationship between these metabolites and the diagnosis and treatment of OC. We hope to combine metabolic profiling with current diagnostic biomarkers (e.g., CA-125) in the future to improve diagnostic accuracy in OC. Furthermore, we endorse the practice of conducting longitudinal follow-up assessments of patients diagnosed with OC. This ongoing monitoring is crucial for exploring potential biomarkers associated with cancer recurrence. By tracking these patients over time, we can better understand the complex dynamics of cancer behavior and develop more effective strategies to predict and prevent recurrences.
Acknowledging the limitations of this study is essential. Firstly, the accuracy of MR analysis depends on the strength and validity of the IV exposure, highlighting the need for larger sample sizes and more precise metabolomic measurements. Moreover, the study’s focus on a European population restricts the generalizability of the findings, underscoring the importance of further validation in more diverse cohorts. Future studies should aim for more precise classification and characterization of phenotypes, as well as refinement of functional modeling to reduce bias. These improvements would enhance the power and validity of the results. Also, MR can only be used to assess the causal effect of exposure on outcomes, without considering the quantification of potential causal effect sizes. Future studies should analyze longitudinal data and conduct clinical trials to validate the specific causal relationship between the expression levels of these metabolites and OC, which will help determine whether these effects are age- and sex hormone-dependent or conditional on specific factors, thus providing a more nuanced understanding of the dynamic regulatory relationship between these metabolites and OC.
In conclusion, this MR research highlights potential causal associations between metabolites and OC, along with its subtypes. The results increase our understanding of OC development, including its different variants, and could serve as a foundation for improved management approaches in clinical practice. Nonetheless, because of insufficient strong supporting evidence, additional research is necessary to validate these associations and broaden these findings to increase their applicability in the early detection and diagnosis of OC. Future studies could investigate the combination of metabolites with existing diagnostic markers such as CA125 and HE4 to enhance the diagnostic accuracy for early-stage OC. Additionally, exploring novel therapeutic strategies targeting metabolites or metabolic pathways could offer promising approaches for inhibiting OC progression.