Introduction
Cardiovascular-kidney-metabolic (CKM) syndrome is a life-course risk stratification framework proposed by the American Heart Association to characterize the continuous progression among obesity, metabolic abnormalities, kidney dysfunction, and cardiovascular diseases [1]. Substantial evidence indicates that the risks of all-cause and cardiovascular mortality increase markedly as CKM stages advance [2, 3]. The core pathophysiology of CKM is not driven by a single pathway but rather by the combined effects of metabolic dysregulation, chronic inflammation, oxidative stress, microvascular dysfunction, and endothelial impairment [4, 5]. Against the backdrop of the global rise in metabolic diseases, identifying high-risk individuals across CKM stages has become an essential clinical need for advancing precision prevention and targeted intervention.
In recent years, remnant cholesterol (RC) has received increasing attention due to its independent role in the development of atherosclerosis [6, 7]. As the cholesterol content of triglyceride-rich lipoproteins, RC can be rapidly taken up by macrophages, thereby accelerating foam cell formation, amplifying inflammatory signaling, and promoting plaque instability – mechanisms that differ from those represented by traditional low-density lipoprotein cholesterol (LDL-C) [8, 9]. Meanwhile, C-reactive protein (CRP) is a sensitive marker of systemic inflammation, and its elevation reflects multiple pathological states, including endothelial injury, microcirculatory dysfunction, and insulin resistance [10, 11]. These two risk factors frequently interact during the onset and progression of CKM. However, neither marker alone is sufficient to capture the combined burden of metabolic abnormalities and inflammatory activation. The remnant cholesterol inflammatory index (RCII) was proposed to address this gap, aiming to integrate RC-related lipid residual risk with CRP-related inflammatory burden and thereby reflect metabolic-inflammatory interplay [12]. Previous studies have shown that RCII is positively associated with all-cause mortality, cardiovascular mortality, cancer-related mortality, and the progression of frailty; nevertheless, existing evidence has mainly focused on general or specific metabolic disease populations, and the value of RCII for risk stratification within the CKM framework remains insufficiently understood [13, 14]. Moreover, it remains unclear whether RCII consistently predicts long-term mortality across CKM stages and whether its dose-response relationship exhibits non-linear characteristics.
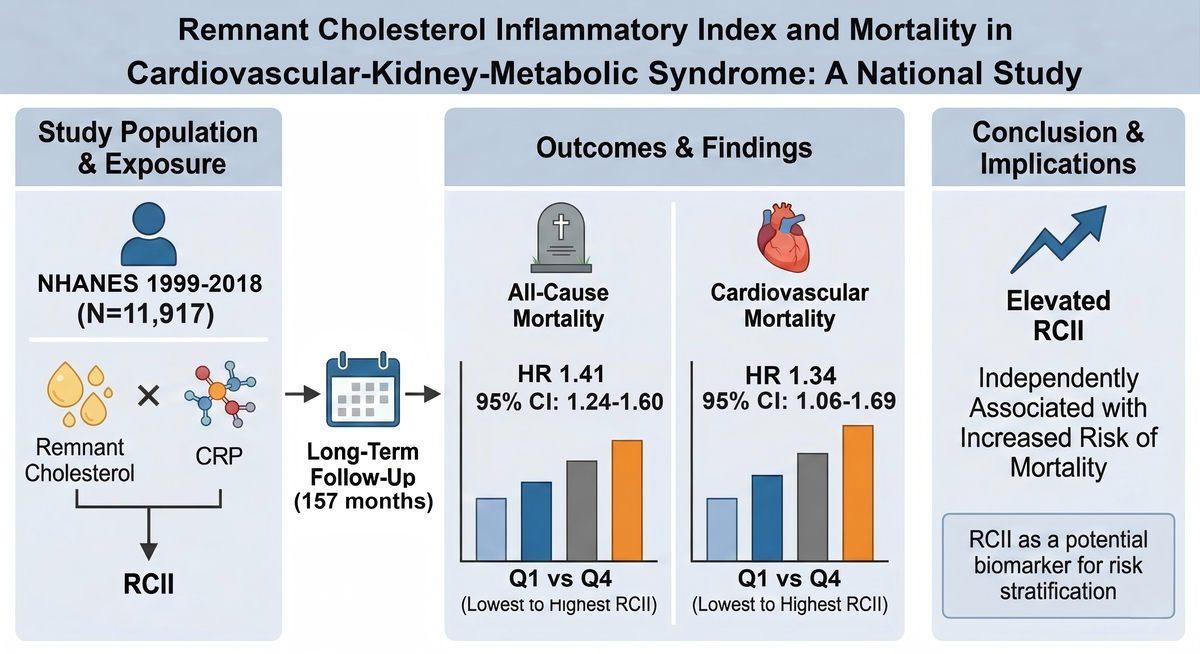
Therefore, this study utilized data from the 1999-2018 National Health and Nutrition Examination Survey (NHANES) and its linked mortality records to systematically evaluate the associations of RCII with long-term all-cause and cardiovascular mortality in individuals with CKM. We further explored potential non-linear relationships and risk differences across CKM stages. Through this work, we aim to determine whether RCII can serve as a useful complementary biomarker for CKM risk stratification and to provide epidemiological evidence supporting early identification of high-risk individuals and optimization of cardiometabolic disease prevention strategies.
Material and methods
Study design and data source
This study was based on data from ten cycles (1999–2018) of the NHANES. NHANES uses a stratified, multistage, probability sampling design and integrates questionnaires, physical examinations, and laboratory tests to evaluate the health and nutritional status of the U.S. civilian population. All NHANES protocols were approved by the National Center for Health Statistics (NCHS) Ethics Review Board, and written informed consent was obtained from all participants. The present study followed the STROBE reporting guidelines.
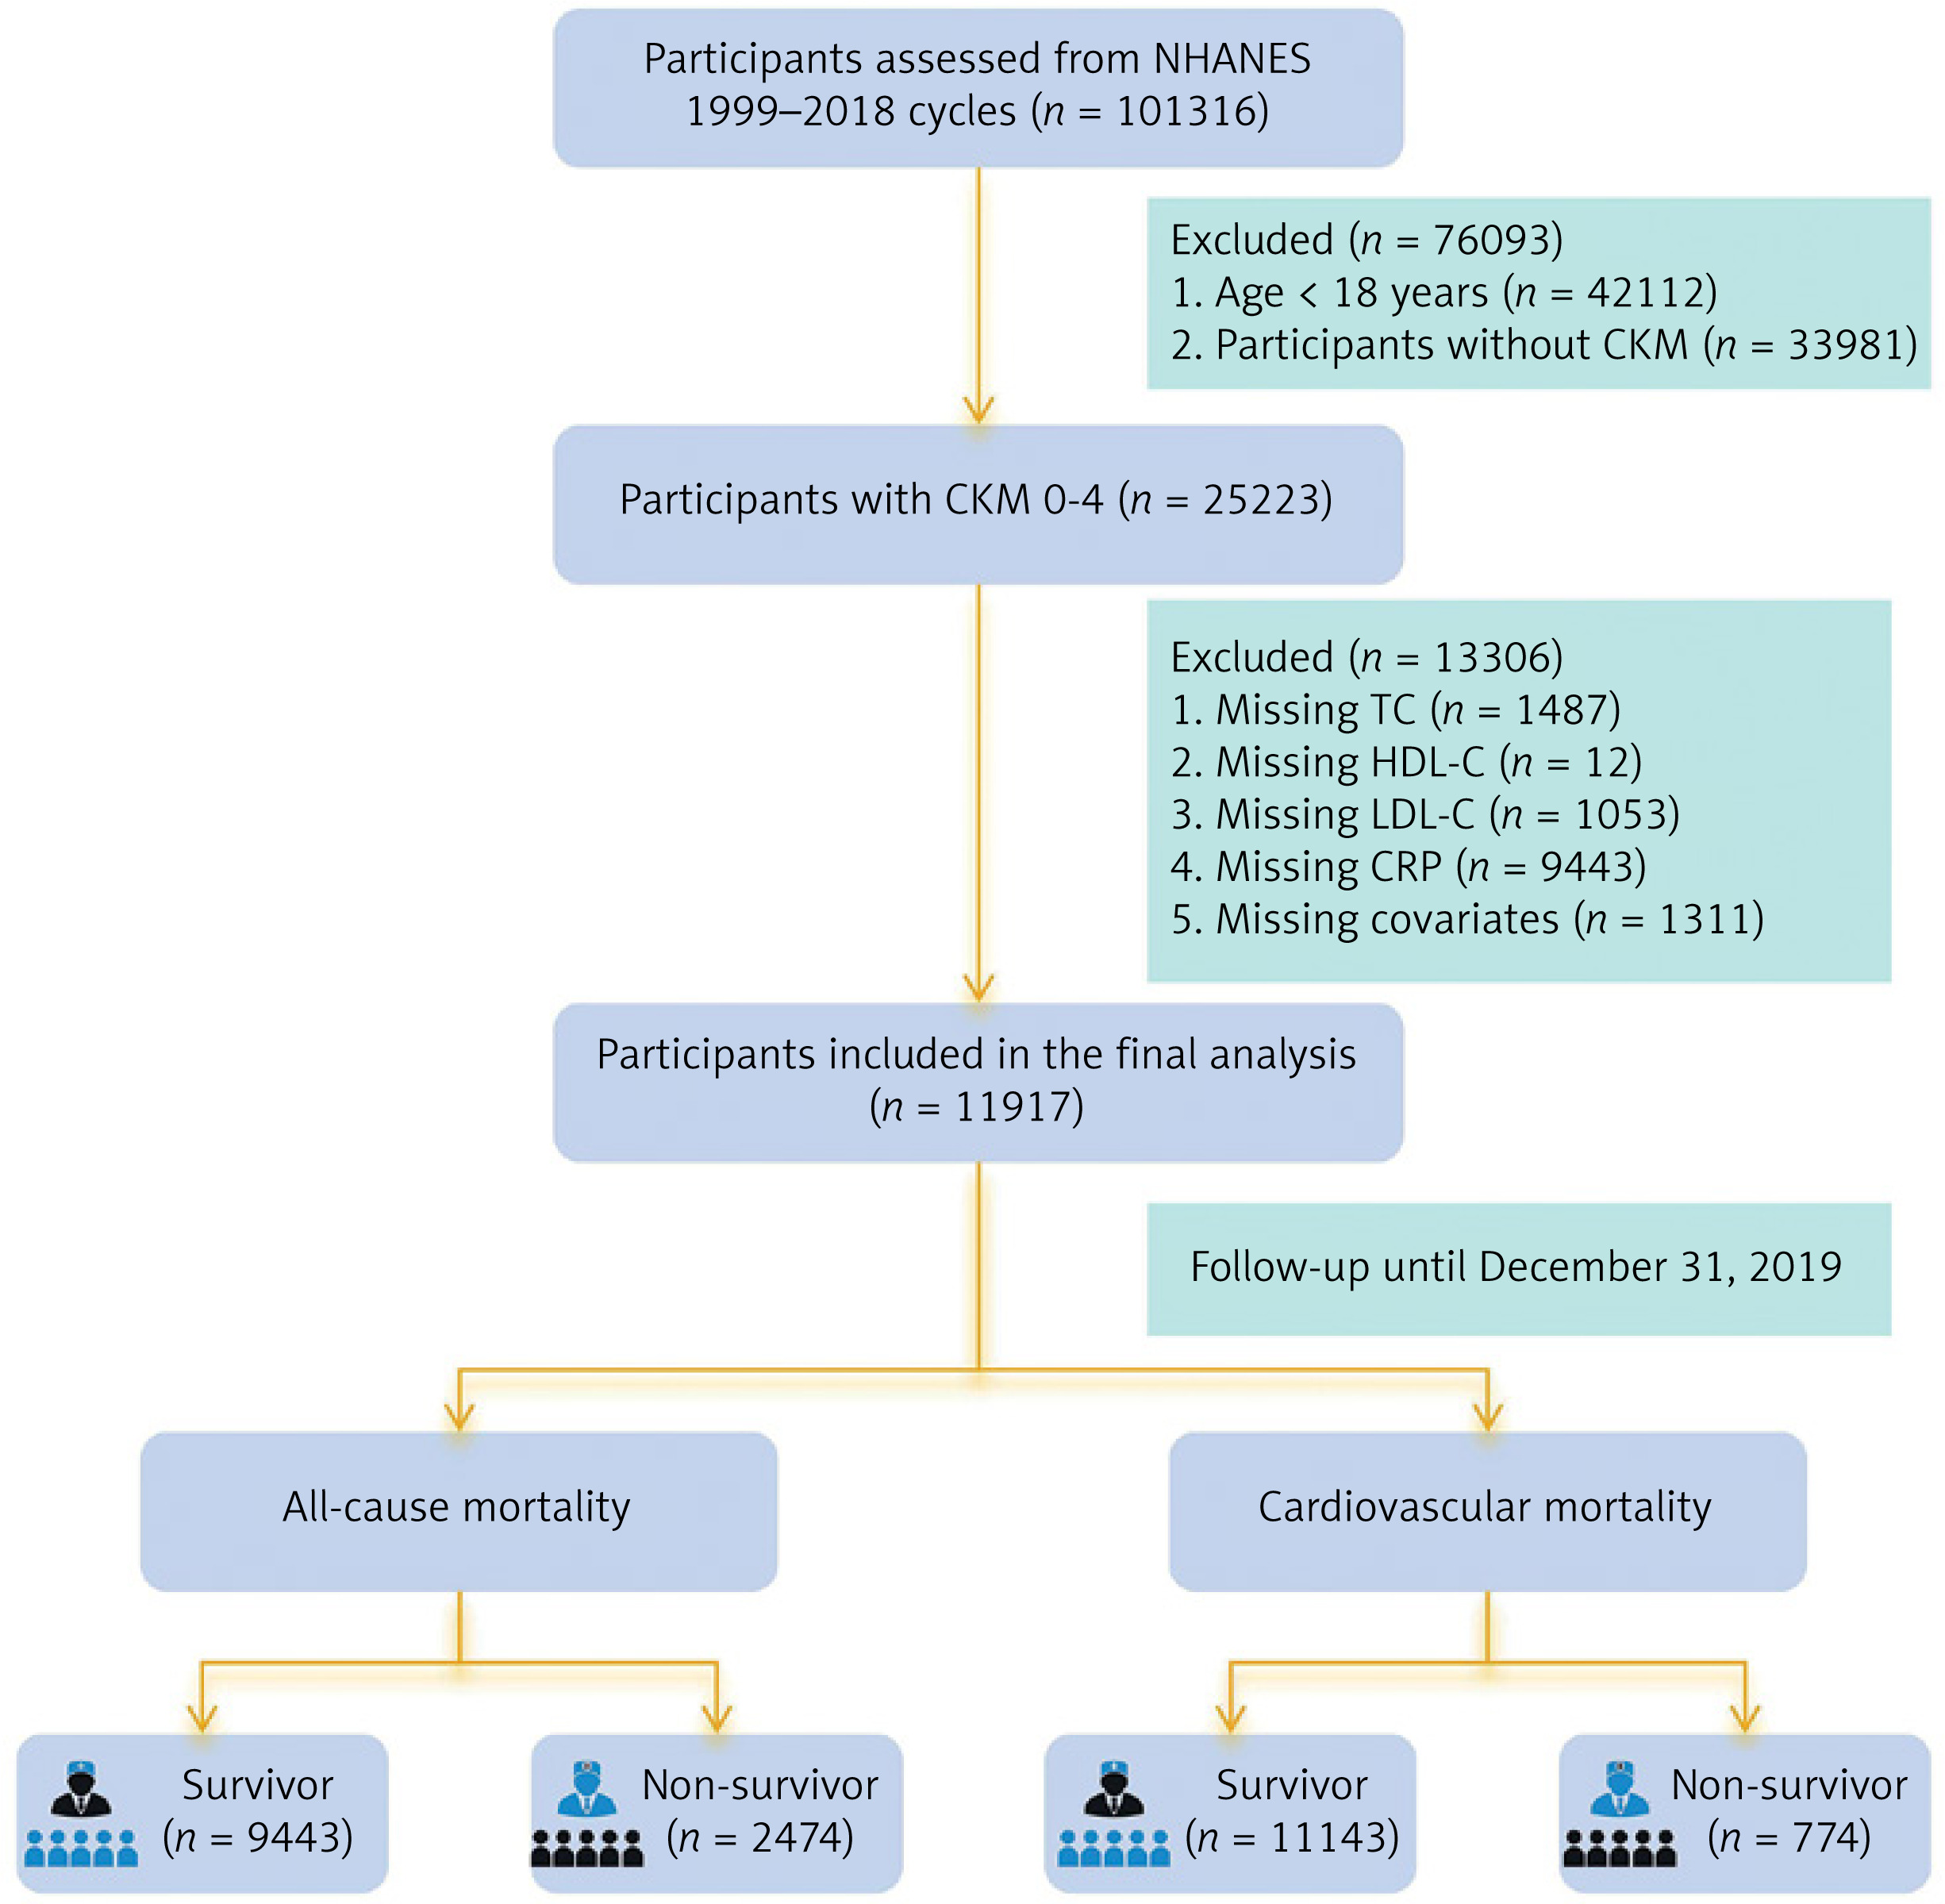
The inclusion criteria were: (1) age ≥ 18 years; and (2) diagnosis of CKM. The operationalization of CKM staging followed a hierarchical approach based on the American Heart Association (AHA) framework [1]. Specific clinical indicators and laboratory thresholds for CKM conditions are detailed in Supplementary Table SI, while the comprehensive algorithm for assigning participants to CKM Stages 0 to 4 is provided in Supplementary Table SII. For individuals meeting criteria for multiple stages, the most advanced stage was assigned to ensure mutually exclusive categorization. For example, participants with both chronic kidney disease (CKD) and established clinical cardiovascular disease (CVD) were classified as Stage 4. The final staging included: Stage 0 (no metabolic risk factors), Stage 1 (excess adiposity), Stage 2 (metabolic risk factors or moderate-to-high-risk CKD), Stage 3 (subclinical cardiovascular structural or functional abnormalities or very high-risk CKD), and Stage 4 (established clinical CVD). Exclusion criteria were: (1) missing RCII component measurements; (2) missing mortality follow-up data; and (3) missing key covariates. After stepwise screening, a total of 11,917 participants were included in the final analysis. The participant selection process is illustrated in Figure 1.
Calculation of RC and RCII
Given that CRP measurements in NHANES are reported in mg/dL, remnant cholesterol (RC) was calculated using the difference method: RC = TC – (HDL-C + LDL-C) [15]. In clinical fasting states, this estimation is numerically equivalent to the cholesterol content of very-low-density lipoproteins (VLDL-C ≈ TG/5). Subsequently, RCII was derived as the product of RC and CRP (RCII = RC × CRP) [16], effectively representing a scaled product of triglyceride-rich lipoprotein cholesterol and systemic inflammation. To improve interpretability, RCII was standardized (Z-score transformed) in Cox models as per SD increase. In this study, RCII was analyzed both as a continuous variable and categorized into four quartiles (Q1–Q4) based on its distribution. In the total study population, the median RCII was 4.88, with an interquartile range (IQR) of 1.61–13.42: Q1 (< 1.61), Q2 (1.61–4.88), Q3 (4.88–13.42), and Q4 (≥ 13.42), with Q1 serving as the reference group.
Covariates
Covariates were selected based on previous literature and clinical relevance, and included: age, sex, race, marital status, education level, poverty income ratio (PIR; categorized as < 1.3, 1.3–3.5, ≥ 3.5), body mass index (BMI; < 25, 25–30, ≥ 30 kg/m2), smoking (≥ 100 cigarettes in lifetime), and drinking (≥ 12 alcoholic drinks in the past year). Comorbidities included hypertension, diabetes, cancer history, stroke history, chronic kidney disease (CKD), and cardiovascular diseases (including coronary heart disease, angina, myocardial infarction, and heart failure, CVDs), identified through self-reported questionnaires and physician diagnoses. Laboratory variables included total cholesterol (TC), triglycerides (TG), high-density lipoprotein cholesterol (HDL-C), LDL-C, CRP, estimated glomerular filtration rate (eGFR), uric acid (UA), and glycated hemoglobin (HbA1c).
Outcomes
The primary outcome was all-cause mortality, defined as death from any cause according to the National Death Index (NDI). The secondary outcome was cardiovascular mortality, defined using ICD-10 codes: I00-I09, I11, I13, I20-I51 (heart diseases) and I60-I69 (cerebrovascular diseases). Follow-up time was calculated from the date of health examination to the date of death or December 31, 2019, whichever occurred first.
Statistical analysis
Baseline characteristics were summarized according to mortality status. Continuous variables were presented as medians with interquartile ranges (IQRs) and compared using the Wilcoxon rank-sum test. Categorical variables were expressed as counts and percentages and compared using the χ2 test. Kaplan-Meier survival curves and log-rank tests were used to examine survival differences across RCII quartiles. Cox proportional hazards regression models were applied to assess the association between RCII and mortality outcomes, and three models were constructed: Model 1: unadjusted; Model 2: adjusted for age, sex, race, marital status, education, smoking, drinking, PIR, and BMI; Model 3: adjusted for Model 2 + hypertension, CKD, CVDs, diabetes, stroke, cancer, HbA1c, UA, and eGFR. Proportional hazards assumptions were tested using Schoenfeld residuals (p > 0.05). Restricted cubic splines (RCS) with four knots were used to evaluate potential nonlinear associations between RCII and mortality, adjusting for covariates in Model 3. Subgroup analyses were conducted according to age, sex, PIR, BMI, and comorbidities. Interaction terms were tested using Wald statistics (p for interaction < 0.05). All analyses were performed using R software (version 4.2.3), and two-sided P-values < 0.05 were considered statistically significant.
Results
Baseline characteristics
A total of 11,917 participants with CKM stages 0–4 were included in this study. During a median follow-up of 157 months, 2,474 all-cause deaths (20.8%) and 774 cardiovascular deaths (6.5%) were recorded. As shown in Table I, compared with survivors, individuals who died exhibited overall more unfavorable clinical and sociodemographic characteristics, including significantly older age (median age: 72 vs. 43 years), higher proportions of males and non-Hispanic Whites, lower educational attainment, and lower poverty income ratio (all p < 0.001). Although the age of decedents was significantly higher than survivors, this finding aligns with the biological pattern of mortality observed in long-term follow-up studies. To account for age-related differences, we adjusted for age in the subsequent multivariable regression analysis. In addition, decedents showed a substantially heavier burden of chronic diseases, with significantly higher prevalence of hypertension, diabetes, CKD, CVDs, cancer, and stroke (all p < 0.001). Laboratory findings indicated more pronounced metabolic and inflammatory abnormalities among decedents. Levels of CRP, TG, UA, and HbA1c were significantly elevated, whereas eGFR was markedly reduced, suggesting more severe renal impairment (all p < 0.001). Although traditional lipid profiles showed limited differences, RCII levels were significantly higher among decedents in both mortality outcomes (all p < 0.001), reflecting a greater burden of remnant cholesterol and inflammation. Overall, CKM participants who died displayed an adverse biological phenotype characterized by high inflammation, high metabolic burden, and reduced renal function, underscoring the potential relevance of RCII in disease progression.
Table I
Baseline characteristics of CKM participants according to survival status
[i] Continuous variables are presented as medians (interquartile ranges, IQR); categorical variables are counts (%); CVDs – cardiovascular diseases (including coronary heart disease – angina – myocardial infarction – and heart failure), CKD – chronic kidney disease, PIR – poverty income ratio, BMI – body mass index, TG – triglycerides, TC – total cholesterol, LDL-C – low-density lipoprotein cholesterol, HDL-C – high-density lipoprotein cholesterol, CRP – C-reactive protein, HbA1c – glycated hemoglobin, UA – uric acid, eGFR – estimated glomerular filtration rate, RCII – remnant cholesterol inflammatory index.
Stratified effects of RCII on survival probability
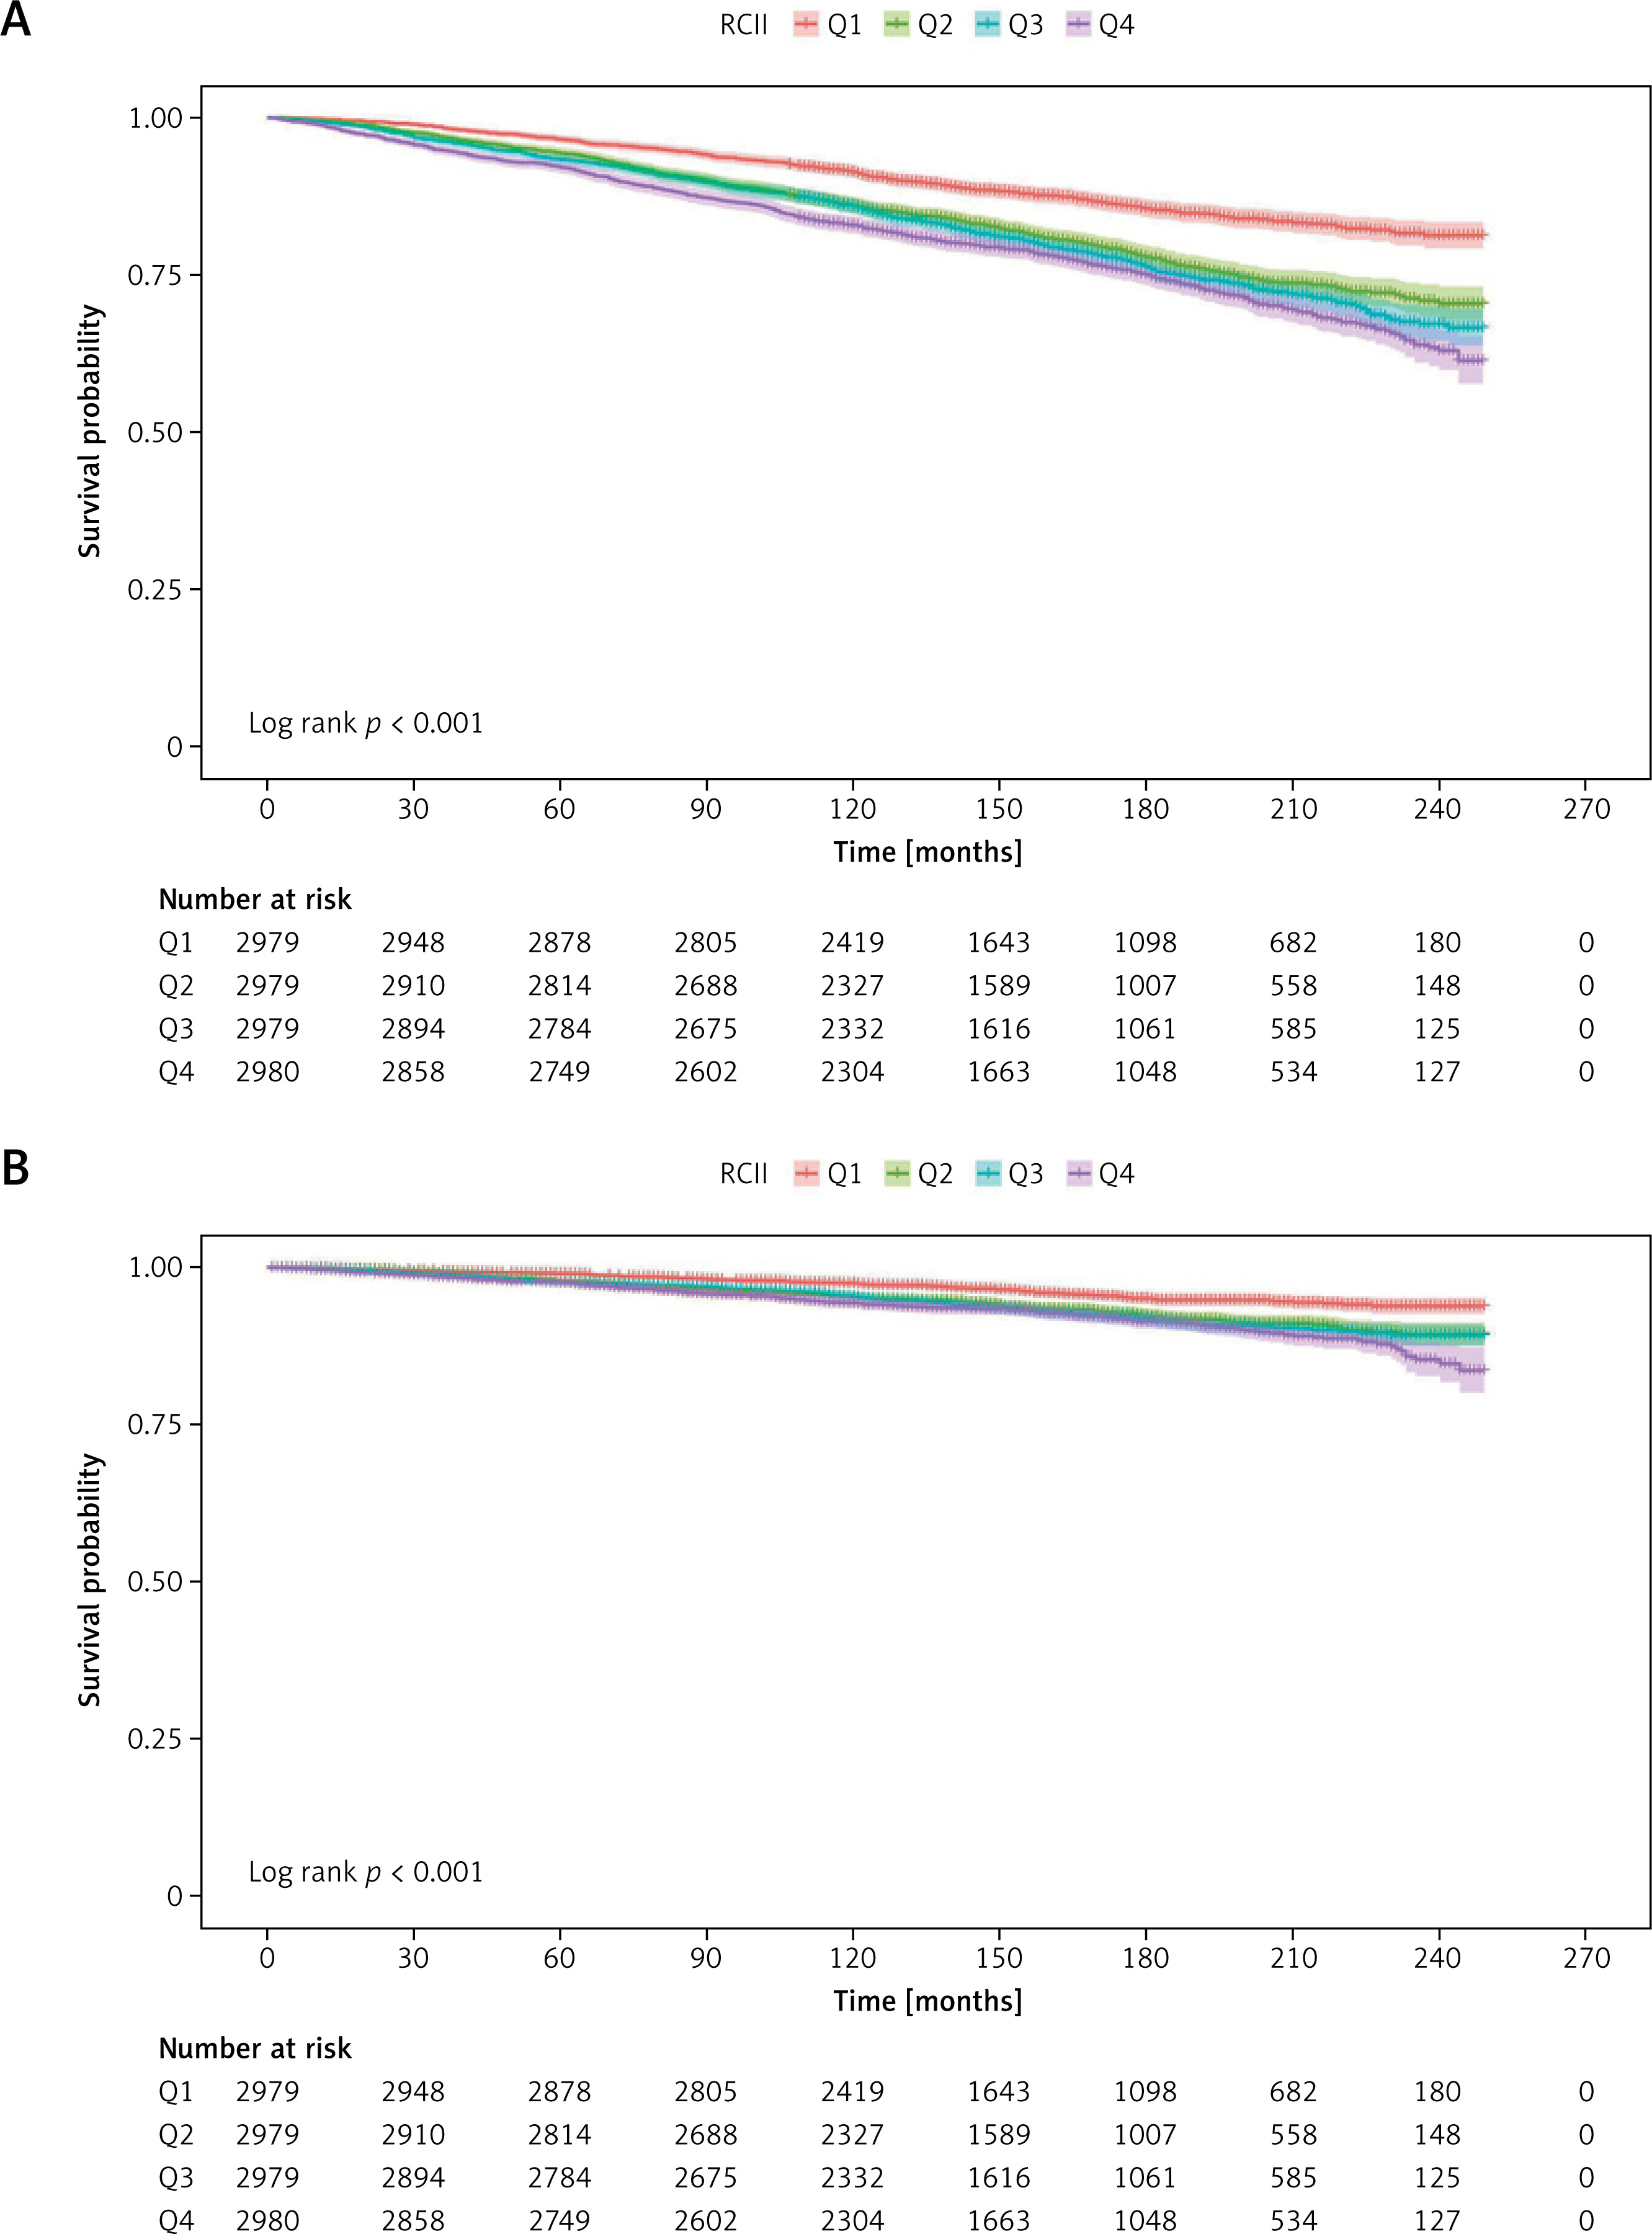
Kaplan-Meier survival curves revealed significant stratification effects of RCII on mortality outcomes (Figure 2). For both all-cause (Figure 2 A) and cardiovascular mortality (Figure 2 B), participants in higher RCII quartiles had consistently lower survival probabilities (log-rank test, all p < 0.001). Notably, individuals in the highest quartile (Q4) exhibited early separation of survival curves, with persistently lowest survival rates throughout the follow-up, indicating the sustained adverse prognostic impact of elevated RCII levels.
Cox regression models for RCII and mortality risk
Multivariable Cox regression analyses further confirmed the independent predictive value of RCII (Table II). In the unadjusted model, each 1-standard-deviation increase in RCII was associated with 10% higher all-cause mortality risk and 11% higher cardiovascular mortality risk (both p < 0.001). After sequential adjustment for demographic characteristics, lifestyle factors, socioeconomic status, and chronic diseases, the associations remained robust: in the fully adjusted model, the risks increased by 7% and 8%, respectively (both p < 0.001). Quartile-based analyses demonstrated consistent trends. Compared with Q1, participants in Q4 had 41% higher all-cause mortality risk and 34% higher cardiovascular mortality risk in the fully adjusted model. All trend tests were statistically significant (p < 0.001), supporting a stable and sustained positive association between RCII and mortality risk.
Table II
Association between RCII and all-cause and cardiovascular mortality in Cox proportional hazards models
[i] Model 1: Unadjusted. Model 2: adjusted for age, sex, race, marital status, education, smoking, drinking, PIR, BMI. Model 3: adjusted for Model 2 covariates plus hypertension, CKD, CVDs, diabetes, stroke, cancer, HbA1c, UA, eGFR. CVDs – cardiovascular diseases (including coronary heart disease – angina – myocardial infarction – and heart failure), CKD – chronic kidney disease, PIR – poverty income ratio, BMI – body mass index, HbA1c – glycated hemoglobin, UA – uric acid, eGFR – estimated glomerular filtration rate, RCII – remnant cholesterol inflammatory index.
Dose-response relationship between RCII and mortality
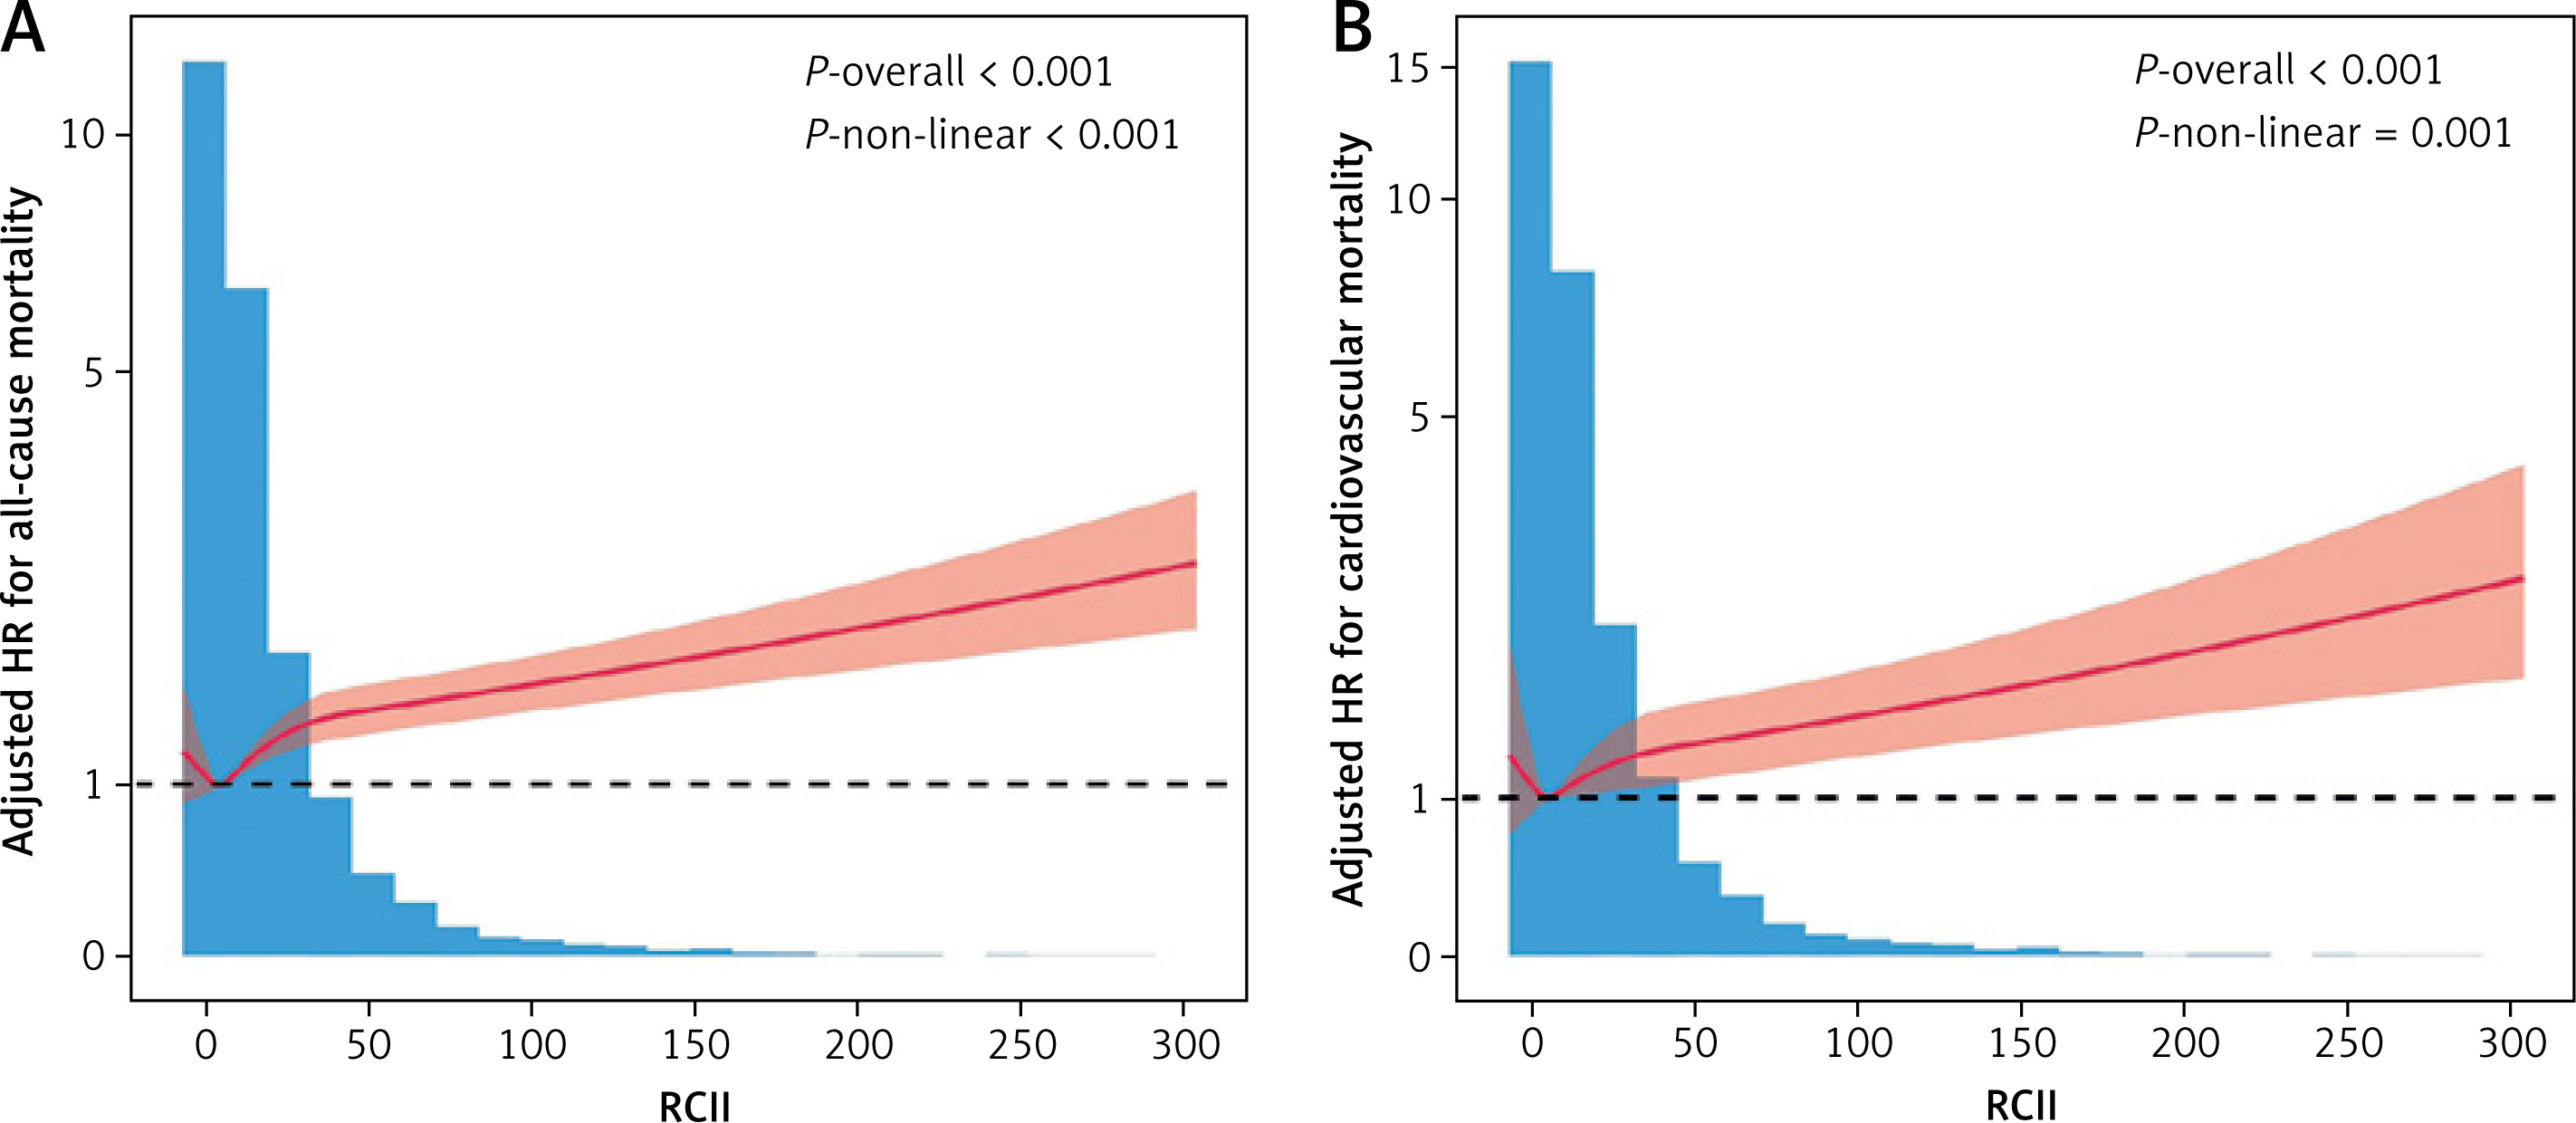
Restricted cubic spline models were used to further examine the continuous relationship between RCII and mortality risk (Figure 3). After full adjustment, RCII displayed significant nonlinear associations with all-cause (Figure 3 A) and cardiovascular (Figure 3 B) mortality (p -overall < 0.001; p -nonlinear ≤ 0.001). These findings suggest that the relationship between RCII and mortality is not simply linear but exhibits a threshold-like pattern: the curve remains relatively flat at low RCII levels, while showing a steadily increasing trend at moderate to high levels, indicating an incremental rise in mortality risk with higher RCII.
Subgroup and interaction analyses
Prespecified subgroup analyses showed that the positive associations between RCII and both all-cause and cardiovascular mortality were consistent across various clinical and demographic subgroups, including age categories, BMI classifications, PIR groups, sex, smoking status, drinking habits, and major chronic conditions (Table III). Notably, in different age groups (< 65 years and ≥ 65 years), the associations between RCII and all-cause and cardiovascular mortality remained stable (p for interaction > 0.05), suggesting that despite baseline age differences, RCII serves as a universally applicable predictor of mortality across age groups. None of the interaction tests reached statistical significance (all p for interaction > 0.05), indicating that the predictive value of RCII remained stable and generalizable across different population subgroups.
Table III
Subgroup analyses of the association between RCII and mortality outcomes
Discussion
This study based on NHANES 1999-2018 data systematically evaluated the relationship between the RCII and long-term mortality risks among individuals with CKM, and for the first time incorporated RCII into a stratified analysis within the CKM framework. The results demonstrated a persistent and significant positive association between elevated RCII and both all-cause and cardiovascular mortality, and this association remained robust even after rigorous adjustment for demographic characteristics, metabolic indicators, and chronic disease burden. RCS analyses further revealed the continuous risk pattern of RCII, while subgroup analyses confirmed the consistency of this predictive effect across diverse population groups, suggesting that RCII may serve as a clinically valuable composite metabolic-inflammatory marker in CKM risk evaluation.
The significance of RCII lies in its integration of both remnant cholesterol and inflammatory burden, two key contributors to CKM pathophysiology. Remnant cholesterol, the cholesterol content remaining after triglyceride-rich lipoprotein degradation, can be rapidly taken up by macrophages and promote foam cell formation – an important driver of atherosclerosis [17–19]. Simultaneously, CRP reflects the degree of systemic inflammatory activation and may accelerate vascular injury by upregulating endothelial adhesion molecules, promoting oxidative stress, and disrupting insulin signaling [20, 21]. Persistent elevation of RCII may represent a sustained high residual lipid-high inflammation burden. Such a state may impair microcirculatory function, exacerbate endothelial injury, activate coagulation and fibrinolytic pathways, and ultimately increase mortality risk [22–24]. Furthermore, the integration of RC and CRP into a single index (RCII) is conceptually grounded in the synergistic interplay between lipid-driven atherosclerosis and systemic inflammation. While either RC or CRP alone provides significant prognostic information, RCII offers a more comprehensive reflection of the ‘metabolic-inflammatory burden’ that characterizes CKM progression. Rather than serving as a simple substitute for its individual components, RCII functions as a composite marker that captures the cross-talk between these two core pathological pathways [25]. This integrated approach aligns with the systemic nature of CKM syndrome, which involves multiple overlapping mechanisms beyond a single biological axis. In this CKM cohort, individuals who died exhibited higher levels of CRP, uric acid, triglycerides, and HbA1c, along with significantly reduced renal function, suggesting that the combined metabolic-inflammatory effects reflected by RCII play a central role in CKM progression and prognosis.
The clinical relevance of these findings is underscored by the current shift toward addressing all apoB-containing lipoproteins in cardiovascular prevention [26]. Our results suggest that RCII, by integrating lipid-related residual risk and systemic inflammatory burden, may serve as a practical, cost-effective tool for risk stratification within the CKM framework. RCII identifies high-risk individuals who might appear “low-risk” based on traditional LDL-C targets alone [27]. In clinical practice, an elevated RCII could signal the need for more aggressive primordial and primary prevention strategies, such as intensified lifestyle modifications or targeted pharmacological interventions aimed at both dyslipidemia and low-grade inflammation. Notably, although the baseline age of the decedent group was significantly higher in this study, the multivariable Cox models demonstrated that the significant risk associated with RCII remained robust after rigorous adjustment for age as a core covariate. This finding emphasizes that in CKM patients, the metabolic-inflammatory burden captured by RCII contributes to mortality risk independently of traditional age factors. Furthermore, this consistency persists across younger populations, suggesting that RCII can serve as a potent tool for early CKM risk assessment, especially before the accumulation of age-related comorbidities. This is further supported by our observation that the predictive effect of RCII remained consistent across all CKM stages, even in early stages before overt cardiovascular events occur. Consequently, RCII holds significant public health implications for identifying high-risk individuals early in the disease course.
CKM syndrome highlights the cumulative risk burden of metabolic, renal, and cardiovascular diseases across the lifespan [28]. In this study, individuals with elevated RCII concurrently exhibited more severe chronic disease burden, poorer renal function, higher inflammation levels, and more adverse socioeconomic profiles. These characteristics align with the core features of CKM risk stratification, suggesting that RCII may serve as an important supplementary indicator for understanding adverse health status in CKM and may enhance understanding of the metabolic-inflammatory processes underlying CKM progression. Furthermore, RCS analyses revealed a nonlinear trend between RCII and mortality risk, with a more pronounced increase at higher RCII levels. This may reflect a physiological state approaching a “biological compensation threshold” under sustained metabolic stress and inflammatory burden. When RCII surpasses a certain level, pathological processes such as endothelial injury, coagulation activation, insulin resistance, and microcirculatory dysfunction may intensify simultaneously, accelerating disease deterioration [29, 30]. These findings deepen the understanding of RCII’s biological significance and highlight the need for clinical attention to individuals with high RCII levels to enable early intervention. Additionally, identifying the high-RCII threshold and its potential metabolic-inflammatory turning point may help clinicians obtain more intuitive risk signals during the comprehensive assessment of CKM patients, thereby encouraging greater focus on inflammation control, lifestyle modification, and integrated improvement of cardiometabolic and renal markers.
Despite its strengths, this study has several limitations. First, RC levels were calculated using a standard formula (TC – HDL-C – LDL-C) rather than direct measurement. As this estimation approximates VLDL-C (or TG/5), RCII essentially reflects a scaled product of triglyceride-rich lipoprotein cholesterol and inflammation, inheriting the inherent limitations of the Friedewald formula and its dependence on triglyceride levels. Second, the reliance on NHANES data precluded the use of certain clinical diagnostics, such as 12-lead ECG or advanced imaging, which may affect the precision of CKM staging (especially Stage 3). However, NHANES remains a validated source for population-level risk assessment. Third, we did not perform formal tests for incremental predictive utility – e.g., C-statistics, the net reclassification index (NRI), or integrated discrimination improvement (IDI) – as the primary objective was to evaluate independent associations and dose-response patterns. Finally, the observational design precludes causal inference, and the findings – based on a U.S. cohort – require external validation in diverse populations with different racial and disease profiles.
In conclusion, this study demonstrates that elevated RCII is significantly associated with increased all-cause and cardiovascular mortality risks among individuals with CKM, and these associations remain consistent across clinical subgroups. As a composite metabolic-inflammatory indicator derived from routinely available laboratory measurements, RCII holds potential value for future CKM risk stratification and clinical decision-making. Future research should further evaluate the incremental predictive utility of RCII in risk models and explore intervention strategies targeting individuals with elevated RCII.