Introduction
The International Diabetes Federation (IDF) reported that approximately 500 million people worldwide currently have diabetes, of whom 116 million live in China [1]. A Chinese diabetes epidemiology study published in 2017 reported that 15.4% of patients with type 2 diabetes mellitus (T2DM) were overweight, 21.1% were obese, and the sum of the two exceeded one-third of the total number [2]. An estimated 80% to 90% of people with T2DM have been reported to be overweight or obese in Canada [3].
Adult weight gain has been associated more with visceral adipose tissue in middle age rather than abdominal subcutaneous adipose tissue [4]. Visceral abdominal adipose tissue is associated with complications of hypertension and cardiovascular risk indicators, especially in younger patients and patients with mild-to-moderate hypertension [5, 6].
Obese patients with T2DM are also thought to have an increased risk of cardiovascular and cerebrovascular disease [7]. Women with a body mass index (BMI) between 18.5 and 25 kg/m2, which is within the normal range, but with high levels of body fat or truncal obesity were more likely to have cardiovascular disease than women with less abdominal adipose tissue [8]. Sironi et al. [9], in a study with 113 participants, found that visceral fat (VF) was positively correlated with a risk of coronary heart disease risk and negatively correlated with insulin sensitivity. Higher abdominal fat levels are also reported to be associated with metabolic disorders, such as insulin resistance, dyslipidaemia, and inflammation. The accumulation of abdominal VF was not only the cause of insulin resistance but also inhibited β-cells from secreting insulin [10–12]. Sandeep et al. showed that VF was more likely to cause insulin resistance [13]. Fain et al. showed that abdominal subcutaneous fat and VF were related to insulin resistance [14]. However, VF was more closely related to the homeostatic model assessment of insulin resistance index (HOMA-IR) and could lead to an increased risk of dementia [15]. Even in patients with early T2DM, being overweight or obese was reported to potentially lead to atrophy of the cerebral cortex, destruction of brain white matter integrity, and cognitive dysfunction [16]. Therefore, a combination of obesity and T2DM poses a serious health risk. One study showed that a > 5% weight loss significantly improved glycated haemoglobin (HbA1c), blood pressure, and blood lipid levels [17].
The Look AHEAD study, which used machine learning methods, found that cardiovascular events were significantly reduced after lifestyle interventions for weight loss [18]. The removal of excess fat from the liver and pancreas normalised insulin response. It was also suggested that reducing excess fat in these organs was associated with the recovery of islet function in many individual β-cells, meaning that weight loss may cause a re-differentiation of β-cells that had lost their insulin-secreting function [19]. Therefore, weight loss in patients with T2DM is very important for reducing VF. Current weight loss methods include lifestyle changes (reducing food intake, exercise), medications, and bariatric surgery. However, lifestyle changes are difficult to achieve in the long term. Oral medicines, such as lorcaserin, have been banned by the US Food and Drug Administration (FDA) because they can cause tumours [20]. Bariatric surgery can cause many complications such as bleeding, malnutrition, anastomotic fistula, gastro-oesophageal reflux, intestinal obstruction, anastomotic ulcers, and internal hernias [21, 22]. It is important to choose a weight loss method that minimises physical harm.
Several studies have used glucagon-like peptide-1 (GLP-1) analogues, such as liraglutide and dulaglutide, in the treatment of obese patients with T2DM [23–25]. GLP-1 has been shown to reduce weight and blood glucose levels. Beinaglutide (7–36) is 100% homologous to human GLP-1. It has been used in China for 4 years and is approved for diabetes and obesity [26]. This study evaluates beinaglutide for weight loss and visceral fat reduction in obese T2DM patients.
Material and methods
Study participants
This study was approved by the Ethics Committee of the First Affiliated Hospital of Datong University (the fifth hospital in Datong City). All procedures were followed according to the Helsinki Declaration of 1964, revised in 2013. Participants were inpatients and outpatients from the department of endocrinology and metabolism at the First Affiliated Hospital of Datong University, Shanxi Province, China. The study was conducted from July 2018 to December 2019. Informed written consent was obtained from all patients before being enrolled in the study. In total, 107 overweight or obese patients with T2DM (females: n = 42; males: n = 65) were enrolled. The inclusion criteria included patients diagnosed with T2DM, consistent with the 1999 WHO diabetes diagnostic and classification criteria, who had an HbA1c ≥ 7% and who were ≥ 18 years old. The exclusion criteria included the following: acute or chronic infectious diseases, cancer or undergoing chemotherapy, severe kidney or liver cirrhosis, liver tumour disease, hypercortisolism, treatment with glucocorticoids, major depression or other serious mental illness, history of pancreatitis, type 2 multiple endocrine neoplasia, and patients with a family or personal history of familial thyroid cancer. Some study patients had both macro- and microvascular disease. Two patients who had been treated with liraglutide for one year were diagnosed with GLP-1 primary resistance but were still included in the study.
Study procedure
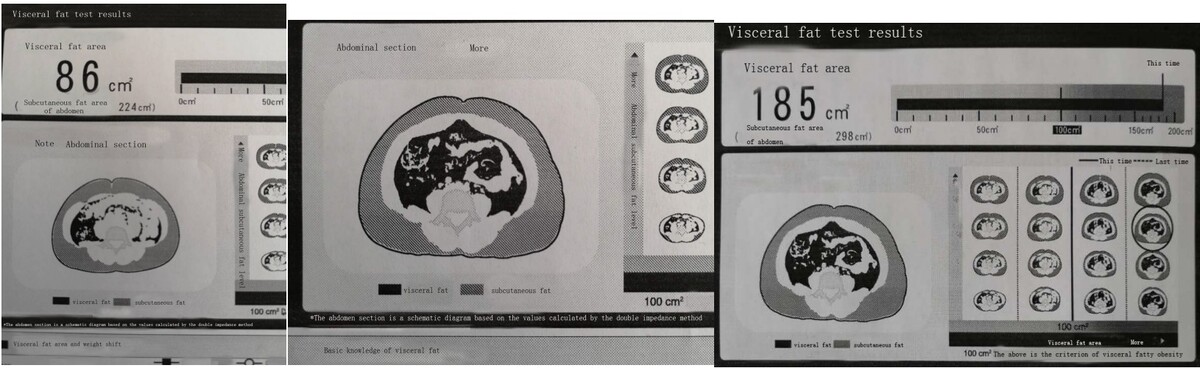
Using a pen device, patients were initially treated with a daily dose of 0.02 mg beinaglutide subcutaneously injected into the abdomen 10 min before each of their three daily meals. Subsequently, an increased dose of 0.02 mg per meal was gradually added every 2 days until the patient’s appetite and food intake decreased significantly; at this point, the dose was maintained for 12 weeks. Body weight, areas of VF, and fasting blood glucose levels were reviewed every 4 weeks. After 12 weeks, HbA1c, blood lipids, body weight, VF areas, fasting blood glucose, blood lipids, insulin resistance index, free fatty acids, hip, waist, and neck circumference, BMI, and urinary albumin/creatinine (ACR) were reviewed. VF was determined using a DUALSCAN instrument (Japan Omron model HDS-2000), which has been reported to have a good correlation with VF volume measured using computed tomography scans [27]. Blood pressure measurements were taken using a medical electronic sphygmomanometer, HBP-1100U (Omron Dalian Co. Ltd.). For height and weight measurements taken to determine BMI, we used a physical examination scale, HNH-318 (Shenzhen Shuangjia Medical Technology Co. Ltd.) Waist circumference: the horizontal circumference through the navel centre, or the circumference of the midpoint line between the lowest rib point and the upper edge of the iliac crest, measured with a soft ruler at the end of expiration and before the beginning of inspiration. The soft ruler is attached to the skin and measured in a circle at the horizontal position 3 cm above the navel. Hip circumference: the horizontal girth of the most prominent part of the hip back, measured with a soft ruler close to the body. Neck circumference was measured around neck using a soft tape. BMI was calculated as weight divided by height squared (kg/m2). HbA1c was measured by high-performance liquid chromatography method using the LD-600 system (Labnovation Technologies, INC., Shenzhen, China); lipids and glucose levels were determined enzymatically using a Hitachi 7600 automatic biochemical analyser (Hitachi, Tokyo, Japan), which automatically measured and uploaded the generated data. Research nurses collected all laboratory indicators and entered the data into an electronic database. Urine ACR was measured using an Afinion analyser and supporting reagents. Fatty acid levels were determined using a biochemical method (Ningbo Meikang Biotechnology Co. Ltd., batch number 190424101). Each patient received comprehensive training and titration instructions from registered nurses. No special requirements were imposed on the patients’ diets or exercise regimes during the 12-week treatment period.
Primary and secondary endpoints
At week 12, three primary endpoints were tested: (1) changes in VF, (2) changes in body weight, and (3) changes in HbA1c. Secondary endpoints included changes in waist, neck, and hip circumferences, BMI, fasting blood glucose, fasting insulin, and urinary albumin/creatinine (ACR). Secondary endpoints also included cardiovascular risk factors such as heart rate, blood-free fatty acids, insulin resistance index (HOMA-IR), changes in fasting lipid levels (total cholesterol (TC), high-density lipoprotein cholesterol (HDL-C), low-density lipoprotein cholesterol (LDL-C), triglycerides (TG)), and treatment safety.
Safety endpoints
Safety endpoints included a physical examination, electrocardiogram, and adverse events.
Statistical analysis
Data were entered using Microsoft Excel (2003). Normality test was performed by Kolmogorov-Smirnov test in SPSS software (version 18.0, SPSS Inc., Chicago, USA). Paired two-tailed t-test was performed using the data before and after treatment. Clinical measurement data with mean plus or minus standard deviation (x ± SD) were assessed. Data that did not conform to normal distribution were expressed as the median (quartiles, P25, and P75). A P-value < 0.05 was considered statistically significant.
Results
Baseline characteristics
The patients’ baseline characteristics were as follows: the average age of patients was 42.7 ±12.6 years, the average VF area was ≥ 100 cm2, the average BMI was ≥ 27 kg/m2, and the duration of diabetes ranged from 0.3 to 30 years. The mean HbA1c level was 8.8 ±2.3%, mean BMI was 32.8 ±5.2 kg/m2, and the VF area was 150.4 ±36.2 cm2. Overall, 32 patients did not take hypoglycaemic medication, whereas other patients took two or three types of hypoglycaemic medications, including insulin. Some patients were found to have treated or untreated dyslipidaemia or hypertension, and some patients were prescribed between one and three antihypertensive medications (Table I).
Table I
Changes in primary and secondary endpoints at baseline and at week 12
After beinaglutide treatment
As shown in Tables I and II, after 12 weeks, beinaglutide treatment showed significant decreases in HbA1c (8.8 ±2.3% vs. 7.1 ±1.7%, p < 0.001), weight loss (90.7 ±15.8 kg vs. 84.2 ±15.6 kg, p < 0.001), VF area (150.4 ±36.2 cm2 vs. 115.2 ±36.8 cm2, p < 0.001), and insulin resistance index (HOMA-IR) (5.8 ±4.3 vs. 4.2 ±2.9, p < 0.001). At 12 weeks, 48 patients with a history of T2DM of < 5 years lost weight (from 4–20 kg) and were not taking hypoglycaemic drugs because their blood glucose levels were completely normal. Throughout an observation period of 6 months, 89 patients did not regain weight and their appetite remained low after they had stopped taking beinaglutide. Insulin dosage was reduced for 23 insulin-dependent patients, with an average reduction of 12 U (between 8–28 U). Thirteen patients discontinued insulin and used oral hypoglycaemic agents for blood glucose control.
Table II
Changes in cardiovascular risk factors at baseline and at week 12
Beinaglutide dose
During treatment, we observed that beinaglutide was very different from other GLP-1 analogues. There was no fixed dose because the daily dose of the drug varied greatly. The daily dose ranged from 0.24 mg to 0.30 mg in 74% of patients, 0.06–0.18 mg in 12% of patients, and 0.36–0.48 mg in 14% of patients.
Drug safety
At 24 weeks, each patient underwent a physical examination and an electrocardiogram, and no abnormalities were found. Mild nausea was reported in 33% of patients, and transient dizziness occurred during the drug drip period. Some patients reported finding oily food disagreeable, whereas most reported no issues with food. None of the patients developed rashes or allergic reactions, and none had diarrhoea. No thyroid tumours were found. Six percent developed mild hypoglycaemia, and 5% experienced mild hunger 2 h postprandially but no hypoglycaemia. Following the beinaglutide injection, 4% of patients developed mild drowsiness for a period of between 15 and 20 min.
Discussion
GLP-1 is a peptide hormone produced by intestinal L cells in response to feeding and during meals, it is secreted in two stages [28]. The first peak occurs approximately 15 min after the beginning of the meal, when food in the stomach and initial portions of the intestine stimulates the release of hormones, such as glucose-dependent insulinotropic polypeptide (GIP), which stimulates L cells via vagal pathways. A second peak occurs after direct stimulation of L cells by nutrients. The effects of the active forms of GLP-1 (7–36) are mediated by a G protein-coupled receptor, GLP-1R, which is expressed in several sites, including enteric and vagal nerves, the stomach, pancreas, intestine, and various regions of the brain [29]. The physiological functions of GLP-1 include insulin secretion stimulation; glucagon secretion inhibition; protecting β-cells through endoplasmic reticulum stress reduction; reduction of food intake; stomach emptying reduction, thereby reducing the postprandial glucose peak; improvements in cardiomyocyte glucose utilisation, cardiac function, and cardiovascular protection [25, 30, 31]; and appetite suppression at the level of the hypothalamus and the promotion of weight loss [32–34]. Additionally, recent evidence suggests that GLP-1 RA may have a direct action (independent of central nervous system (CNS) actions) in the white adipose tissue inducing browning, enhancing lipolytic capacity and mitochondrial biogenesis [35].
In our study, 32% (34 patients) of subjects no longer fulfilled the criteria for T2DM after 3 months of beinaglutide treatment. Twenty-one patients who discontinued insulin and switched to oral hypoglycaemic drugs also achieved normal blood glucose levels. It appears that this finding was associated with a significant improvement in insulin resistance or recovery of islet β-cell function. No significant adverse events were observed. Unlike previous fixed-dose studies involving GLP-1 analogues, we observed that the effective doses of beinaglutide treatment varied widely. One study showed that high doses of GLP-1 resulted in reactions such as vertigo, paraesthesia, chills, nausea, and vomiting [36], while individualised doses could effectively avoid such adverse events. This was reflected in the causal complexity and heterogeneity of T2DM.
This study demonstrated that the GLP-1 dose required by each patient was different and, therefore, physicians should consider the individual needs of patients taking GLP-1. Two patients who did not respond to liraglutide also achieved good weight loss, but the reason for this was not clear. However, it may have been related to the use of more suitable doses or the use of fully homologous GLP-1. This information helps to better understand patients with GLP-1 analogue treatment failure. A limitation of our study was the small number of participants and the lack of a control group. However, we demonstrated that homologous GLP-1 can enable weight loss in a short period, amounting to 5.4% in 12 weeks. Three injections in a day may be advantageous for the effectiveness of GLP-1 analogues; it was speculated that the three drug peaks before the three meals were related to appetite suppression. The strengths of our study include the real-world setting and finding GLP-1 (7–36) dose differences between humans. These agents have enabled further tailoring of treatment to each patient. We know that bariatric surgery is effective for obese people with type 2 diabetes, but considering the possible complications, we should choose the weight loss method that has less influence on the body, with beinaglutide as one of the options.
In conclusion, supplementation with the appropriate amount of beinaglutide rapidly reduced VF, body weight, and blood glucose levels and decreased cardiovascular risk factors. GLP-1 doses should be individualised because appropriate doses varied widely. A lack of GLP-1 might be responsible for the onset of obesity in patients with T2DM. Due to the limited sample size and lack of control group in this study, large-scale randomised controlled trials are needed to demonstrate the efficacy and safety of beinaglutide in future.